Monitoring diverse IT endpoints with custom SNMP monitoring
As our world becomes more connected, the number of network devices is growing at an unprecedented rate. This poses a challenge for network administrators who need to keep track of all the devices that are added to their network every day. Relying only on monitoring tools with a standard device repository may no longer be sufficient, leading to monitoring gaps and leaving the network vulnerable to potential security risks.
Imagine that you have a device that appears as "unknown" in your monitoring tool. In this scenario, you may not be aware of the type of firmware that the device is running. Consequently, this firmware may contain a vulnerability that malicious actors can leverage to gain unauthorized access to your network.
However, custom SNMP monitoring can offer a solution to achieve complete visibility over your network. With custom SNMP monitoring, you can comprehensively monitor devices that are not predefined within your monitoring tool or track additional metrics for devices that can be currently observed.
So, what exactly is custom SNMP monitoring, and how can it help you? Let's explore and find out!
What is custom SNMP monitoring?
Device vendors typically provide device templates that monitoring tools use to identify and understand the device being monitored and what metrics can be collected. Device templates offer information about a device to help the network determine its type, and monitoring tools use the Simple Network Management Protocol (SNMP) to collect performance data based on these templates.
However, with the increasing complexity of network devices, relying solely on standard templates may no longer be sufficient. There may be instances where a monitoring solution lacks a template for a specific device that needs to be monitored. Alternatively, as an administrator, you may want to monitor a metric or obtain exhaustive data in a tabular format that is not offered by default in the device templates. In such cases, custom SNMP monitoring can provide a solution by offering visibility for devices without existing templates.
How does custom SNMP monitoring work?
Let's first understand how SNMP works.
- Here are the components of SNMP:
- SNMP manager: A software system that uses SNMP to collect data for fault management, performance management, and capacity planning.
- Managed devices: Any network device, such as routers, switches, printers, or wireless devices, managed by the SNMP manager.
- SNMP agent: A software process that responds to SNMP queries from SNMP managers to provide the status and statistics of a network node.
- SNMP management information base: A format defining the information exchanged in an SNMP system, where each SNMP agent holds a database detailing the device parameters it manages.
- SNMP object IDs (OIDs): A hierarchical collection of managed objects to track performance metrics.
- But how do we make sense of all this? That's where monitoring tools come in. Monitoring tools request data from the device and categorize it based on device templates.
- Device templates are structures that define a device and contain performance metrics that correspond to each OID.
- Finally, the monitoring tools take all this data and display it in an easy-to-understand format.
So, the next time you're monitoring your network, you'll know just how these tools work behind the scenes.
Monitoring tools offer a range of device templates that cater to various types of devices. With custom SNMP monitoring, you can:
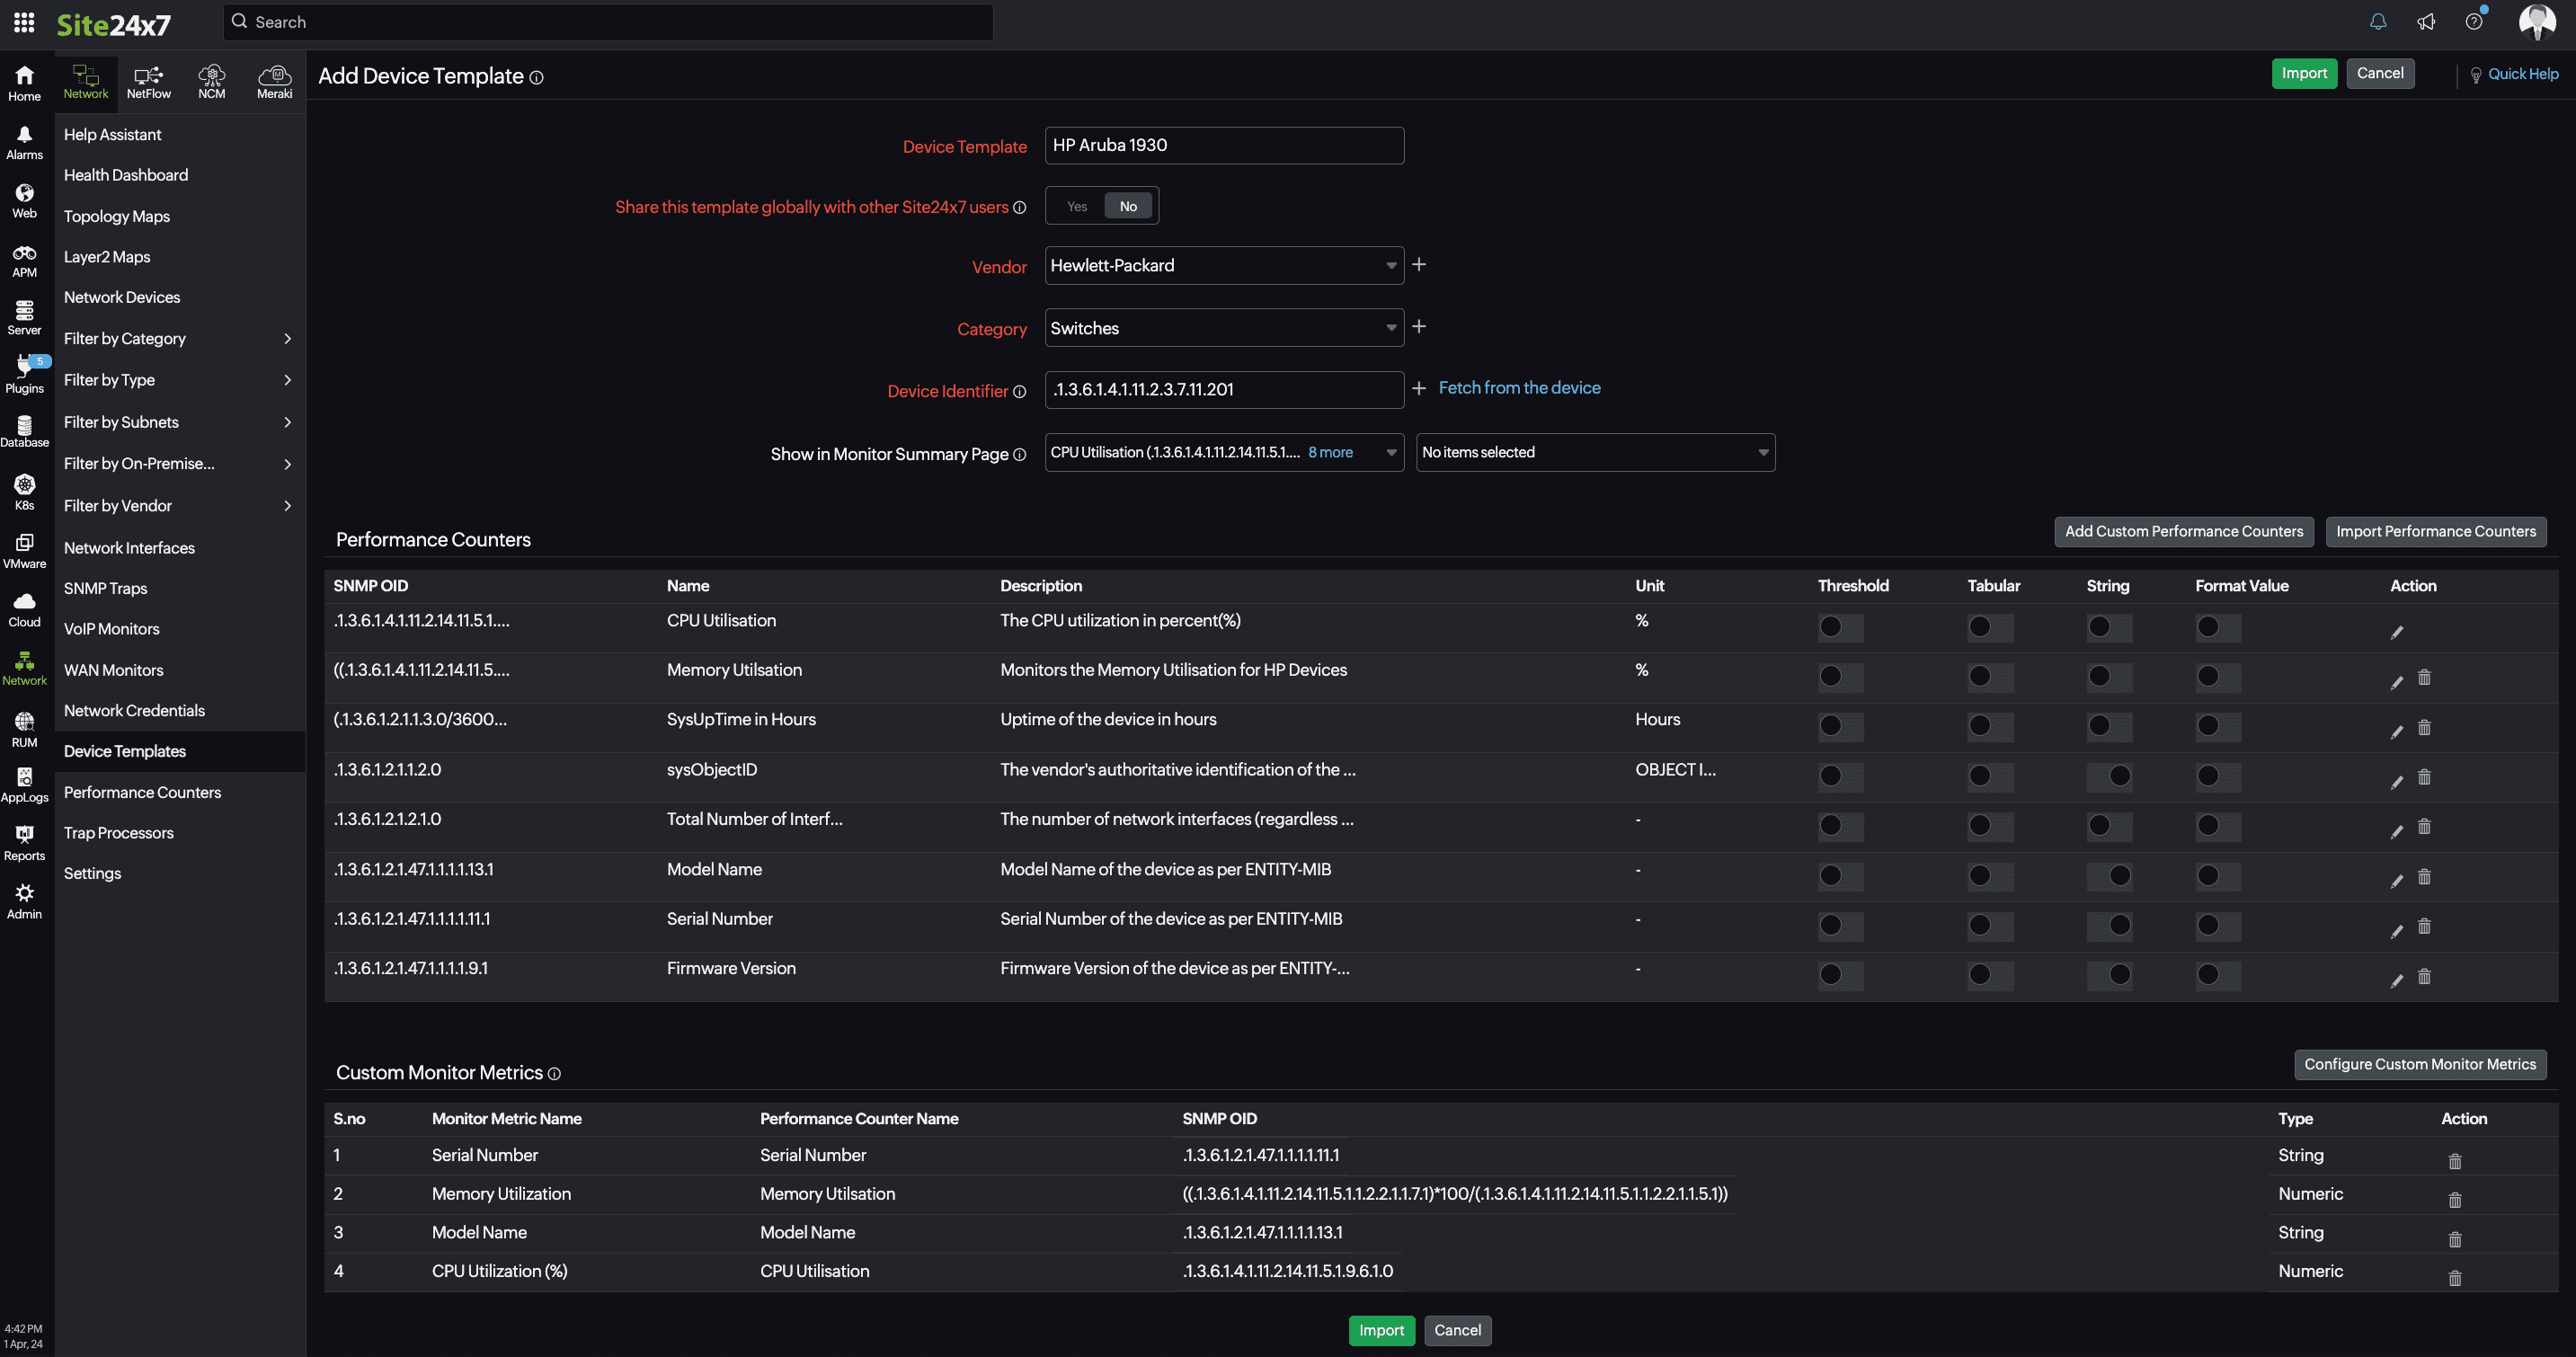
- Add new custom device templates or modify existing ones to suit a device better and collect performance data.
- Create new custom performance counters to monitor specific attributes in addition to the standard performance metrics.
Mathematical operations on custom performance counters
A custom performance counter provides you with the flexibility to perform mathematical operations to arrive at the data that you require.
For instance, if you need to find out the memory utilization percentage of a Cisco router but there is no direct performance counter that can track the value, you can create a custom performance counter. The value can be obtained from the mathematical expression (A*100)/(A+B), where:
- A = 1.3.6.1.4.1.9.9.48.1.1.1.5.1 (The OID contains the current number of bytes in use by applications from the memory pool on the managed device.)
- B = 1.3.6.1.4.1.9.9.48.1.1.1.6.1 (The OID represents the number of unused bytes in the memory pool on the managed device.)
This way, you can easily customize performance counters to suit your specific monitoring needs.
How does custom SNMP monitoring help?
As an administrator, you want to keep track of a device's performance, health, traffic, and configuration within your network. But how do you do that? Monitoring tools like Site24x7 use SNMP to collect and process data, which is then presented to you in a simple and understandable format on a dashboard. Site24x7 provides over 11,000 default device templates that enable you to monitor different types of devices.
Additionally, with custom monitors, you can improve visibility by creating custom device templates with Site24x7's network monitoring features to quickly categorize any new devices added to your network. This way, you can ensure that there are no unknown devices in your network, and you have a clear view of every device's performance. You can monitor traffic details to detect any unusual activity, track device configurations to prevent unauthorized changes, monitor firmware vulnerabilities, and ensure network compliance.
So, whether you're working remotely or managing an office network, custom SNMP monitoring gives you peace of mind with the knowledge that you have detailed insights into your devices' performance, health, traffic, and configurations. You can keep a watchful eye on diverse endpoints within your network, and you can customize the data to view it in a format that works best for you.
Give it a try, and see how it can help you optimize your network's performance!
Comments (0)