Databases rarely get the spotlight—until something breaks. A slow query, a locked table, or an unexplained spike in latency can bring an application to a crawl, leaving users frustrated and teams scrambling.
This blog dives into the key metrics every database team should monitor—from query performance and lock waits to latency and resource utilization—and how tracking these indicators helps ensure optimal efficiency, stability, and user experience.
Why metrics matter in database monitoring
Monitoring isn’t about collecting numbers for the sake of it. Each metric provides insight into how the database engine behaves under real-world load.
Metrics can do the following provided they're properly tracked:
- Reveal bottlenecks before they impact end users.
- Guide in capacity planning and resource optimization.
- Support debugging with root cause analysis during performance incidents.
- Ensure SLA compliance through consistent response times.
- Drive proactive tuning to prevent recurring slowdowns.
A well-instrumented database monitoring setup helps teams move from reactive firefighting to proactive optimization.
1. Query performance metrics
Query throughput
QPS, which is the number of queries executed per second, indicates how much work your database is handling. A sudden dip in throughput may signal application slowdowns, while sustained spikes may point to scaling needs.
Monitoring throughput alongside CPU and memory utilization helps correlate load changes with performance degradation.
Slow queries
Slow queries are often the root cause of degraded database performance. Even a small inefficiency in a query that runs thousands of times per hour can drain CPU and I/O resources. Monitoring execution time, I/O cost, and query plans helps uncover performance bottlenecks and prioritize query optimization efforts. With Site24x7, you can identify trends in query latency across databases and take corrective actions before users notice slowdowns.
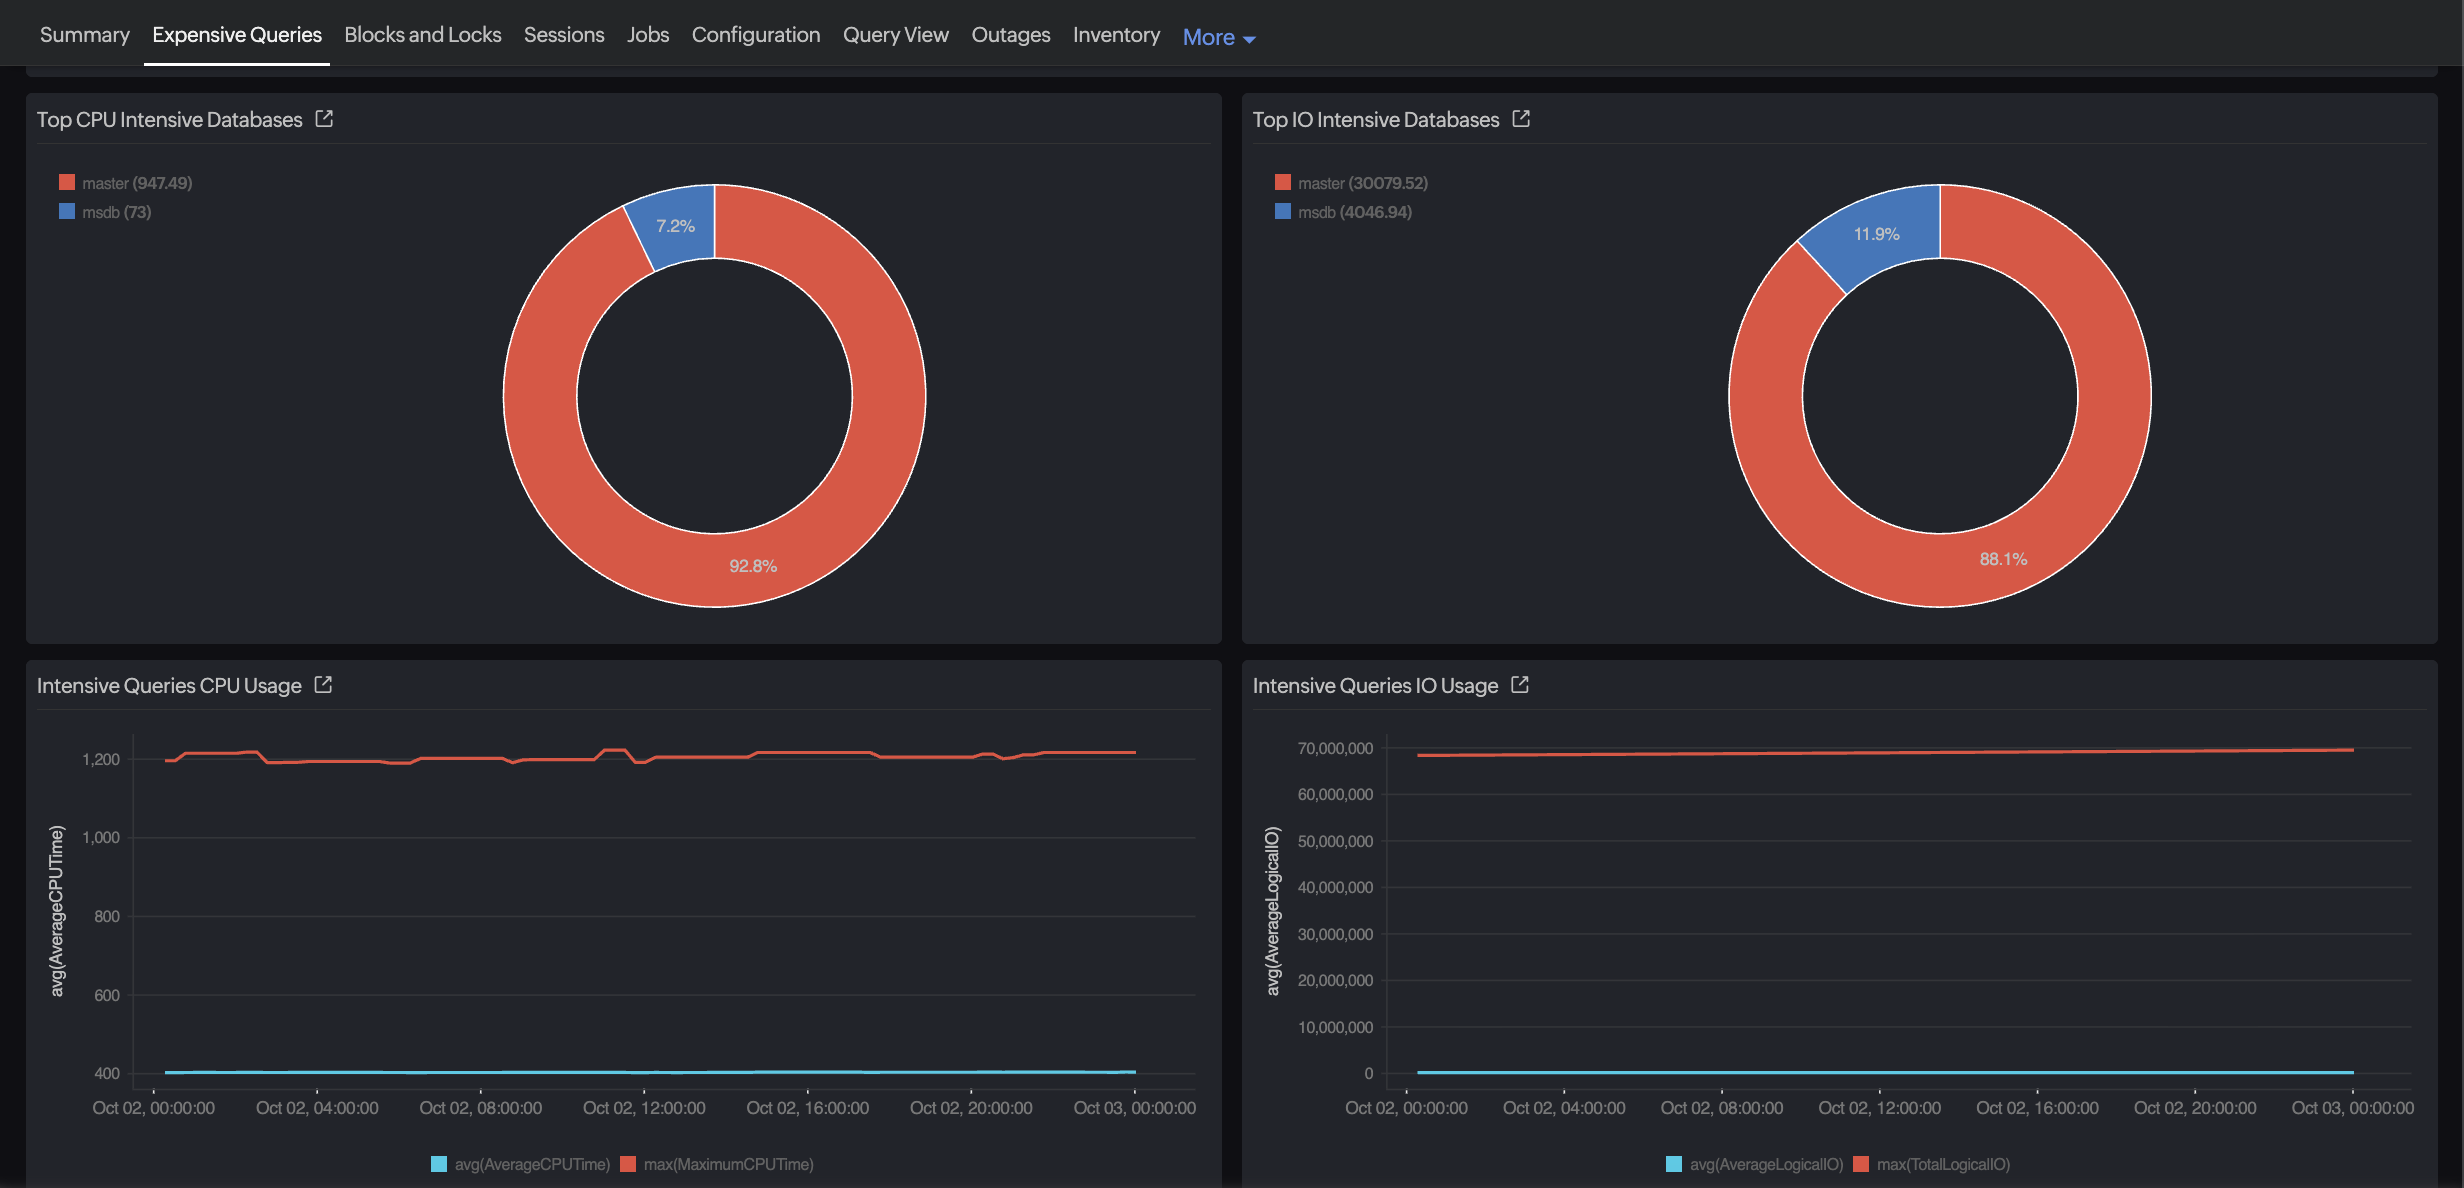
Top queries and resource consumers
Not all queries slow down the database—but some consume an outsized share of system resources. Monitoring top queries by execution time, CPU usage, and I/O activity helps you pinpoint where the bulk of your resources are going. This insight is key for capacity planning and performance tuning. Site24x7 surfaces the most resource-intensive queries and sessions, enabling teams to optimize high-impact workloads, rebalance resources, and maintain consistent database performance under varying loads.
Query execution plan changes
Execution plans can shift with schema updates, statistics changes, or optimizer decisions. Track plan stability—sudden changes in join strategy or index usage often explain performance regressions.
2. Latency and response time metrics
Latency reflects how quickly a query or transaction completes from request to response. It can be broken down into multiple components:
- Execution time: The actual time spent running the query.
- Wait time: The time spent waiting for locks, I/O, or CPU.
- Network delay: The time it takes for results to reach the application layer.
A spike in overall latency may not always mean inefficient SQL—it could result from storage delays or blocked sessions. Monitoring percentile-based latency (P95 and P99) provides a more realistic picture than averages, since outliers often define the user experience.
3. Database: Deadlocks, blocking sessions, and waits
Concurrency is both the strength and challenge of database systems. Multiple transactions trying to access the same data can lead to lock contention.
Lock waits
The number and duration of lock waits are key to understand the behavior of your applications. When the number is on the rise, it indicates transactions are spending more time waiting than executing, leading to application slowness.
Blocking sessions
By identifying the sessions and queries that are blocking others, you will be able to isolate the root causes of contention. Long-running updates or poorly designed transactions often cause cascading delays.
Deadlocks and lock escalations
Deadlocks happen when two or more sessions prevent each other from progressing. Some databases, such as Microsoft SQL Server, feature lock escalation, which can intensify contention during bulk operations. Tracking the frequency of deadlocks, lock escalations, and the queries involved enables DBAs to optimize transaction design or adjust isolation levels to reduce contention.
Wait statistics
Every database engine surfaces wait statistics (for example, I/O, latch, memory, or lock waits). These stats will help you understand whether waits stem from resource saturation or inefficient query design.
Waits reveal where queries spend time. Common wait categories include:
- CPU waits: Scheduler or context switching delays.
- I/O waits: Disk or log write delays.
- Lock and latch waits: Concurrency or resource contention.
- Network waits: Communication or data transfer delays.
- Memory waits: Resource starvation from paging or buffer pressure.
By classifying waits this way, you can differentiate between hardware saturation (e.g., I/O waits) and inefficient query design (e.g., lock or latch waits), improving root cause accuracy.
4. Resource utilization metrics
Resource metrics are key to ensure the database host itself isn’t the bottleneck.
- CPU utilization: Prolonged and high CPU utilization could signal missing indexes, poorly optimized queries, or excessive parallelism. Also watch for context switching and spinlocks, which consume CPU cycles even when threads are idle, signaling synchronization inefficiencies. Parallelism overhead is another factor—overaggressive parallel query execution can increase CPU load without improving throughput
- Memory utilization: Buffer cache, sort memory, and memory grants need to be tracked, as low cache hit ratios or frequent paging indicate memory pressure or insufficient allocation.
- Disk I/O: Track read/write throughput and I/O queue lengths, as high disk latency directly impacts query response times.
- Network utilization: Peak network traffic may point to large data transfers, inefficient query fetch sizes, or network bottlenecks.
Thus, you can separate expected load patterns from anomalies by correlating these metrics with database events (e.g., batch jobs or backups).
5. Storage and I/O metrics
Storage performance governs how fast data is read from or written to disk.
- I/O latency: The time taken to complete read/write operations.
- Disk throughput: The volume of data processed per second.
- Checkpoint activity: The frequency and duration of checkpoints affect write performance.
- Log file I/O: Transaction log write speed impacts commit latency.
By tracking these trends, you can detect early signs of storage contention, disk failure, or misconfigured caching layers.
6. Connections, sessions, and transactions
Connection and session monitoring ensures your database can handle concurrent workloads.
- Active connections: Track how many sessions are open and running queries. Sudden spikes may exhaust connection pools.
- Transaction rate: Commit and rollback counts show database activity levels and transaction efficiency.
- Connection wait time: If new connections wait for long durations, connection pool or authentication bottlenecks may exist.
Maintaining connection efficiency is crucial for both resource management and application scalability.
7. Cache and buffer hit ratio metrics
Databases rely heavily on caching mechanisms for performance.Monitor:
- Cache hit ratio and buffer hit ratio: Indicate how often data is retrieved from memory rather than disk. Low ratios suggest cache inefficiency or memory pressure.
- Query cache hit ratio: For databases like MySQL, the query cache stores SELECT query results. Monitoring the query cache hit ratio shows how often results are served directly from the cache rather than re-executed—low hit ratios may indicate ineffective caching strategies or non-cacheable queries.
- Page life expectancy: How long a page remains in cache before eviction—shorter lifespans indicate excessive churn.
- Index usage and fragmentation: Regularly tracking index fragmentation levels ensures queries continue leveraging indexes efficiently.
Healthy caching significantly reduces I/O overhead and improves response times.
8. Error and availability metrics
Availability metrics ensure that your database remains accessible and reliable.
- Error rate: The count of failed queries or transaction rollbacks.
- Timeouts and disconnects: Sudden increases usually point to contention or network instability.
- Replication lag: The time delay between primary and replica databases (for systems employing master-replica architecture).
- Backup and restore success rates: Missed backups or failed restores are early indicators of operational risk.
Proactive monitoring of these metrics helps prevent downtime and data loss.
Establishing baselines and alerting
Metrics are meaningful only when compared against normal performance. Establish a baseline for each key indicator—throughput, latency, cache ratio, and wait times—during stable operation.
- Baseline definition: Capture typical behavior for throughput, latency, cache ratios, and waits during stable operation.
- Dynamic thresholds: Configure adaptive thresholds that reflect workload cycles.
- Correlation-based alerts: Link related metrics (e.g., lock waits + CPU spikes) for faster root cause isolation.
- Multi-level severity: Set tiered alerts (e.g., warning or critical) to avoid alert fatigue.
- Anomaly detection: Leverage ML-driven tools like Site24x7’s AI engine for early deviation detection.
A mature monitoring setup should evolve with workload growth, schema changes, and version upgrades. Also including visual dashboards or metric graphs—such as query latency trends, lock wait heatmaps, or CPU-I/O correlation charts—can make these patterns instantly recognizable for teams.
How Site24x7 simplifies database monitoring
Site24x7 has extended its database monitoring capabilities to support popular databases like Oracle, Microsoft SQL Server, MySQL, and PostgreSQL. The platform captures granular metrics across query execution, connection activity, locks, I/O, and memory usage—consolidated in intuitive dashboards.
With AI-powered anomaly detection, Site24x7 automatically identifies deviations from baseline patterns and alerts you before end users experience slowdowns. Built-in correlation views let you trace issues across queries, resources, and infrastructure layers in a single console—eliminating the need for manual log hunting.
Whether it’s tracking query latency spikes, monitoring buffer cache efficiency, or diagnosing blocking sessions, Site24x7's database monitoring features help you ensure databases run efficiently, reliably, and cost-effectively.
Summing up
Database performance monitoring is more than keeping an eye on CPU or disk metrics—it’s about understanding how every query, lock, and transaction contributes to end-to-end performance.By focusing on the right set of metrics—queries, locks, latency, resource utilization, and availability—teams can uncover root causes faster, plan capacity better, and maintain consistent performance under growing workloads.
With platforms like Site24x7, these insights come together in one place, giving you the confidence to run mission-critical databases without blind spots.