Modern cloud-native applications are designed as microservices at a large scale with an ephemeral nature. Kubernetes is a perfect match for running these flexible and scalable applications; however, its layered architecture makes monitoring a challenge.
This guide presents a way to evaluate Kubernetes monitoring solutions, showing how unified metrics, logs, and traces deliver complete Kubernetes observability.
Introduction: The Kubernetes imperative
Kubernetes serves as the fundamental base for all cloud-native operational workflows. It scales easily across clusters and clouds. However, it also introduces new failure points and additional layers of complexity—as well as massive amounts of monitoring data.
How your SRE practice advances depends on your monitoring approach: An incorrect choice will produce excessive noise that hinders its development.
Put simply, the Kubernetes imperative is this: As teams shift from monoliths to microservices, you gain speed and scale—but also volatility. Kubernetes orchestrates your containers—management, packaging, scheduling, self-healing, and service discovery. However, the dynamism of microservices architecture demands careful monitoring.
You need tooling that can follow short-lived workloads, preserve history across reschedules, and connect cluster symptoms to application impact.
Monitoring challenges
Traditional host-centric tools operate under a model that assumes machines stay stable during uninterrupted process operation. The operation of Kubernetes differs from traditional systems because pods undergo continuous changes, and IP addresses become accessible again after workloads receive new assignments.
A tool is useless if it fails to auto‑discover new objects; preserve history across pod restarts; and correlate signals across the cluster, node, pod, and application layers. Teams are then forced to waste on-call time searching through useless information.
Real remediation requires going beyond CPU charts. Teams must be able to track metrics alongside logs, traces, and events that follow a request path from ingress through service mesh hops to downstream databases. At the same time, they need to uncover latency and error symptoms along with their root causes, including resource saturation, deploy regression, and configuration drift.
The labyrinth of Kubernetes: Why monitoring challenges matter for tool evaluation
Before selecting a Kubernetes monitoring solution, you will first need to identify the particular hurdles that make your daily monitoring tasks more difficult.
Ephemeral nature of pods and containers
Kubernetes performs continuous pod rescheduling operations. This makes automatic discovery of new namespaces, workloads, and containers a must. A tool will also need to offer label-aware grouping and historical context preservation for objects after they are deleted.
Complexity of the control plane
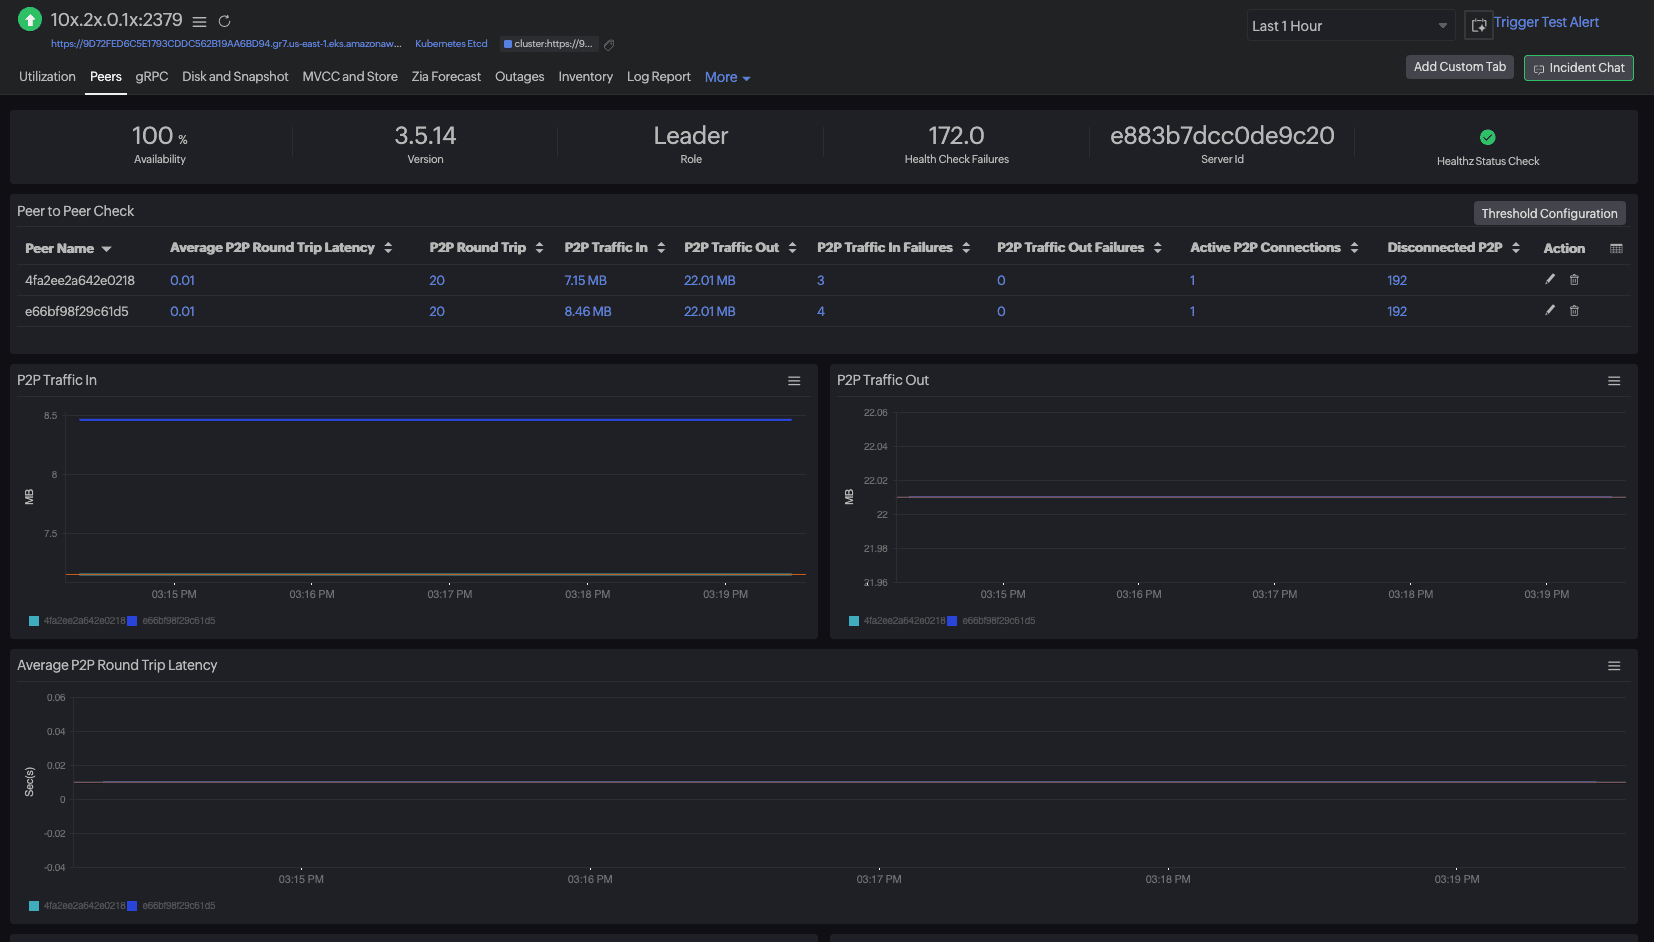
The brain of a Kubernetes cluster consists of the control plane components—API server, scheduler, controller manager, and etcd. You need to track the health status of each of these by monitoring request rates, latencies, and error codes.
Any performance degradation in the control plane can lead to multiple application problems, including failed deployments, pending pods, and deployment timeouts.
Multi‑layered abstraction
Kubernetes operates at six different levels: node, pod, container, deployment, service, and ingress. A monitoring solution should provide a cluster‑wide dashboard that summarizes all six and lets you drill down to any level (including individual containers) while preserving the same label set (for example: namespace, workload, pod, container) across every view.
Data flood
Kubernetes is known for massive data generation: metrics, logs, and events. To produce alerts pointing to real issues in need of immediate attention, a monitoring solution requires intelligent baselining, anomaly detection, and noise suppression. This ensures alerts are actionable.
Buyer's checklist: Essential evaluation criteria
The sections below will help you find the best Kubernetes monitoring tool for your organization.
Comprehensive data collection and granularity
A monitoring system should provide the following data with the required granularity levels:
- Pod and container-level metrics, e.g., CPU, memory, filesystem, and network I/O metrics, with percentile and burst data available for analysis
- Node health and performance data via CPU steal, memory, and CPU pressure indicators, as well as disk latency and kubelet system metrics
- Control plane telemetry, including API server request performance data, scheduler queue duration, etcd compaction, leader election, and admission webhook timing information
- Namespace‑level granularity through team/project-based slicing to show cost distribution across namespaces
- Application performance monitoring (APM) using code-level tracing, error detection, and service mapping
Visualization and dashboards
The visualization capabilities of a monitoring solution should provide:
- Real‑time cluster health: Red indicators along with their namespace and workload heatmaps for instant problem identification
- Service and dependency mapping: Including automatic service graphs to help users track how latency spreads through their system and determine the extent of its impact
- Customizable and prebuilt dashboards: With support for role-based access for SREs, developers, and managers, and including templates for EKS, AKS, and GKE
Automation and intelligence
The following automation capabilities ensure easy onboarding and long-term usability:
- Auto-discovery and onboarding: Enable automatic cluster detection and node and pod identification, followed by label annotation and lifecycle monitoring.
- AI‑powered anomaly detection and alerting: Detect anomalies through dynamic baseline creation, outlier detection, and forecast-based alerting that filters out unnecessary alerts.
- Root cause analysis (RCA): Link application impact to deployment and configuration changes, as well as any infrastructure anomalies.
Seamless integration with the DevOps ecosystem
The success of a Kubernetes monitoring platform will be directly tied to how well it integrates into your existing ecosystem:
- CI/CD pipeline integration: Including quality checks, gates, deployment markers on charts, and webhooks for rollbacks.
- Support for cloud‑native architectures: Via service mesh compatibility, plus serverless and managed Kubernetes (EKS/AKS/GKE) support.
- Extensibility and open standards: E.g., Prometheus metrics ingestion and OpenTelemetry (OTLP) to prevent vendor lock-in.
Quick comparison table: What to look for
| Capability | Why it matters | Features you need |
|---|---|---|
| Auto‑discovery | Keeps pace with scalability | Monitoring of new namespaces and workloads as they appear, while providing users with opt-out functionality |
| Control plane KPIs | Prevents cascading failures | API server latency histograms, etcd health, scheduler queue depth |
| APM + tracing | Links symptoms to causes | End‑to‑end tracing, including database and external system interactions and detailed per-span data with code-level context |
| Logs correlation | Speeds diagnosis | Ability to access logs of failing pods via a single click and view logs filtered for specific labels |
| AI-powered anomaly detection | Cuts noise | Seasonal patterns to establish performance baselines and predict future capacity requirements for alerts |
| Open standards | Portability | Native OTLP and Prometheus compatibility |
Site24x7: The all‑in‑one solution for Kubernetes observability
The Site24x7 platform integrates infrastructure, application, network, and log monitoring capabilities into a single unified system—eliminating the need to integrate multiple single‑purpose tools (for logs, metrics, tracing, etc.).
With Site24x7, you get monitoring capabilities for:
- Website and API uptime
- Server and container metrics
- Application performance
- Log management
- Cloud platforms
- Network devices
Users enjoy a single data model that sources signals from all system layers, allowing them to combine deployment markers (release timestamps) with latency spikes—making it obvious when a specific change caused a performance regression and helping teams troubleshoot faster.
Site24x7 also offers a wide range of integrations to connect to your existing tools.
Deep dive into Site24x7's Kubernetes monitoring capabilities
Site24x7’s monitoring suite allows you to switch from cluster health to container detail in just a few clicks.
Out‑of‑the‑box support for Kubernetes
A lightweight agent, deployed via DaemonSet or Helm, will start collecting metrics in both on-premises and managed Kubernetes environments (EKS, AKS, GKE).
The Kubernetes monitoring help docs provide the starting point for deploying Site24x7’s Kubernetes monitoring agent, while the Helm chart enables fast installation and a Helm values.yaml option to disable container auto-discovery for detailed monitoring.
Comprehensive metrics and insights
The Site24x7 platform tracks:
- CPU and memory usage
- Disk and network input/output operations
- Resource requests
- Pod restarts
- Node pressure states
- Control plane health status
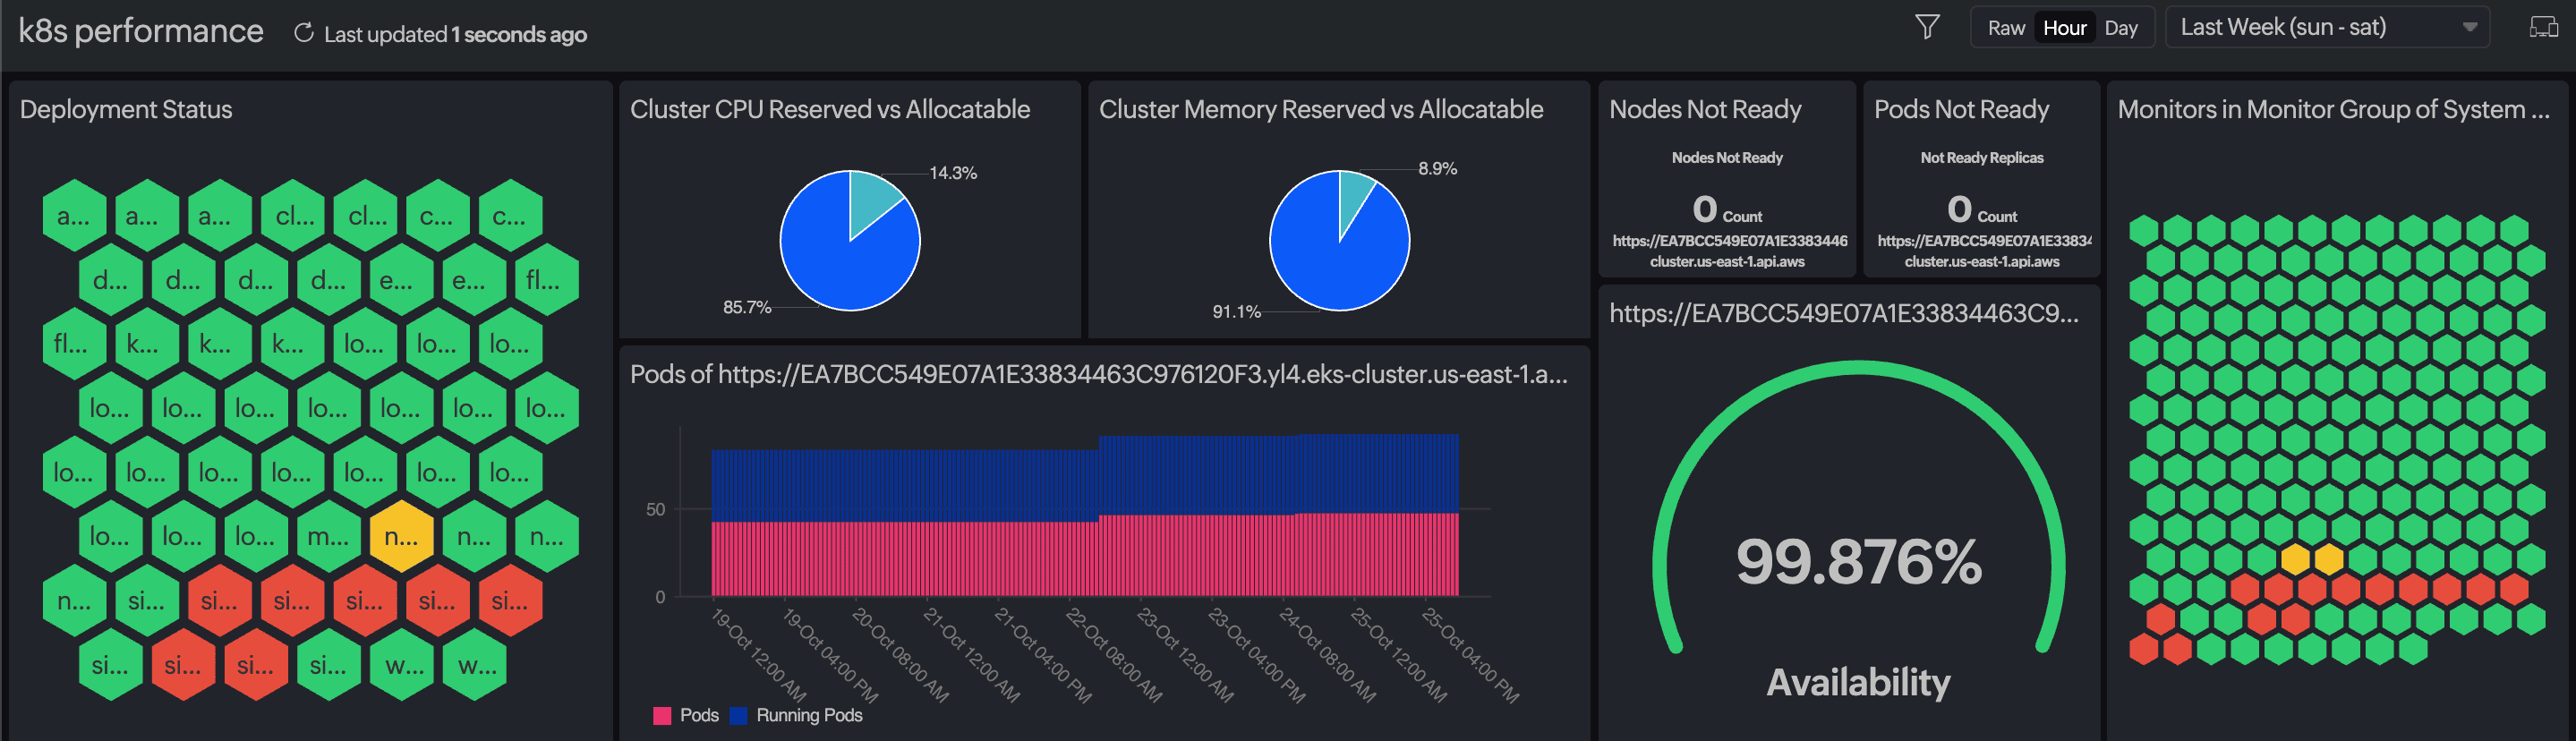
Meanwhile, the Kubernetes monitoring overview shows at‑a‑glance coverage and health—what clusters, namespaces, nodes, and workloads are being monitored, plus agent/DaemonSet status and hotspots.
Use the step-by-step deployment guide to walk you through enabling metrics, logs, and tracing across your clusters.
Interactive dashboards and topology maps
Visualize dependencies across services and infrastructure to understand blast radius and ownership. See relationships and health paths with topology maps, and bring hosts, resources, and locations together using infrastructure maps.
AI‑powered troubleshooting and forecasting
Detect outliers and anticipate capacity needs using anomaly detection and broader AIOps capabilities that learn seasonal baselines and cut alert noise.
Beyond metrics: Integrated log management and distributed tracing
Site24x7 goes beyond infrastructure metrics by unifying AppLogs and distributed tracing, allowing teams to quickly pivot from an alert to the exact span or log line that explains customer impact:
- Centralized log management: Ingest cluster and application logs into a unified index with AppLogs. Define log profiles and types, search by Kubernetes labels, and pin queries to dashboards using AppLogs log management.
- End-to-end distributed tracing: Follow a request across microservices, identify slow spans and external calls, and trace them back to the originating pod or container.
- OpenTelemetry (OTLP) integration: Combine distributed tracing with OpenTelemetry integration to preserve portability and avoid vendor lock‑in.
Seamless integration for the modern DevOps workflow
Site24x7 seamlessly integrates into your delivery toolchain and operating model:
- CI/CD pipeline integration: Deployment markers and alerting/rollback webhooks can be added to dashboards using third-party integrations for collaboration and ITSM.
- Single pane of glass for your entire stack: The plugins catalog allows users to monitor additional resources beyond the default monitors by supporting databases, web servers, and message brokers; you can also create custom plugins for specific needs.
- Easy collaboration between Dev and Ops: The implementation of shared dashboards, unified alerting systems, and standardized labels enables teams to debug using identical context, resulting in lower MTTR.
From alert to RCA: A 5-step flow in Site24x7
The following Site24x7‑guided flow provides a step-by-step approach for both evaluation and real incident management. It allows you to track down root causes without leaving the platform through its direct connection to Site24x7 views:
- 1.Detect: The system generates alerts through threshold detection, which includes detailed information about namespace deployment status, recent modifications, and SLO performance.
- The alert provides direct access to the cluster health view, so users can begin their investigation from a unified information source.
- 2.Triage: The cluster overview allows you to verify the affected scope by namespace and workload. It will then display control-plane panels for API latency, scheduler queues, and etcd health status.
- The platform enables users to distinguish between application performance issues and system problems.
- 3.Trace: Teams can access the affected service for tracing purposes via the Application Dependency Maps (Service Maps) interface. The example request trace helps you identify performance bottlenecks that occur at database calls, external API interactions, or microservice connections.
- Deployment markers enable users to identify when specific rollouts caused performance spikes.
- 4.Correlate: Pod/container metrics enable you to check for CPU throttling, memory pressure, restarts, and noisy neighbors that occur on the node.
- Users should verify request limits and check for any recent autoscaling operations.
- 5.Validate and act: AppLogs allows you to view pre-filtered data through Kubernetes labels. In Site24x7, use AppLogs (with deployment markers) to verify the exact error signature and identify the version and commit that introduced it.
- Make sure to then save the query to an incident dashboard accessible to all team members.
This flow enables teams to follow the incident story sequence from left to right, i.e., from metrics to traces to logs, ending in a verified root cause and remediation.
Conclusion: Making the right choice for your Kubernetes environment
A successful monitoring system for Kubernetes requires:
- Automatic discovery capabilities
- Control-plane monitoring
- Deep application performance monitoring
- Tracing and quick log analysis
- Anomaly detection with open standards (to prevent vendor lock-in)
Site24x7 provides a unified platform that combines metrics, logs and traces, and network data—all under one platform with shared context without requiring users to switch between tools.
Users enjoy end-to-end visibility through Site24x7 ‘s built-in OpenTelemetry (OTLP) and distributed tracing capabilities. Meanwhile, its Kubernetes-native auto-discovery and guided RCA flows reduce MTTR for EKS/AKS/GKE and on-premises environments.
Get a complete picture of the health and performance of your Kubernetes clusters. Start a free trial of Site24x7’s Kubernetes monitoring today.