Real User Monitoring (RUM) tool
Deliver a high-quality digital experience by gaining real-time visibility into user behavior and performance. Leverage AI-powered RUM for:
- User experience optimization
- Customer behavior analysis
- Actionable insights for data-driven decision-making
- AI-powered alerts for proactive problem solving


Deliver a flawless digital experience with AI-powered real user monitoring
Gain granular insights into your users' real-time interactions on your website. Enhance observability using key real user monitoring (RUM) metrics, such as page load times, core web vitals, and secondary metrics, to identify performance issues. Leverage session replay for detailed analysis of user workflows and make data-driven decisions to achieve a seamless user experience—all in real-time.
Analyze front-end performance
Get detailed metrics on network, front-end and back-end response times. You can also compare data and analyze webpage performance for different time periods.
Track all your internal pages loaded from client based MVC frameworks like Angular, Backbone, React and Ember. Understand the response time and throughput of each AJAX call and fine-tune its performance.
Visualize performance across geographies
Understand how your website performs across various geographies through easy-to-use graphs and charts. Determine if performance is excellent, good, moderate, poor, or bad when accessed from different countries.
Identify anomalies with AI-powered alerts
Get alerted whenever there is a slight deviation from your website's normal behavior and proactively troubleshoot issues before your users are affected.
Collect custom data from user journeys
Collect custom attributes like user names, environment, and business-critical actions for real-time product analysis.
Integrate RUM with application monitoring.
Get a holisitic view of front-end and back-end performance under a single console by integrating RUM with APM Insight.
A guide to optimizing Core Web Vitals with RUM
Understand Core Web Vitals and its impact on user experience. Learn how optimizing these metrics can lead to faster, more user-friendly websites.
Monitor and visualize user journeys in real-time
Proactively monitor every step of your user journey with our AI-powered RUM monitoring tool. Instantly identify and troubleshoot potential bottlenecks before they affect your users.

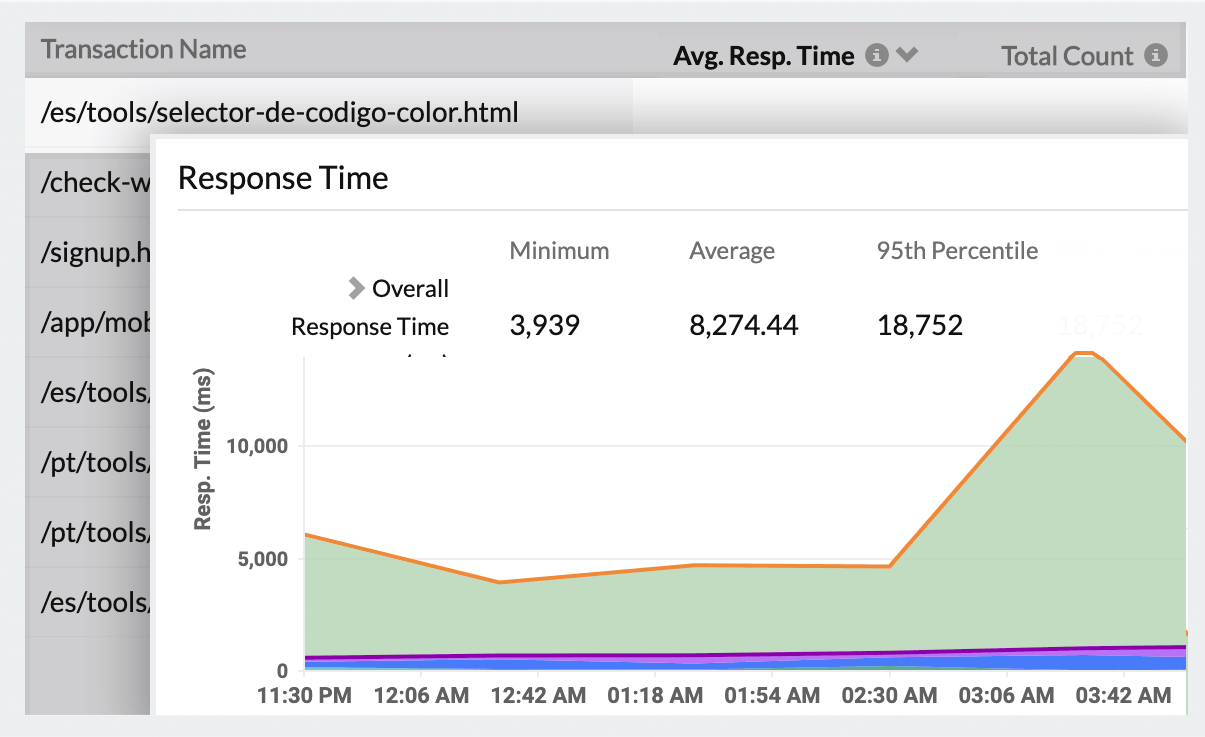
Identify slow-performing transactions
Analyze the response time and throughput of individual web transactions with graphical representations. Obtain performance insights quickly by measuring the response time and throughput of every single web page. Find out if a single URL is slowing down your entire website.
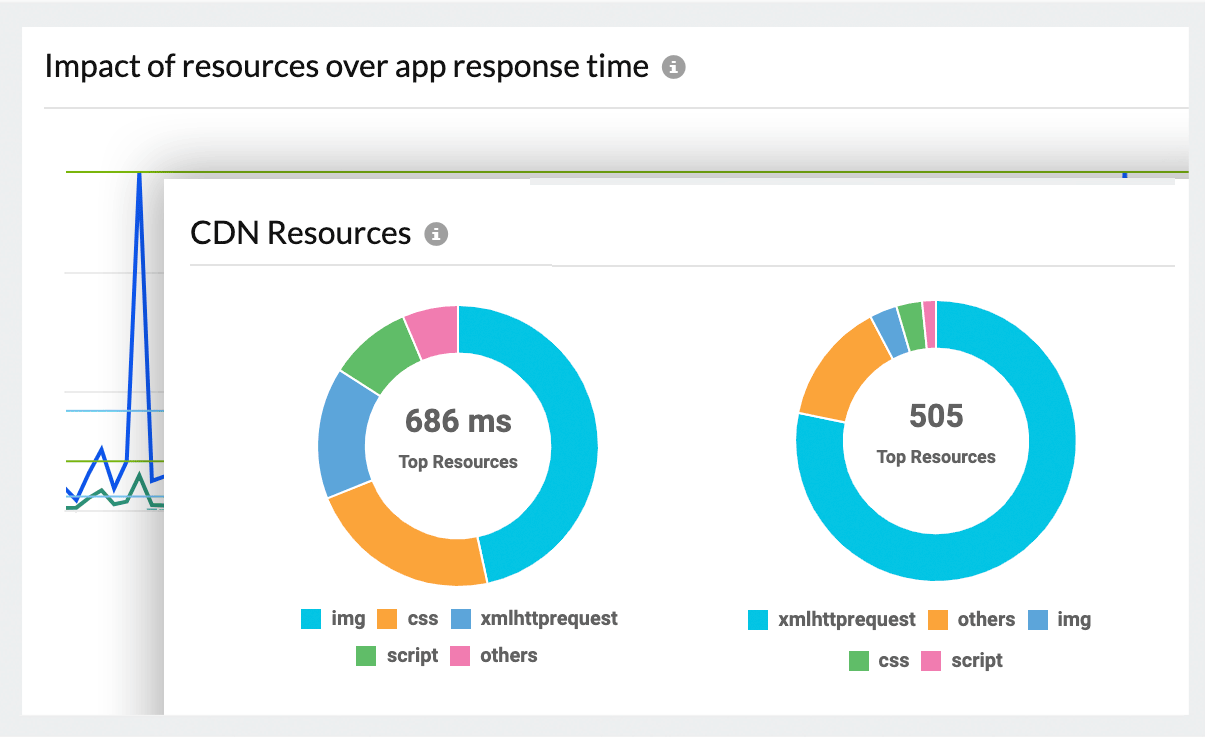
Measure the impact of individual resources
Monitor the time taken by various resources like CSS, scripts, and images, and identify each component's impact on overall response time. Monitor the time taken by individual resouces while loading from varied domains like first-party, thrid-party, and CDN networks and their impact on overall application response time.


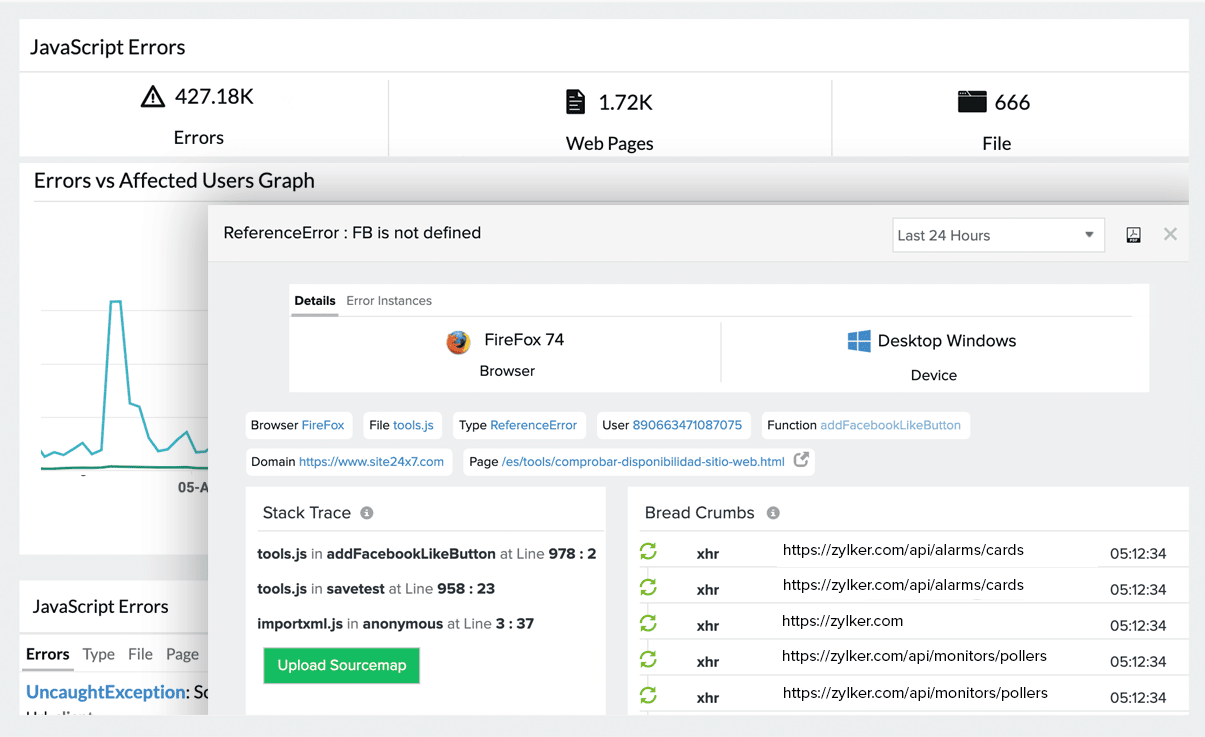
Pinpoint JavaScript errors
Using Site24x7 RUM, you can catch any JavaScript code errors which may be present on your webpages. You will get detailed data on the error type, message, and URL allowing you to take prompt action and improve webpage performance.
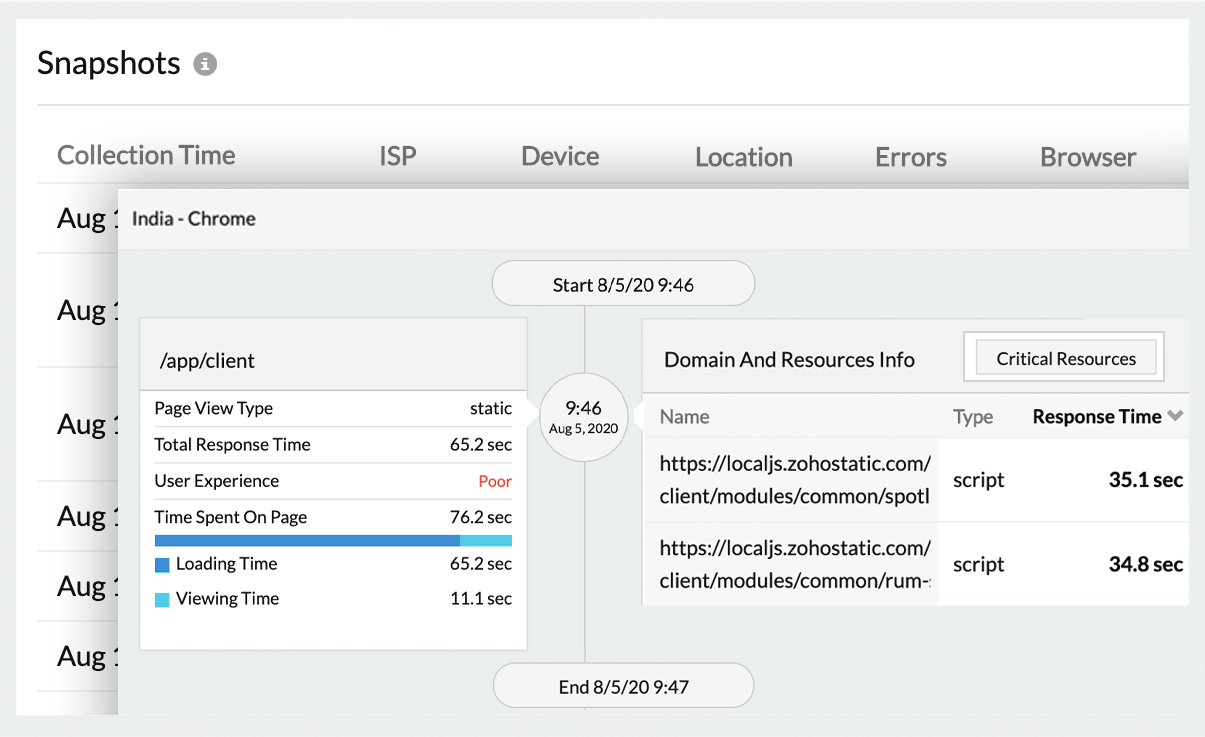
Analyze and replay user sessions
Get detailed performance metrics to identify individual user sessions and a snapshot whenever there is a threshold breach. Analyze the beginning and ending of each session, time spent on individual URLs, reponse time of critical resources, and user experience across each page.


