High CPU usage in Java applications can bring your entire system to a crawl, causing slow response times or complete outages. While restarting the app or allocating more resources might offer a temporary fix, the underlying problem remains. To truly resolve Java high CPU usage, you must identify the specific threads monopolizing the processor—whether through OS-level commands, thread dumps, or modern profiling tools—and optimize the root cause in your source code.
Below are some of the top reasons why Java apps may consume an abnormal amount of CPU resources:
Since so many factors can influence your Java app's CPU usage, you must be mindful of this usage. You need to actively investigate any spikes that may occur to ensure they don't result in a slow and unpleasant experience for your users or take down your application completely. In this guide, you'll learn how to avoid high CPU usage in Java and identify issues in a production environment. You'll also see some popular tools that identify Java CPU usage issues.
Before getting into how to identify and fix CPU usage issues in Java, there are a few ways to write better code and avoid high CPU usage in the first place.
Exceptions take up a lot of CPU time when they are thrown. This is because exceptions terminate the usual flow of a program, and the Java runtime environment (JRE) needs to walk back through the call frames that led to the throw event to collect the data for the exception event. In applications where you're throwing too many exceptions, your app may be spending too much of its resources handling those exceptions instead of its actual business logic.
Exceptions can often pair up with other sources of high resource usage, like threading. For instance, the HTTPResponse.Redirect method throws a ThreadAbortException, which causes its host thread to exit when the exception is thrown. If you design your app to throw this exception too many times, your app will spend much time deleting and creating new threads, which will add to your high CPU usage.
You can cut down on some processing overhead by writing intelligent code. As noted above, recursion calls can often bubble up and consume a lot more resources than they normally should if they're not used effectively. Other than that, make sure you're handling in-code resources properly. Closing database connections when you're finished with them and handling object and thread lifecycles well can optimize resource consumption.
Multithreading has been both a boon and a bane https://medium.com/javarevisited/java-threadlocal-the-boon-and-the-bane-18263fa4f64 for Java programming. If not handled properly, threads can damage the resource efficiency of your application by hogging up resources and becoming impossible to track and terminate (see zombie processes https://stackoverflow.com/a/20689837/19597145). To ensure your Java CPU usage is not through the roof, ensure that you terminate threads when you're done with them and that the code responsible for cleaning up threads is not inaccessible at any point in time (due to any design flaws).
While it may sound unrelated, bad memory management can also lead to high CPU usage. If your Java app utilizes a large percentage of available memory, more frequent garbage collection (GC) cycles would be required to prevent the app from running out of memory completely. Each garbage collection run adds to the overall CPU utilization of the JVM.
Therefore, you must also look at memory utilization when troubleshooting high CPU usage. Writing code that handles objects and resources well and does not leave room for memory leaks or bloats is key to ensuring both memory and CPU utilization levels stay within reasonable limits.
Once you know how to keep your Java CPU usage low, you need an effective monitoring strategy to help monitor your app's CPU usage levels and apply fixes if it starts to spike. Here are a few methods and tools to identify CPU usage issues in production environments.
The simplest way to keep an eye on your Java CPU usage is to set up scheduled jobs that analyze the CPU consumption value at fixed intervals (say, every few minutes) and raise an alert if the value is higher than a threshold. While this is a great method to start with, it's quite primitive and not recommended in production environments since you will need to put in significant effort to set up and maintain advanced queries and checks manually. You can use tools to achieve the same objective more easily.
System-monitor and process-viewer tools like top https://man7.org/linux/man-pages/man1/top.1.html, htop https://man7.org/linux/man-pages/man1/htop.1.html, and others are useful for understanding the CPU consumption of the JVM or individual Java threads. If you are actively investigating a high CPU usage incident, you will often find yourself reaching out for these tools.
Profiler tools are advanced tools meant to give you deep insights into the performance data of your Java threads and apps. Profilers can provide much more than just CPU usage figures—they can help you visualize the allocation call tree, the call tree of interactions with your database, live memory usage, object instance counts, and more. You can easily investigate issues like slow database interactions, memory bloating, and frequent GC calls that often contribute directly to high CPU usage. Doing this is quite difficult with the previously mentioned basic tools.
While profilers are generally used to analyze the performance of local instances of apps, most profiles support remote profiling to directly attach to a deployed application and help you see into its internal state.
Monitoring tools take profiling up a notch by continuously tracking performance metrics for your production apps and sharing the data with you in real time. You can easily pair these with visualization tools to understand the data better, create dashboards and reports quickly, or use predictive analytics https://www.cigniti.com/blog/use-of-predictive-analytics-apm/ to analyze the trends in the performance data and predict its future changes.
Once you've picked up an instance of high CPU usage in Java, there are a few things you can do to gather more information about its cause.
If you have a system running multiple JVMs in parallel, you will need to identify the JVM consuming the most resources. A simple way to do this is to use OS-level tools to look at the resource consumption of all the running processes on your host. You can find the process ID (PID) of your Java application using jps -l or ps -ef | grep java. Using a system-level tool like top, you can quickly identify the process that's taking up the most CPU resources, pointing you toward the problematic JVM.
Once you have the JVM process ID, you need to pinpoint the exact thread. In Linux, you can run top -H -p <PID> to view the resource consumption of individual threads within that JVM process. Note the Thread ID (TID) of the thread consuming the most CPU, and convert that decimal ID into hexadecimal format.
Next, capture a thread dump using the jstack utility: jstack <PID> > dump.txt. Open the thread dump file and search for the hexadecimal TID (e.g., nid=0x...). This will directly lead you to the exact method and line of code that is executing within that high-CPU thread.
For modern Java applications (JDK 11+), Java Flight Recorder (JFR) is an excellent, low-overhead built-in profiling tool. You can start a recording using the jcmd utility: jcmd <PID> JFR.start duration=60s filename=myrecording.jfr. Once the recording completes, you can open the file in JDK Mission Control (JMC). JMC provides a detailed "Thread CPU Load" and "Method Profiling" view, allowing you to easily identify hot methods without manually parsing thread dumps.
Once you have access to thread dumps, you must look through the data to calculate the CPU usage of each thread and identify the thread that's taking up the most resources. You can use tools like IBM's Thread and Monitor Dump Analyzer https://www.ibm.com/support/pages/ibm-thread-and-monitor-dump-analyzer-java-tmda or find values manually and calculate the CPU usage ratio.
A wide range of tools can help you identify and investigate high CPU usage issues in Java. Some of the top tools are listed below.
Java VisualVM https://docs.oracle.com/javase/8/docs/technotes/tools/unix/jvisualvm.html is a lightweight tool that can help you visualize your app's performance. Internally, it federates and consolidates information from independent tools like jstack, jmap, jinfo, and more to enable you to view all your app's performance-related data in one place.
With Java VisualVM, you can easily generate and analyze heap dumps, investigate memory leaks, monitor garbage collection runs, and perform basic profiling. You can also visualize process threads and their various run times using this tool to see if a thread is staying active for longer than it ideally should.
JVisualVM was distributed with the Oracle JDK in versions 6-8. It was discontinued in JDK 9, and now it can be installed as a standalone tool https://visualvm.github.io/download.html.
A key selling point of JVisualVM is that it allows you to extend its functionalities by developing plugins. You can develop descriptive visualizations over existing data, integrate other tools like the Visual Garbage Collection Monitoring Tool https://visualvm.github.io/plugins.html#:~:text=latest%20JMX%20features.-,Visual%20GC%20Plugin,-Integration%20of%20the, create shortcuts to simplify your workflow, and more.
While JVisualVM is a good tool for analyzing Java performance data, it's quite primitive in terms of its features. Some other tools on this list can help you do more with your Java performance data.
JProfiler https://www.ej-technologies.com/products/jprofiler/overview.html is one of the most popular Java profilers. It supports profiling system performance, memory usage and leaks, and thread activity. JProfiler also supports database profiling to help you identify issues in your database that may contribute to your app's overall low performance.
JProfiler prioritizes ease of use. Apart from its intuitive UI, it offers seamless support for Docker and Kubernetes-based JVMs. Remote profiling is simple through its built-in SSH tunnel functionality. JProfiler does all this while maintaining a small overhead on the host machine.
JProfiler offers powerful views for analyzing and understanding CPU profiling data. You get call tree view filters, aggregation levels, thread status selectors, and more. JProfiler integrates with most IDEs easily, making it a popular choice among developers.
Prometheus is an all-around monitoring solution that can be used to track and analyze the performance of most types of applications. You can use the JMX exporter https://docs.oracle.com/javase/tutorial/jmx/overview/index.html to expose performance data to collect in Prometheus.
Prometheus actively scrapes data exposed by the JMX exporter, stores it, and allows for queries, graphs, and alerts to be set up to help you use the collected data. You can easily connect Prometheus with a visualization tool like Grafana to create powerful visualizations and reports.
Prometheus is a good way to go for your Java apps if you're looking for an open source monitoring setup to analyze the resource utilization of your apps in production or have already used Prometheus with some other projects. The biggest downside to Prometheus is that it can become quite difficult to configure and maintain. If this is a strong concern, you may need to consider paid enterprise solutions.
Graphite is another open source monitoring tool that can be used across a wide range of tech stacks. However, unlike Prometheus, Graphite does not offer a complete suite of tools for you to get started quickly. You must pair it up with StatsD and collectd for collecting metrics, Carbon for aggregating, Whisper for storing, and Grafana for visualizing your data.
Hosted Graphite https://www.hostedgraphite.com/blog/hosted-graphite-isnt-graphite aims to solve the lack of a complete ecosystem around Graphite and has been popular since 2012. Many third-party vendors today offer managed Graphite setups for you to get started easily.
Compared to Prometheus, Graphite has a few persistent issues—data redundancy, collaboration, large volume processing, and flexible data aggregations are tough to configure in Graphite. Overall, Graphite works great for small-scale setups but can get quite complex to maintain when scaled.
Site24x7 is a modern observability platform that lets you monitor your website, server, app, network, and overall user experience all in the same place. It offers a solution for monitoring the performance of Java applications, which can be extremely useful for monitoring Java CPU usage levels.
Site24x7's Java application monitoring tool lets you quickly identify slow method invocations, analyze database performance side by side, and keep an eye on critical JVM metrics like CPU and memory usage, GC count, thread summary, and more. You can also instrument specific components in your app to gain deeper insights into its metrics. The Java application monitoring tool also supports tracking background transactions run for maintenance or scheduling purposes but can still contribute to increased CPU usage.
The Java application monitoring tool can also track a request as it moves through multiple microservices of your application using distributed tracing. With all these features packed into one simple tool, you should consider monitoring your Java applications with Site24x7's Java application monitoring tool.
This section uses an example Java program to demonstrate how you would use one of the above tools, JVisualVM, to identify the code causing high CPU usage.
This Java program will show high CPU usage:
public class Main {

    // Main function creates a new thread for the heavy operation to be run on and proceeds with a simple print operation in a loop
    public static void main(String[] args) throws InterruptedException {

        Thread thread = new Thread(() -> {
            for (int i=0; ;i++)
                heavyTask(i);
        });

        thread.setName("Heavy Task Thread");

        thread.start();

        for (int i=0; ;i++) {
            System.out.println("The numbers next to " + i + " are " + (i-1) +  " & " + (i+1));
            Thread.sleep(1);
       }
    }

    // A simple CPU-heavy function that calculates factorials of three numbers in succession
              public static void heavyTask(int i) {
        System.out.println("The factorial of " + i + " is " + fact(i));
        System.out.println("The factorial of " + (i + 1) + " is " + fact(i + 1));
        System.out.println("The factorial of " + (i + 2) + " is " + fact(i + 2));
    }

    // The function that calculates the factorial of a given number
    public static BigInteger fact(int num) {
        BigInteger factorial = BigInteger.ONE;
        for(int i = 1; i <= num; ++i)
        {
            // factorial = factorial * i;
            factorial = factorial.multiply(BigInteger.valueOf(i));
        }
       return factorial;
    }
}
This program has two threads, the main thread and a thread named "Heavy Task Thread". If you run this program and analyze the process's overall resource consumption for a short time (say a minute) using a tool like JVisualVM, here's what you'll find:
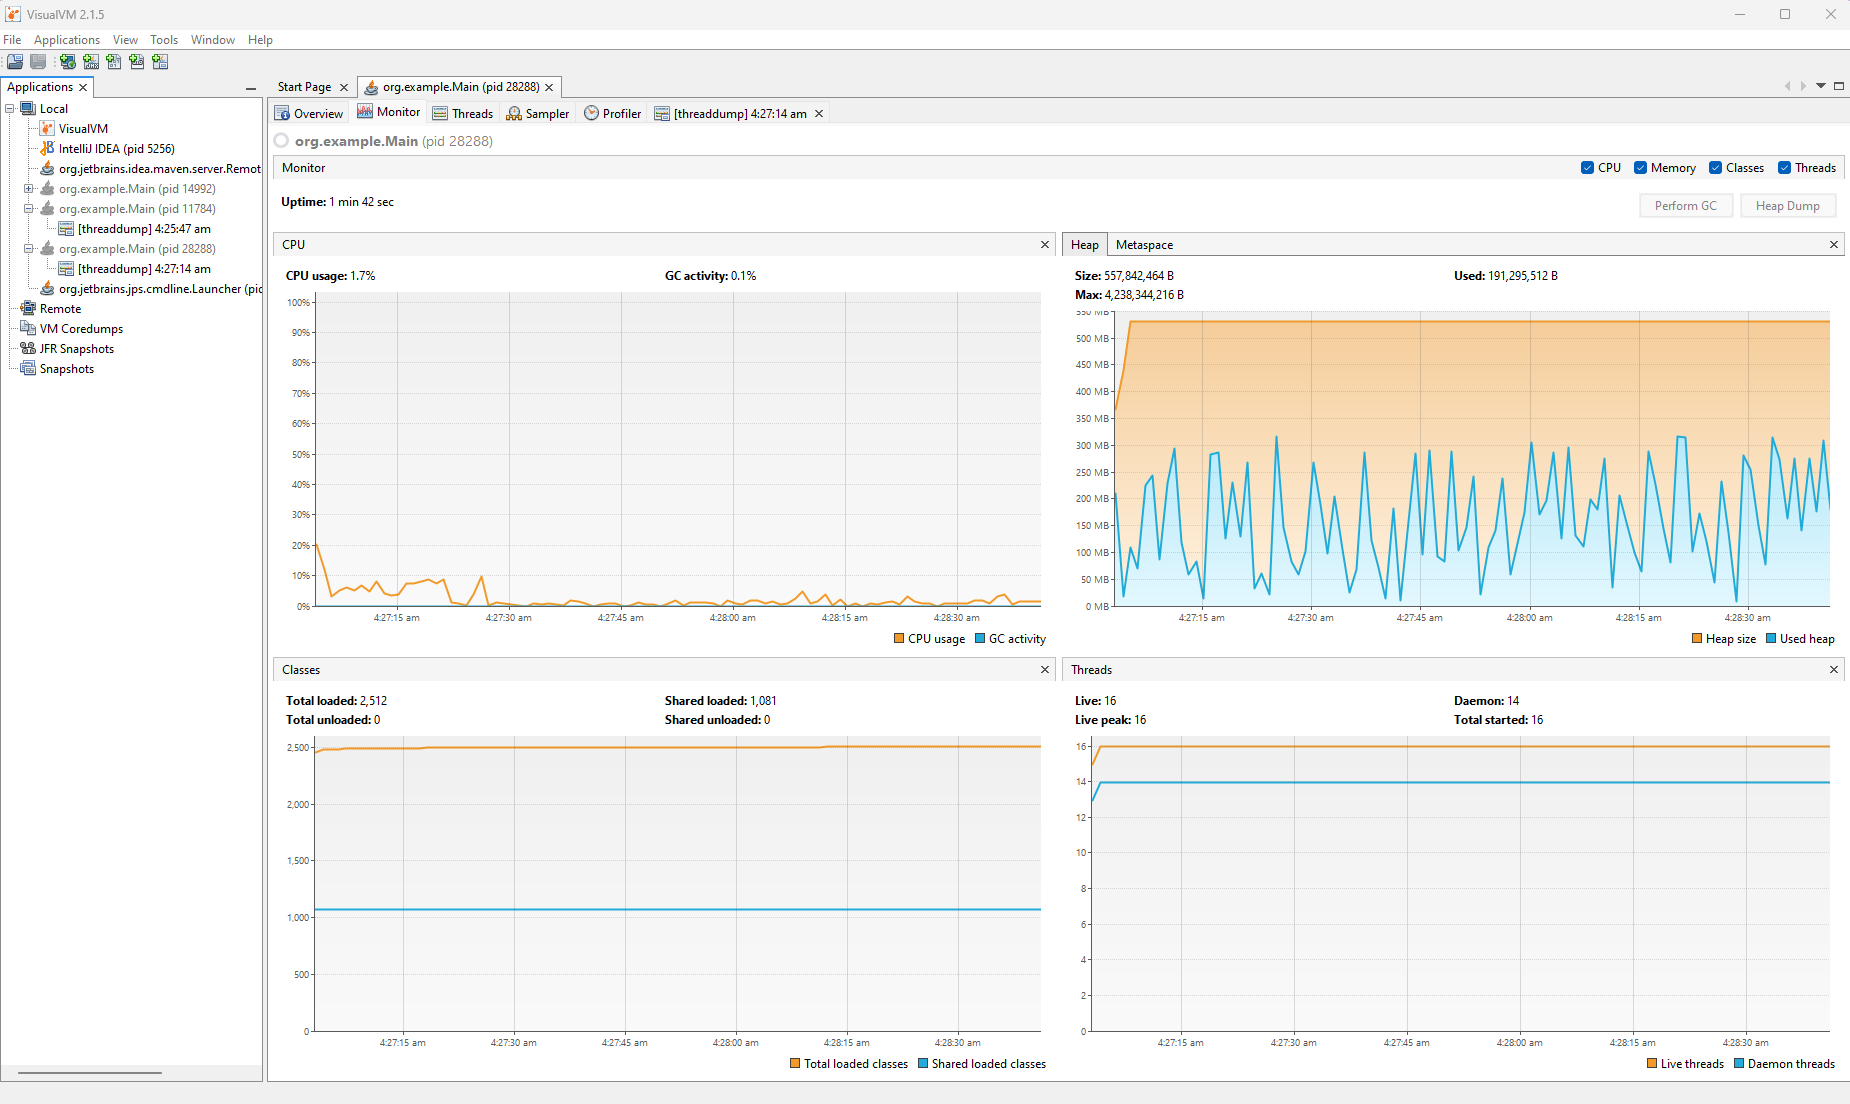 Fig. 1: Resource Consumption Overview
You'll notice somewhat regular spikes in the CPU consumption graph, which indicate that there's something wrong with your program's CPU utilization causing the consumption to fluctuate.
To inspect it more closely, you can analyze its thread dump:
2023-03-06 04:27:14
Full thread dump Java HotSpot(TM) 64-Bit Server VM (17.0.6+9-LTS-190 mixed mode, sharing):

Threads class SMR info:
_java_thread_list=0x000001c4444b72e0, length=21, elements=
0x000001c41aefbe80, 0x000001c43db7c670, 0x000001c43db7d430, 0x000001c43db8c0e0,
0x000001c43db8c9a0, 0x000001c43db8e360, 0x000001c43db8ef20, 0x000001c43db904d0,
0x000001c43db9c890, 0x000001c43dba10c0, 0x000001c43dc9b080, 0x000001c43dd1ba50,
0x000001c43dd23b10, 0x000001c43ddd0400, 0x000001c44157f780, 0x000001c443278670,
0x000001c43f448e30, 0x000001c4402aaac0, 0x000001c4401f70b0, 0x000001c444ae87f0,
0x000001c441af2130

"main" #1 prio=5 os_prio=0 cpu=78.12ms elapsed=15.51s tid=0x000001c41aefbe80
nid=0x6cb4 sleeping [0x000000a4211ff000]
   java.lang.Thread.State: TIMED_WAITING (sleeping)
        at java.lang.Thread.sleep(java.base@17.0.6/Native Method)
        at org.example.Main.main(Main.java:27)

   Locked ownable synchronizers:
        - None
Heavy Task Thread" #16 prio=5 os_prio=0 cpu=6281.25ms elapsed=15.42s tid=0x000001c43ddd0400 nid=0x6c60 runnable  [0x000000a4225fe000]
   java.lang.Thread.State: RUNNABLE
        at java.math.BigInteger.multiplyByInt(java.base@17.0.6/BigInteger.java:1696)
        at java.math.BigInteger.multiply(java.base@17.0.6/BigInteger.java:1612)
        at java.math.BigInteger.multiply(java.base@17.0.6/BigInteger.java:1586)
        at org.example.Main.fact(Main.java:36)
        at org.example.Main.heavyTask(Main.java:44)
        at org.example.Main.lambda$main$0(Main.java:18)
        at org.example.Main$$Lambda$14/0x0000000800c01200.run(Unknown Source)
        at java.lang.Thread.run(java.base@17.0.6/Thread.java:833)

   Locked ownable synchronizers:
        - None
You'll usually find multiple threads in a thread dump. However, the example above only shows the two relevant threads for the example program. You'll notice that while the "main" thread took up 78.12 ms of CPU time, the "Heavy Task Thread" thread took up 6,281.25 ms of CPU time during the same time. This means that the "Heavy Task Thread" seems to be hogging up CPU times compared to other threads in this program.
Next, you can use JVisualVM's sampler to sample the CPU and memory consumption for a short time (say 10-12 seconds):
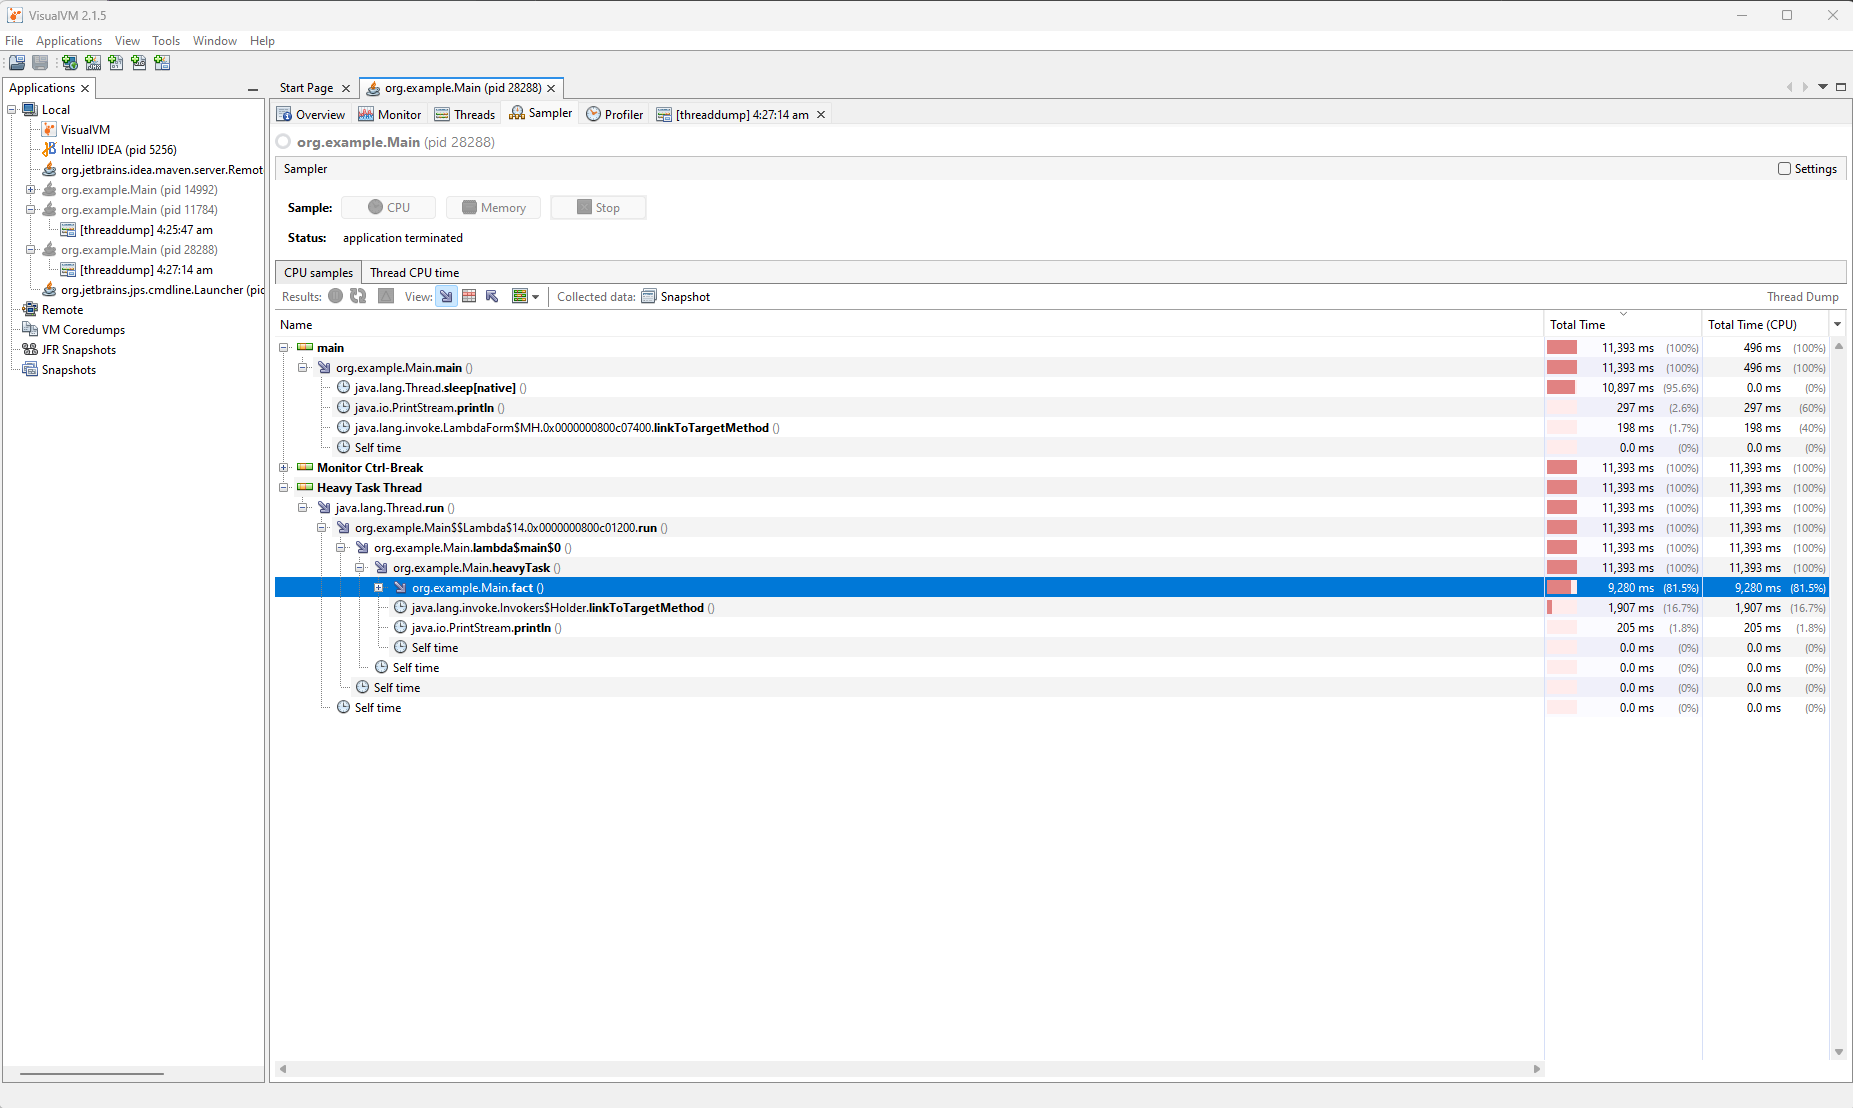 Fig. 2: Resource sample from JVisualVM
In the CPU samples tab, you'll find the active threads listed along with their CPU times. You'll find a function-wise breakdown of the CPU consumption. You can use this breakdown to identify that the fact() function has been taking up the most CPU time in the "Heavy Task Thread" thread, which makes sense as it contains the code for CPU-intensive factorial calculations. This way, you can use a profiling tool to identify and drill deep into a high CPU consumption situation and ultimately find the root cause.
Java is a popular platform for deploying enterprise applications, yet it can easily fall prey to bad resource management, and you can end up with high CPU usage. Multiple factors can contribute to this. Hence, you must ensure that you're following all best practices when designing your application and keeping an eye on it once it is deployed to catch any high CPU usage issues before they mess with your uptime.
In this article, you saw some of the best practices you can follow to keep your Java CPU usage low, how to keep an eye on the metric, and what to do to identify its root cause. You were introduced to some of the best tools to help you keep an eye on your Java CPU usage. Finally, you saw an example of how to identify code causing high CPU usage.
Site24x7 APM Insight for Java includes a thread profiler that can be triggered on demand. It captures stack traces of running threads to identify exactly which methods or lines of code are consuming high CPU. Site24x7 also supports dynamic thresholds (AI-based anomaly detection) to automatically detect irregular CPU usage patterns.
Yes, Site24x7 monitors JVM heap memory and Garbage Collection (GC) activity. Frequent full GC cycles often cause high CPU usage, and Site24x7 helps you correlate these events. You can also set up custom thresholds for JVM metrics to proactively identify potential issues.
The APM agent detects and reports stuck threads that have been running longer than a specified threshold, often a cause of application unresponsiveness and resource exhaustion. Site24x7 also supports dynamic thresholds to automatically identify stuck threads based on AI-driven anomaly detection.