Key features of Kubernetes observability in Site24x7
Out-of-the-box telemetry collection
Automatically collect, visualize, and correlate key Kubernetes metrics, logs, traces, and events without the complex setup.
Service and dependency mapping
View real-time service-to-service interactions and track dependencies with distributed tracing.
Unified observability dashboard
View metrics, logs, and traces on a single pane of glass with AI-powered insights.
Granular visibility at each component level
Monitor resource usage, error rates, and performance at the most granular level and get the best practice recommendations to ensure a highly available Kubernetes ecosystem.
Kubernetes change tracker
Track the YAML changes to ensure real-time visibility into configuration modifications, helping you maintain cluster integrity, troubleshoot issues, and meet compliance requirements.
Event correlation and alerting
Connect Kubernetes events to performance metrics and receive contextual alerts before users are affected.
Root cause analysis (RCA)
Connect Kubernetes events to performance metrics and receive contextual alerts before users are affected.
Custom dashboards and alerts
Build personalized views and set threshold-based or anomaly-based alerts with ease.
Multi-cluster and hybrid support
Observe workloads running across cloud, on-premises, and hybrid Kubernetes clusters.
What makes observability different from monitoring?
| Aspect | Monitoring | Observability |
|---|---|---|
| Scope | Tracks known issues with predefined metrics | Helps uncover unknown-unknowns |
| Data | Primarily metrics | Combines metrics, logs, traces, and events |
| Outcome | React to alerts | Proactively investigate and debug |
| Depth | Surface-level indicators | Deep contextual understanding |
| Use case | Uptime and threshold breaches | Complex troubleshooting and optimization |
Observability is not just an extension of monitoring—it’s an evolution. While monitoring asks "Is my system up?", observability asks "Why is it behaving this way?"
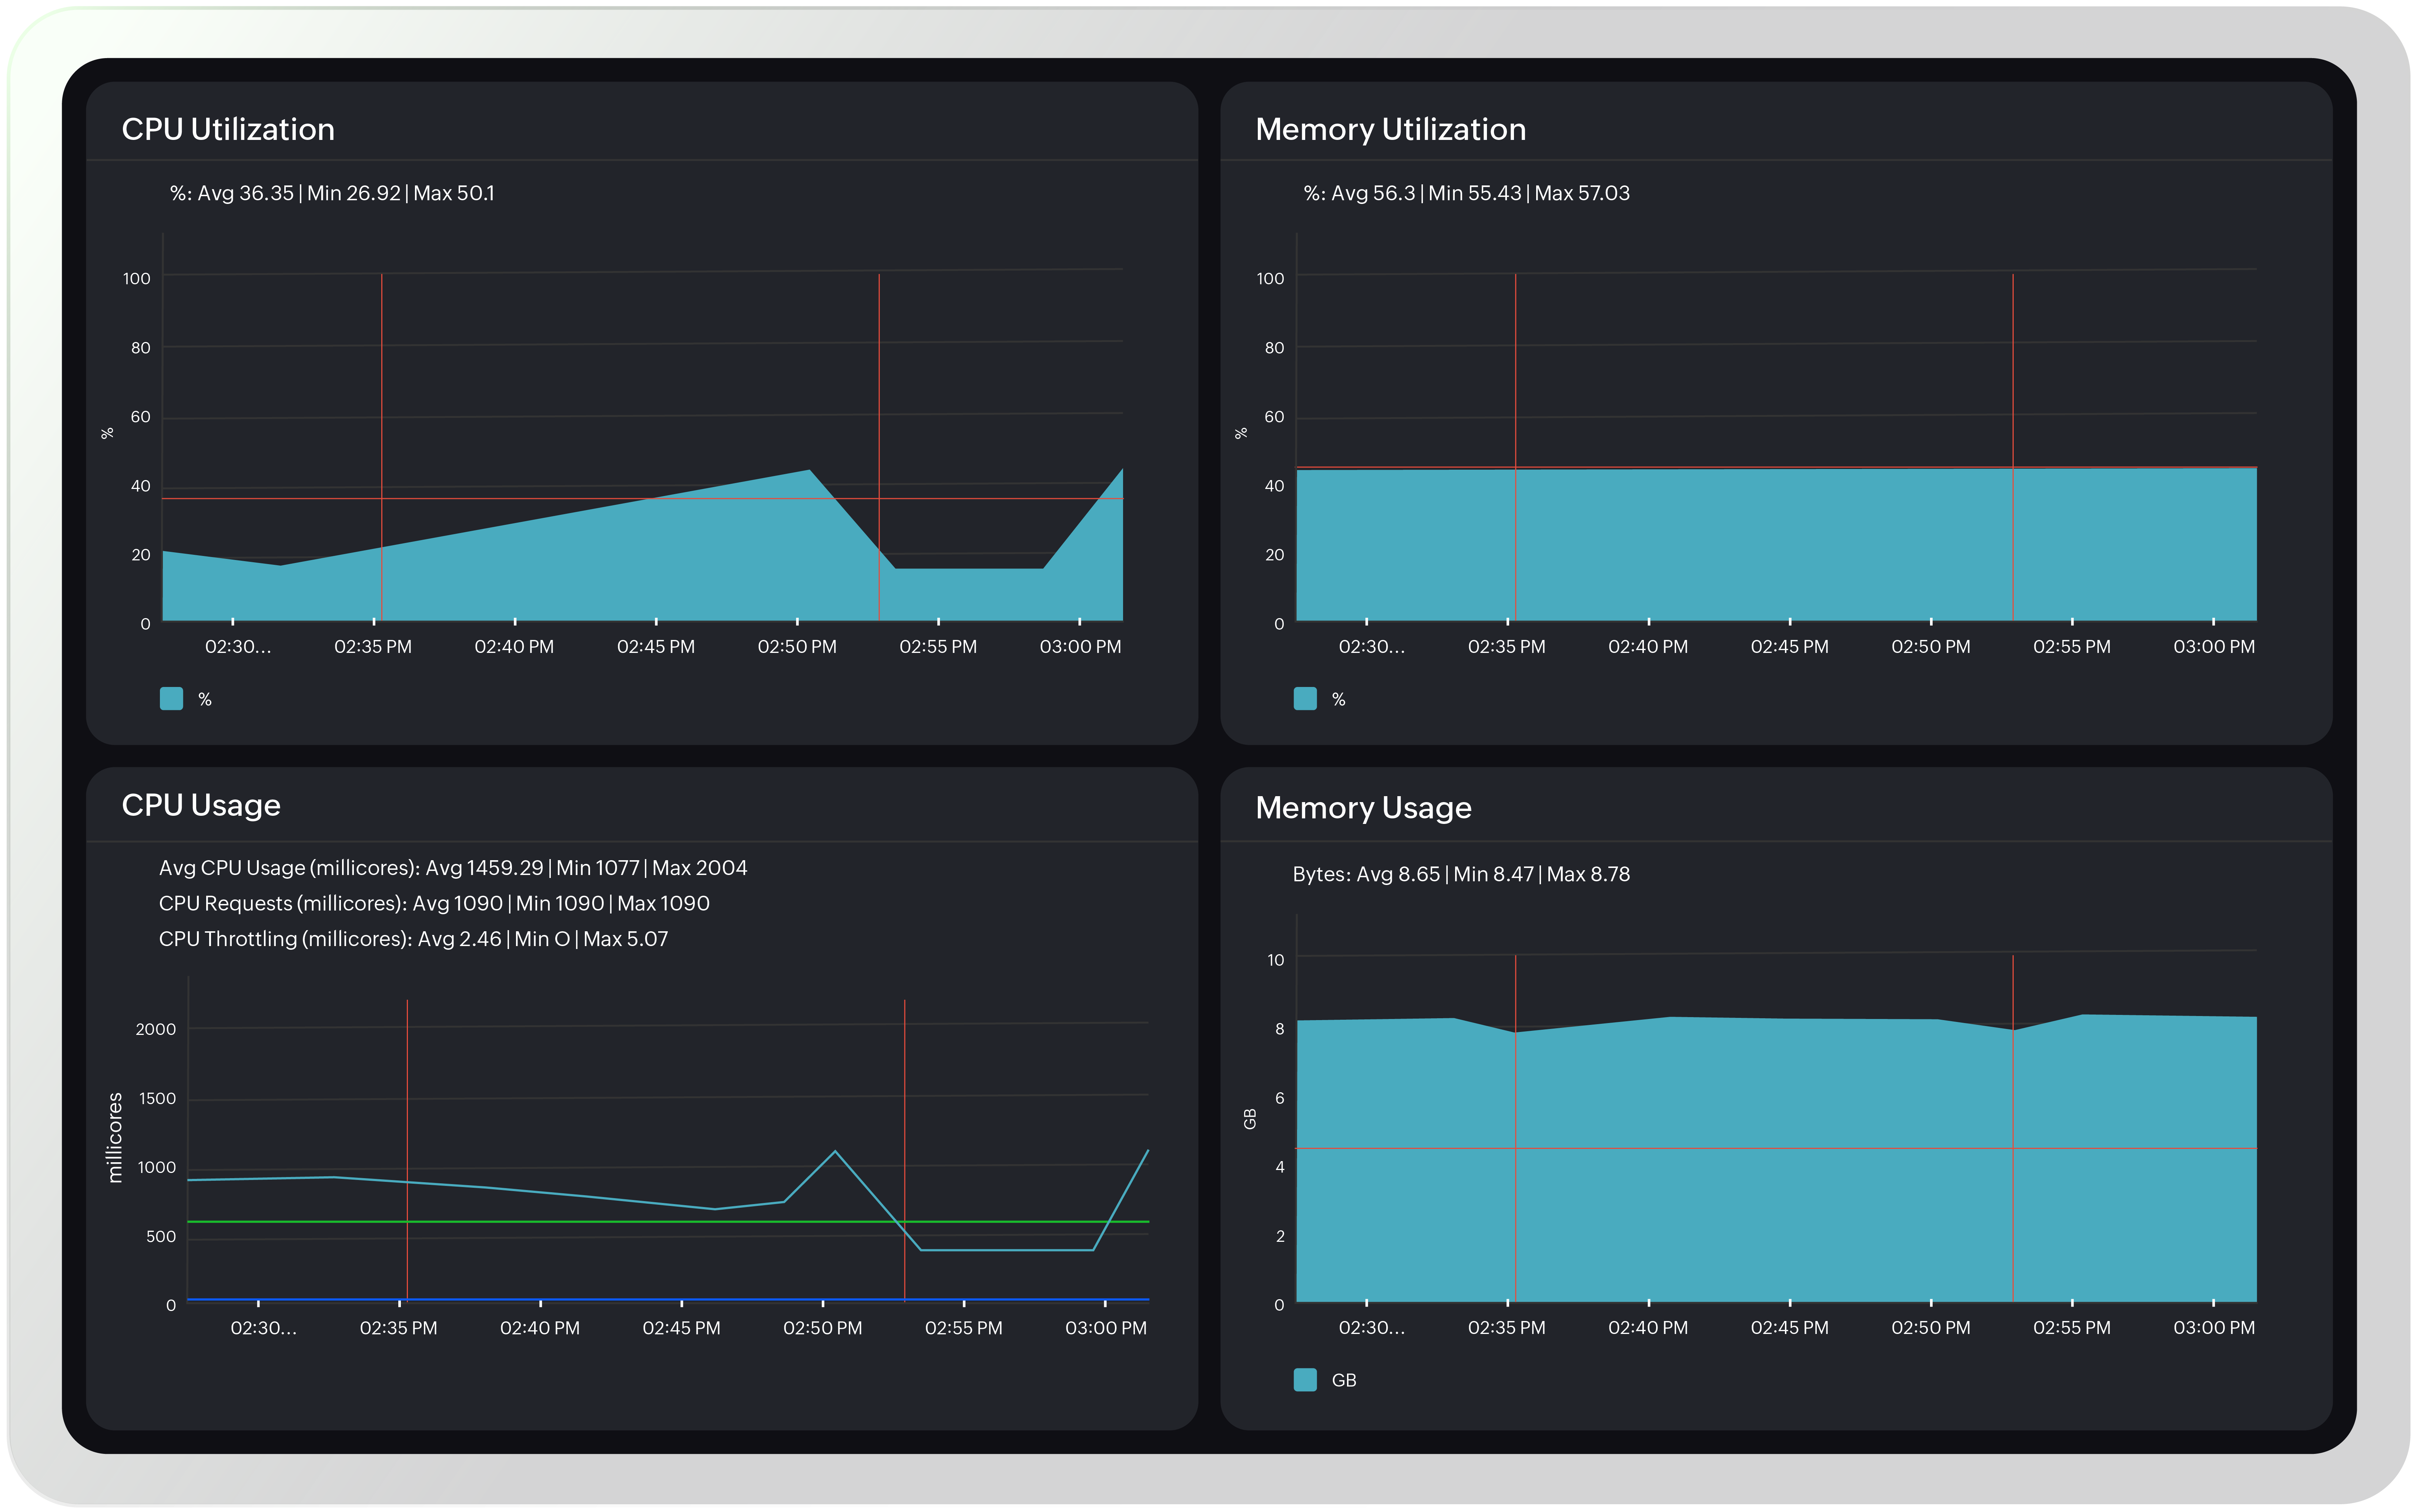
Metrics
Gain visibility into cluster-wide and granular metrics:
- CPU and memory usage across pods, nodes, and containers
- Workload-level metrics including Deployments, ReplicaSets, StatefulSet, DaemonSets, and Jobs
- Network throughput and disk I/O
- Custom application-level metrics via Prometheus exporters
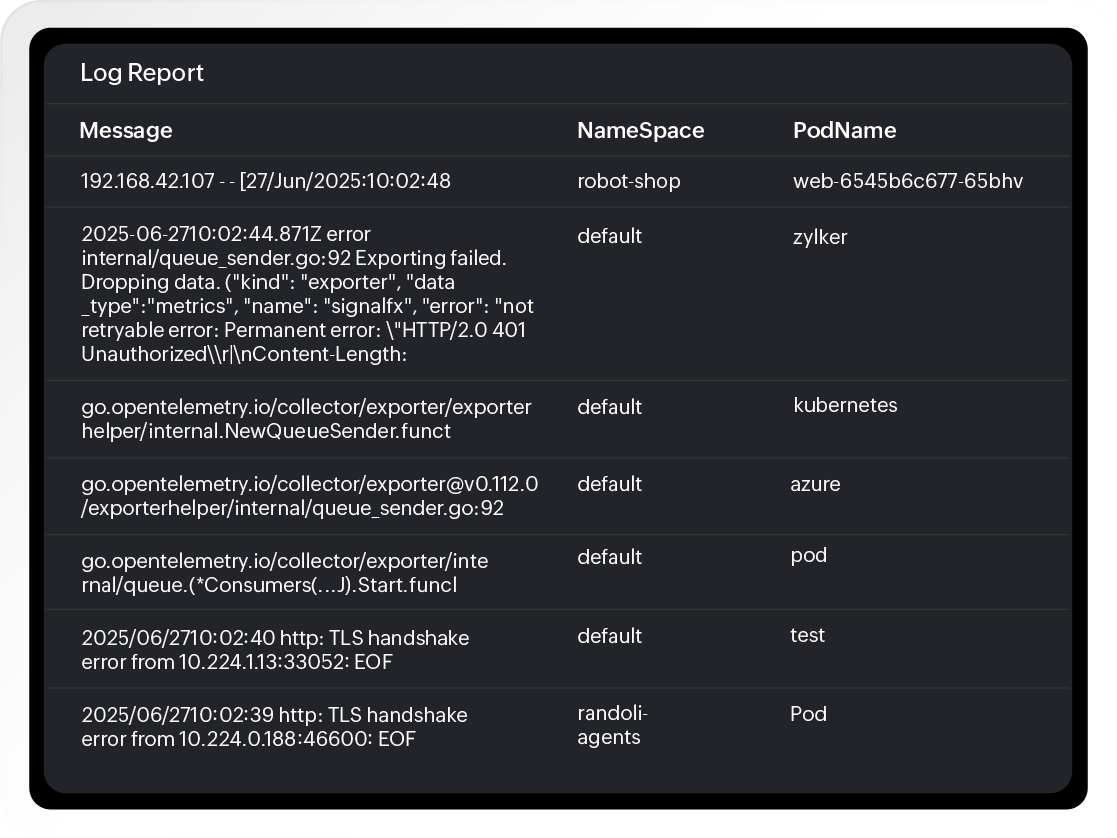
Logs
Correlate logs with performance issues and user experience:
- Collect logs from containers and system components
- Use advanced search and filtering
- Identify failure patterns and debug faster
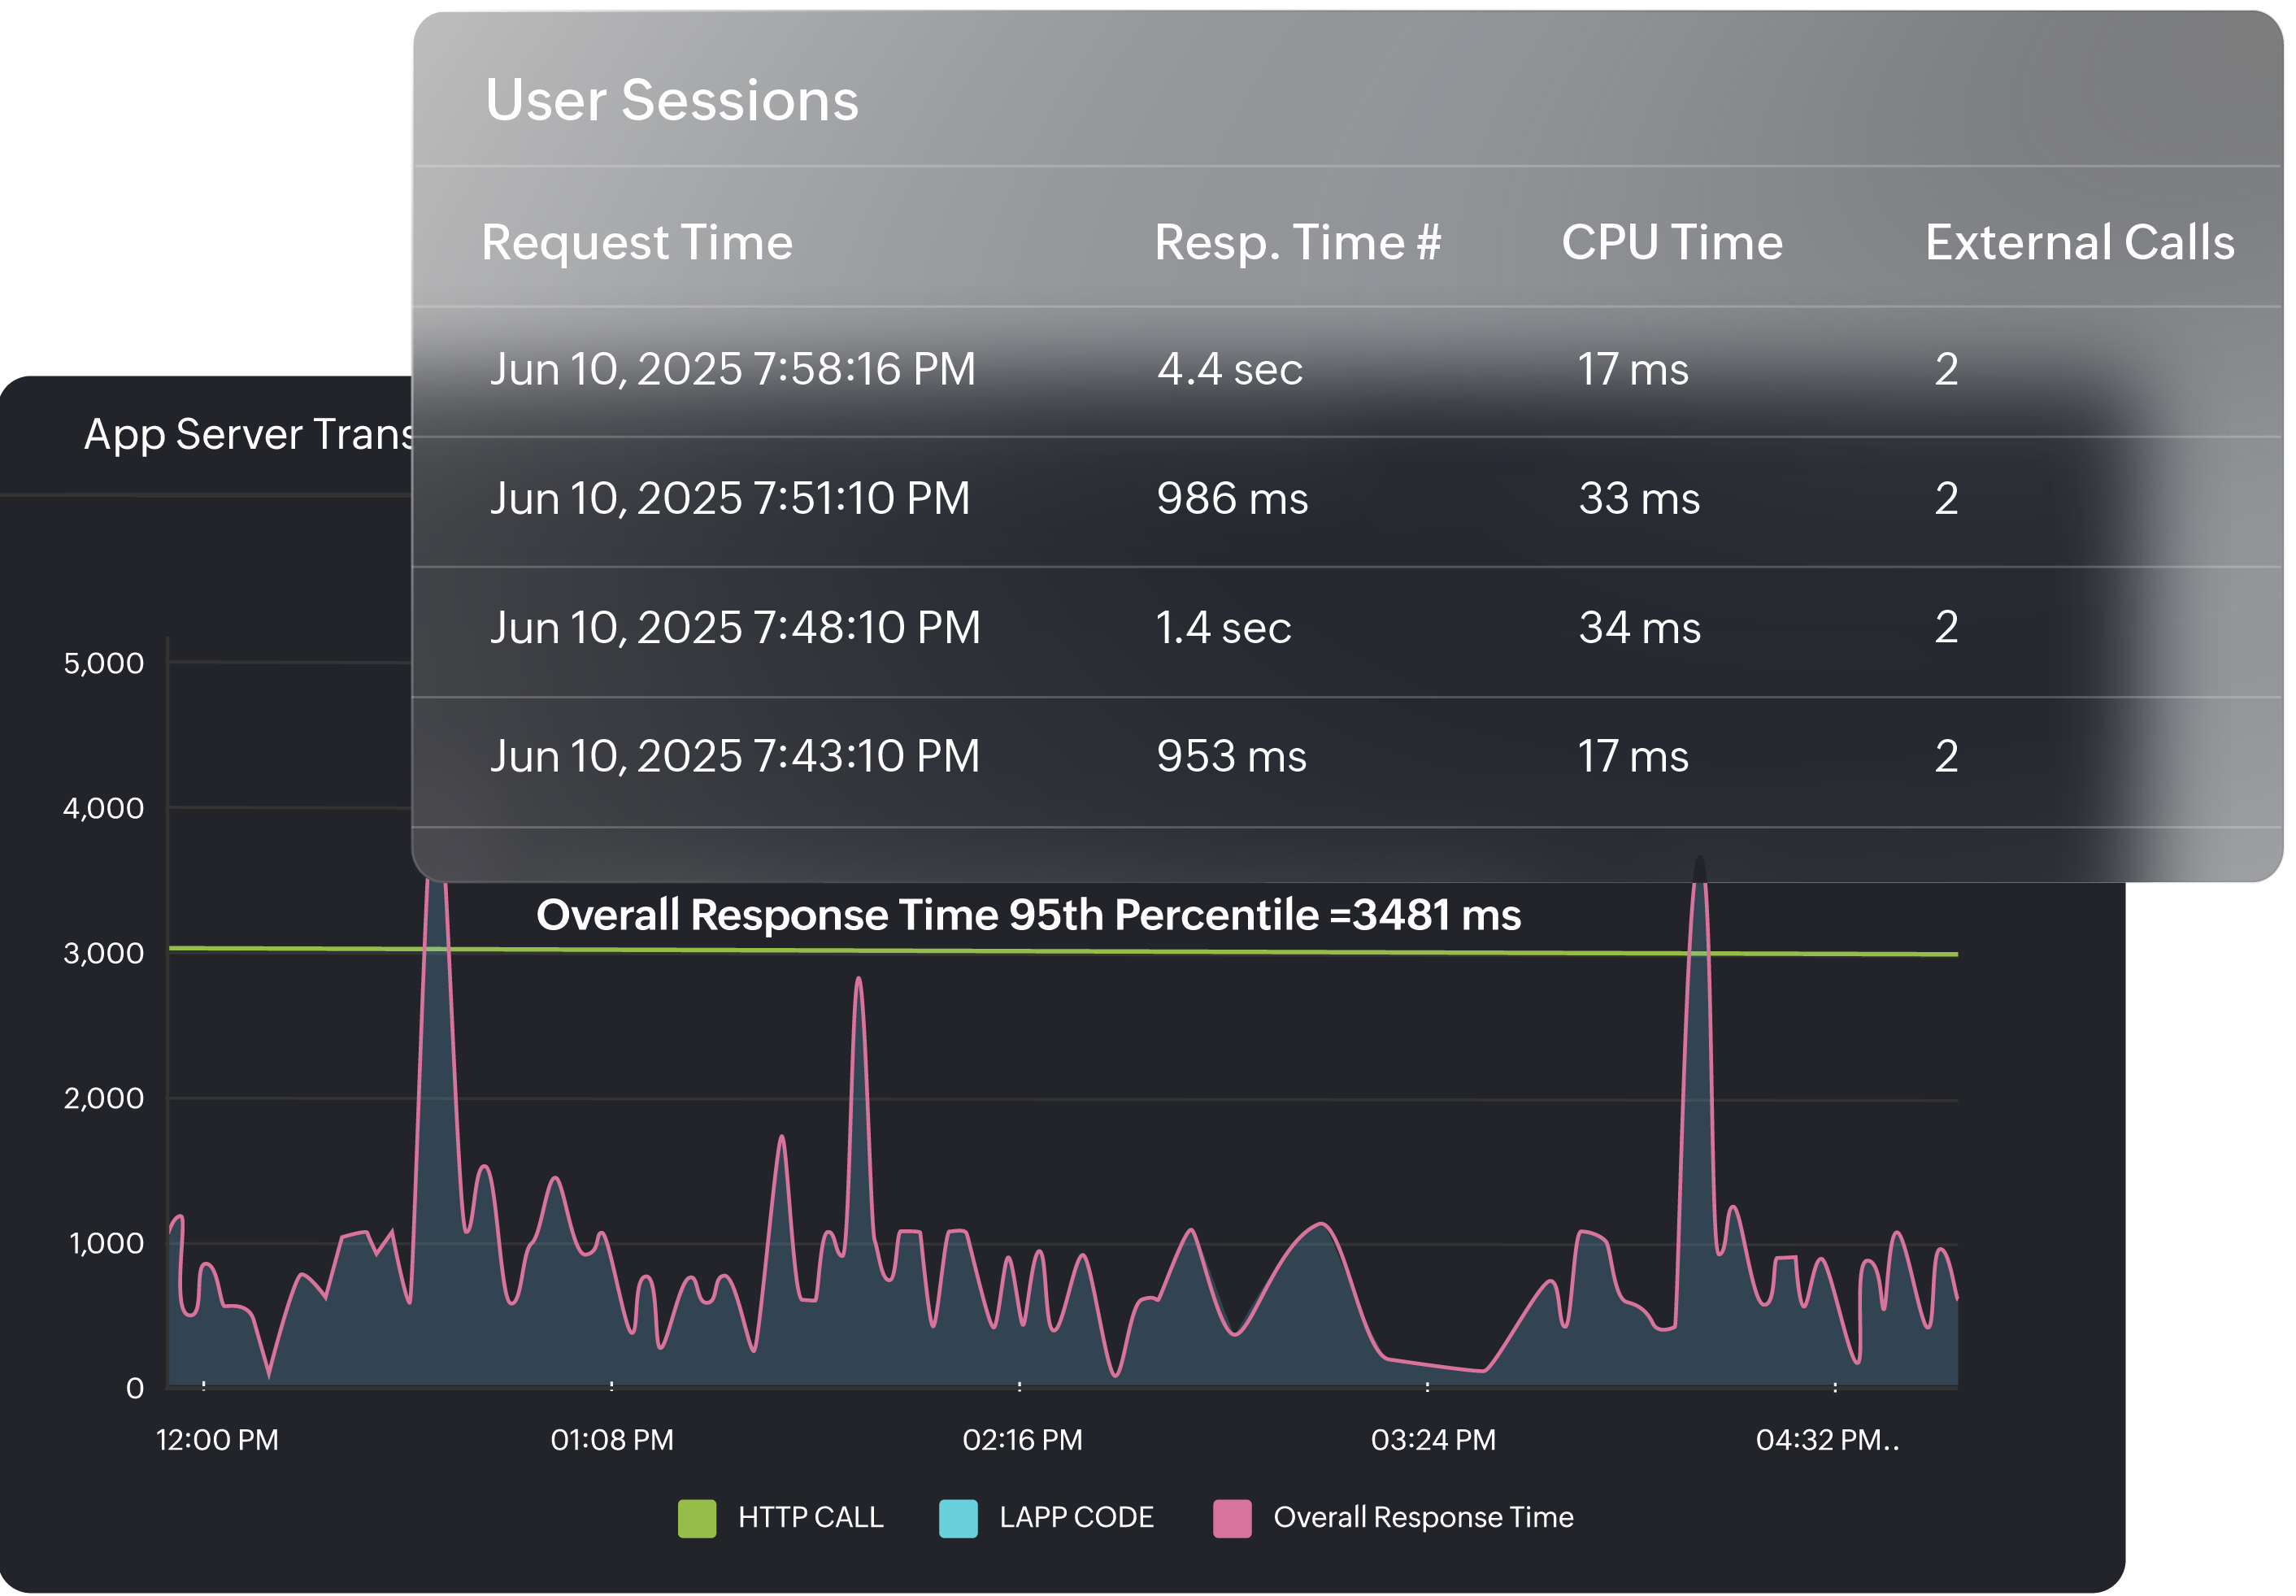
Traces
Trace requests across microservices:
- Get distributed tracing using OpenTelemetry.
- Identify bottlenecks in API calls and transactions.
- Visualize request flows with service maps.
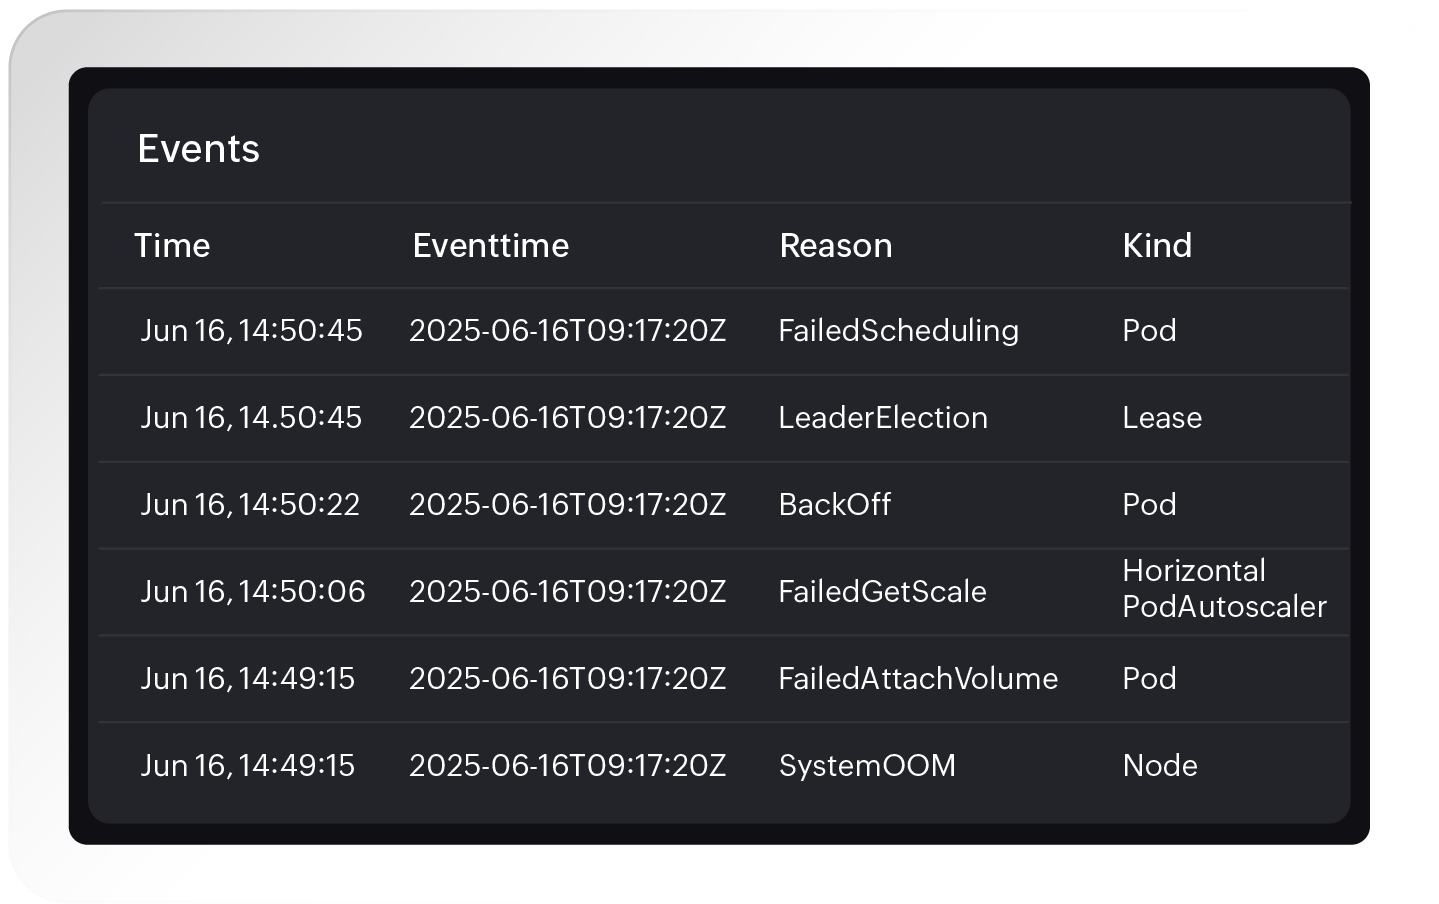
Events
Understand the what and why of cluster changes:
- Monitor Kubernetes control plane and object events.
- Connect state changes with performance anomalies.
- Trigger alerts on critical events (e.g., pod evictions, crashes).
Get started with Kubernetes observability
Whether you're running production workloads or managing complex microservices architectures, Kubernetes observability is essential to ensure stability, scalability, and success. With Site24x7, you get the tools and intelligence you need to turn raw telemetry into actionable insights—without the operational overhead.
Start 30-day free trial Try now, sign up in 30 secondsFAQs
What Kubernetes components does Site24x7 monitor?
Site24x7 provides comprehensive Kubernetes monitoring covering clusters, nodes, pods, deployments, services, and more. Control plane monitoring includes the API server, controller manager, etcd, CoreDNS, and kube-proxy. Site24x7 tracks performance metrics for CPU, memory, network, and storage at every layer. The Kubernetes Change Tracker detects configuration changes, the Dependency Tree view visualizes relationships between resources, and Configuration Rules help enforce best practices. Forecasting capabilities predict resource utilization trends, while capacity planning helps optimize cluster resources. Kubernetes logs are collected and analyzed alongside metrics for deeper troubleshooting.
How does Site24x7 provide observability beyond basic Kubernetes monitoring?
Site24x7 goes beyond basic monitoring by integrating Kubernetes data into its full-stack observability platform. Smart Groups automatically organize Kubernetes pods, services, and nodes so teams can view health, dependencies, and issues within a cluster in one place. Event correlation through Problems groups related alerts from across your Kubernetes infrastructure and identifies root causes, reducing alert noise. Application Discovery and Dependency Mapping (ADDM) leverages dynamic Kubernetes relationships to visualize how applications interact across your cluster. Zia-based Forecast predicts when resource utilization will breach thresholds, and guidance reports provide actionable optimization recommendations.
How does Site24x7 handle alerting for Kubernetes environments?
Site24x7 provides dedicated alerting for Kubernetes environments with customizable threshold profiles for cluster, node, pod, and container metrics. Alerts can be sent via email, SMS, phone call, push notifications, or through third-party integrations like Slack, Microsoft Teams, PagerDuty, and ServiceDesk Plus. The Kubernetes Change Tracker sends alerts when configuration changes are detected, helping identify issues caused by deployments or configuration drift. Event correlation automatically groups related Kubernetes alerts into Problems, so a single pod failure that causes cascading issues is presented as one consolidated problem with probable root causes identified, rather than dozens of individual alerts.