Log In

Comprehensive JVM monitoring for high-performing Java applications

Stay ahead of performance issues with real-time Java virtual machine (JVM) monitoring from Site24x7. Track heap memory, garbage collection (GC), thread activity, class loading, and more—right from your Java application’s runtime.

Start 30-day free trial Try now, sign up in 30 seconds

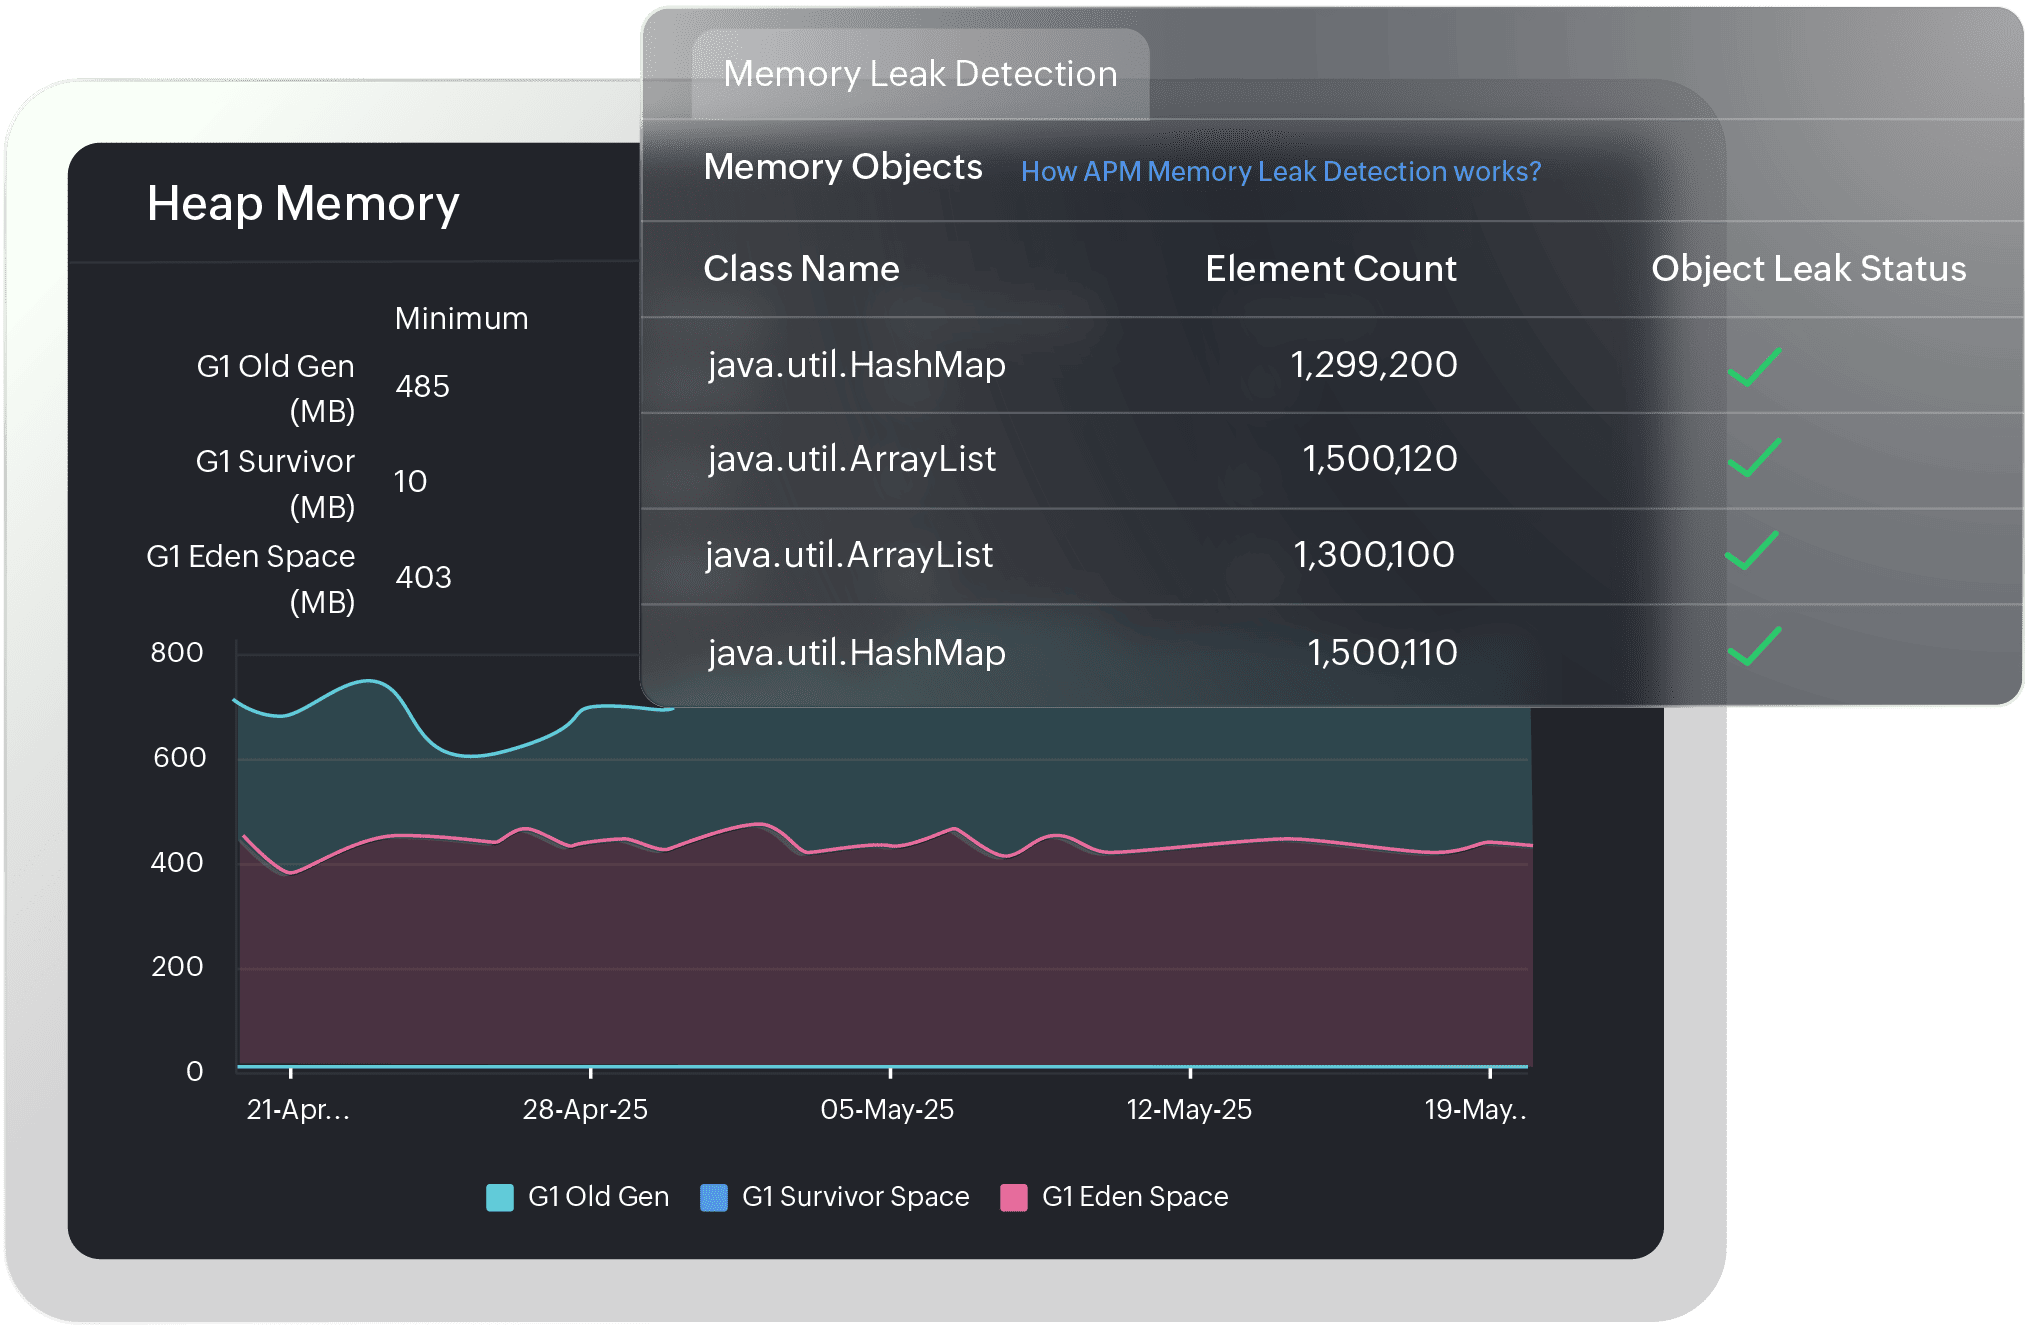
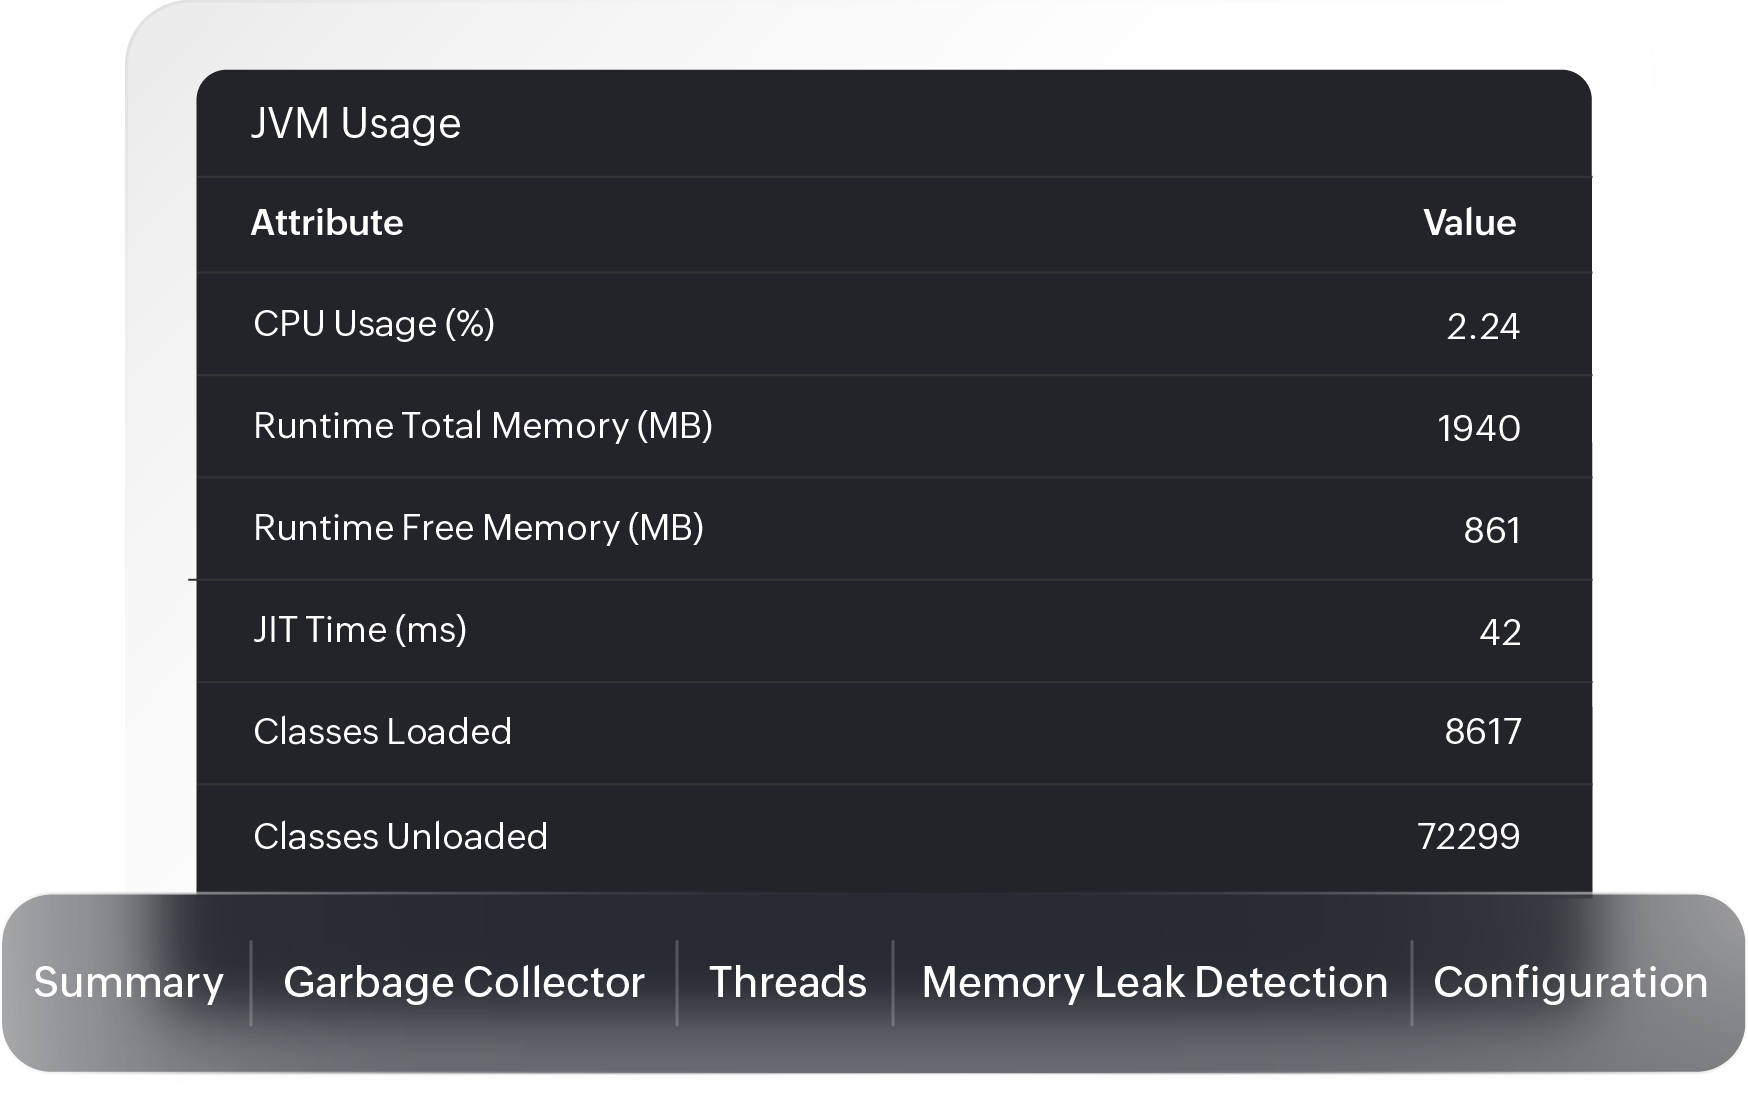
Get complete visibility into JVM memory usage

Identify memory leaks before they impact performance

  • Monitor Heap, Non-Heap, Metaspace, Eden Space, Survivor Space, and Old Gen memory usage.
  • Detect memory exhaustion and OutOfMemoryError risks early.
  • Visualize memory usage trends over time to fine-tune your GC strategy.
  • Set thresholds and receive alerts on memory spikes.
  • Track object allocation patterns and abnormal growth in memory pools.
Monitor and visualize memory usage trends to fine tune your GC strategy.

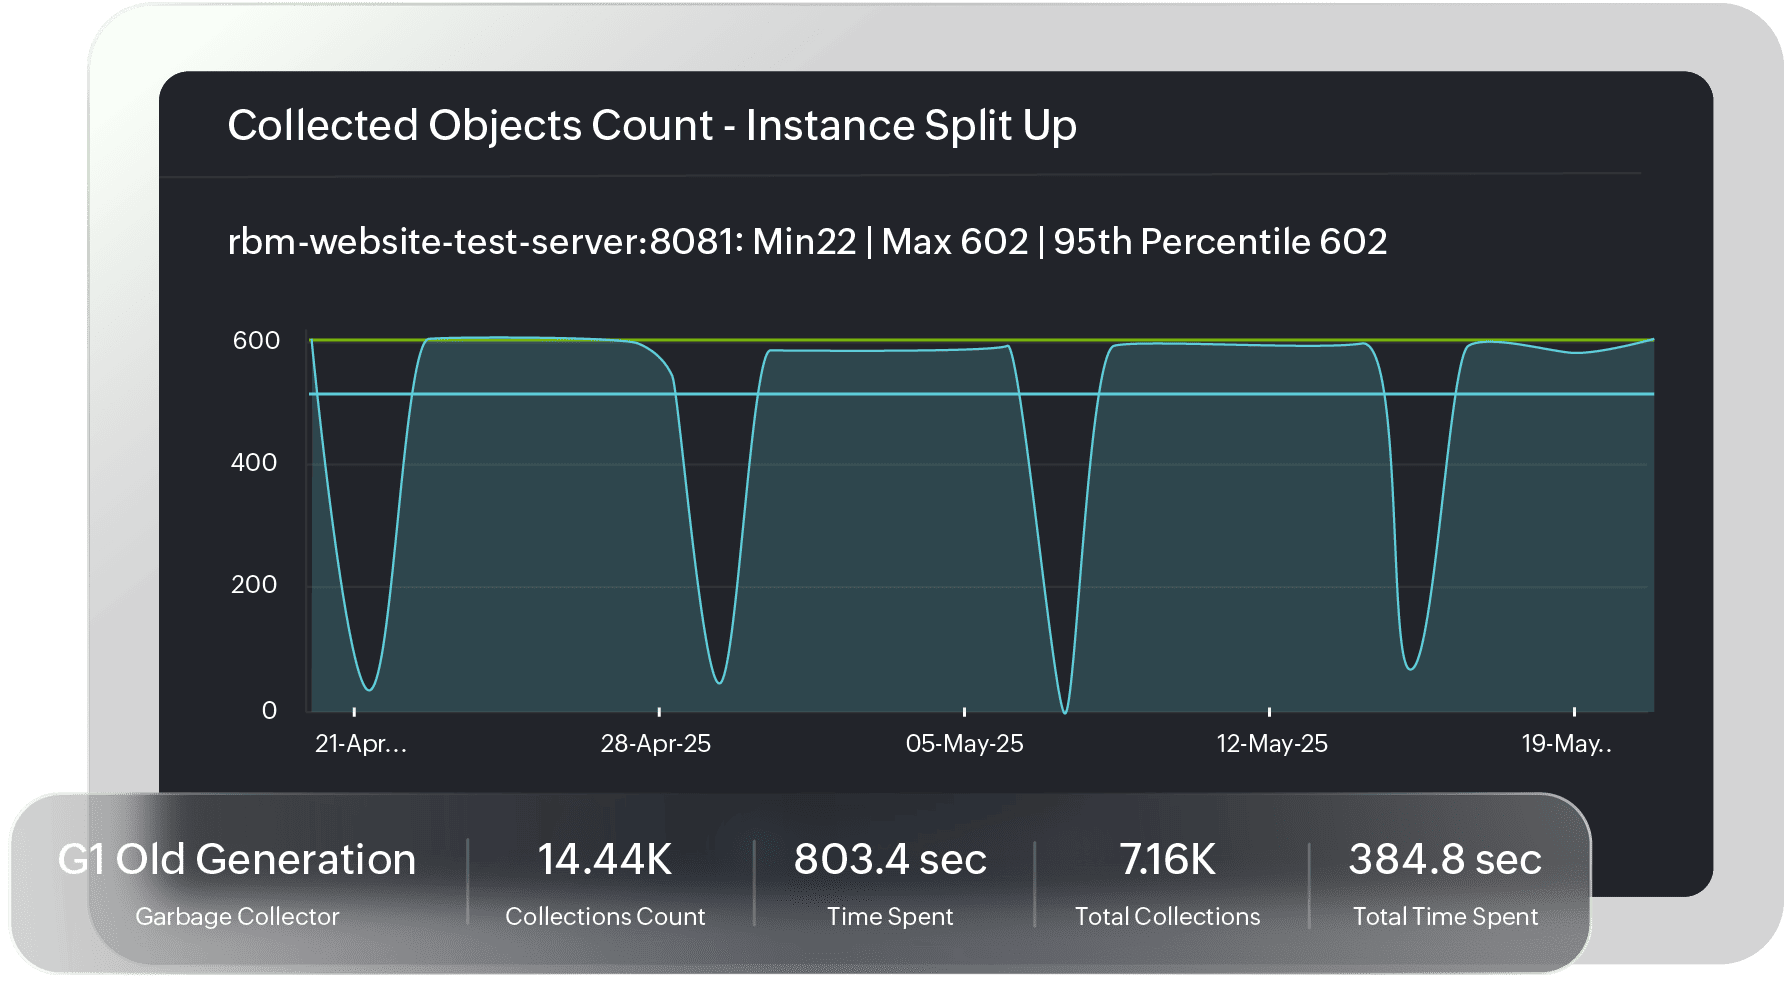
Track in GC performance real time

Reduce application pauses with GC insights

  • Monitor major and minor GC events by duration and frequency.
  • Identify long GC pauses that slow down your Java applications.
  • Optimize JVM parameters for Garbage-First (G1), Concurrent Mark Sweep (CMS), or Z Garbage Collector (ZGC) collectors.
  • Analyze GC behavior under different workloads.
  • Track GC cause and memory reclaimed post-GC to optimize collection frequency.
Analyze and visualize GC behavior under different workloads.

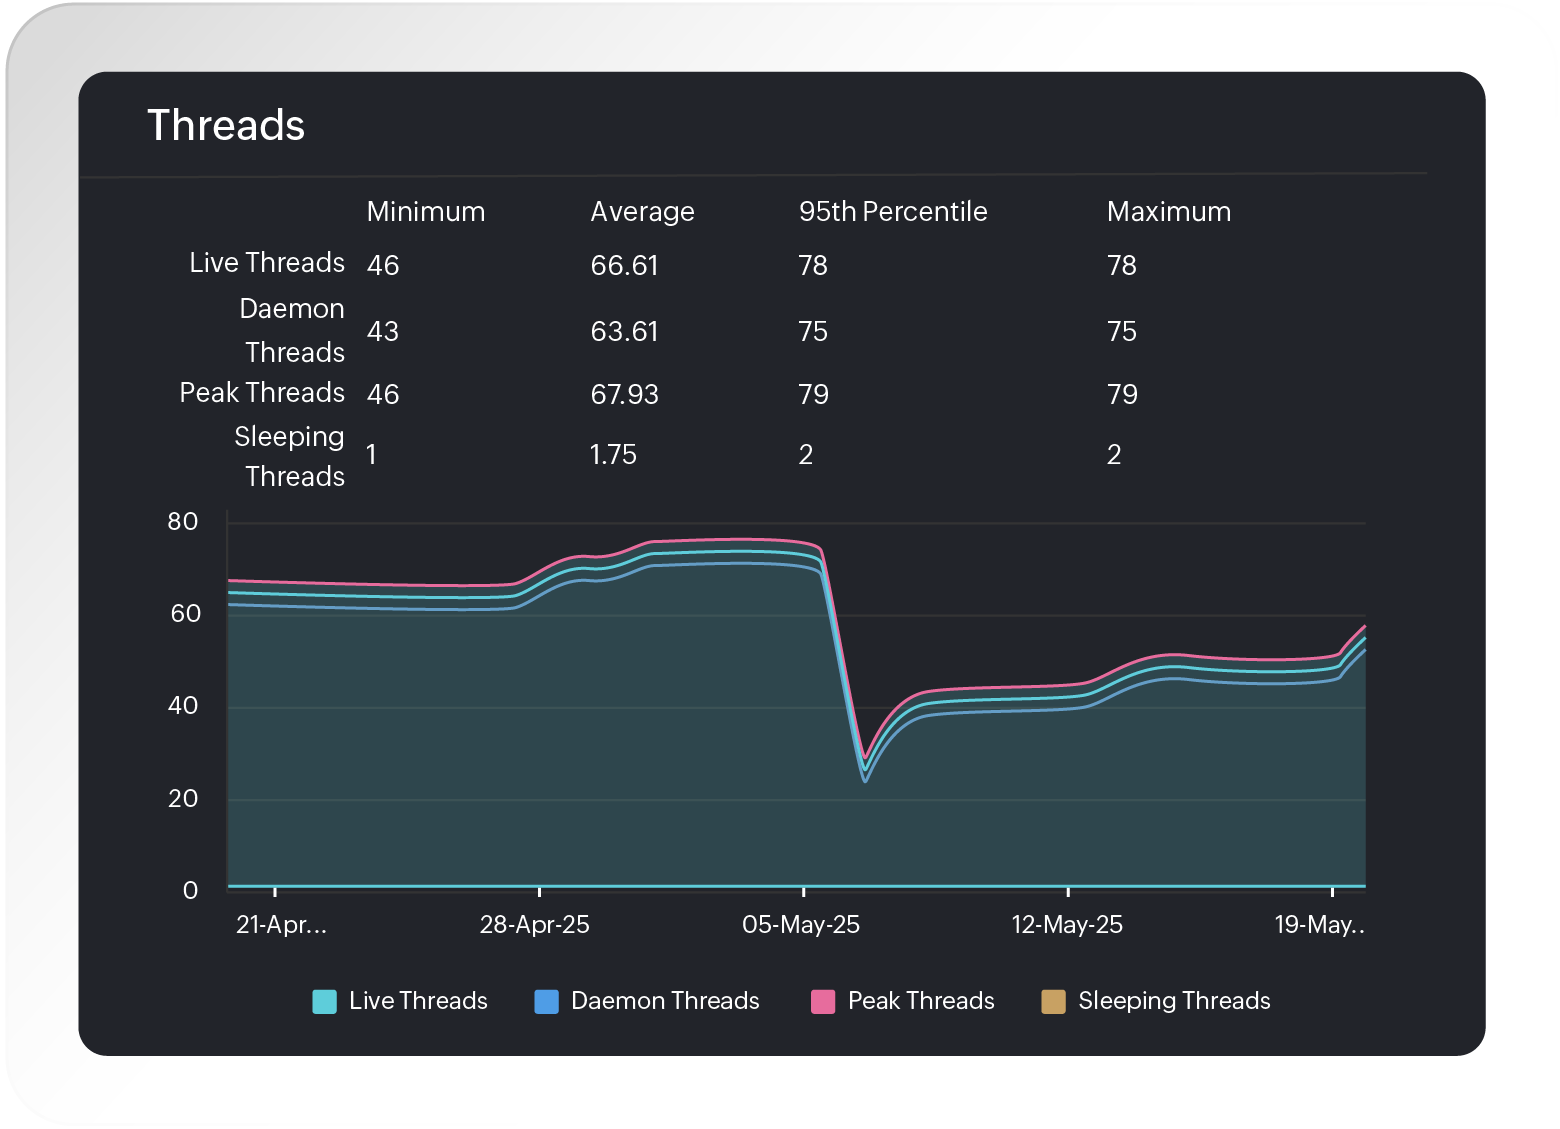
Monitor thread activity and detect deadlocks

Improve concurrency and fix thread-related bottlenecks

  • Track live, daemon, and peak threads in your JVM instance.
  • Detect blocked, waiting, or deadlocked threads instantly.
  • Understand thread pool saturation and queue backlogs.
  • Correlate thread activity with transaction performance.
  • Visualize thread states over time to catch transient deadlocks or spikes in thread creation.
Track and analyze JVM thread activity and concurrency states.

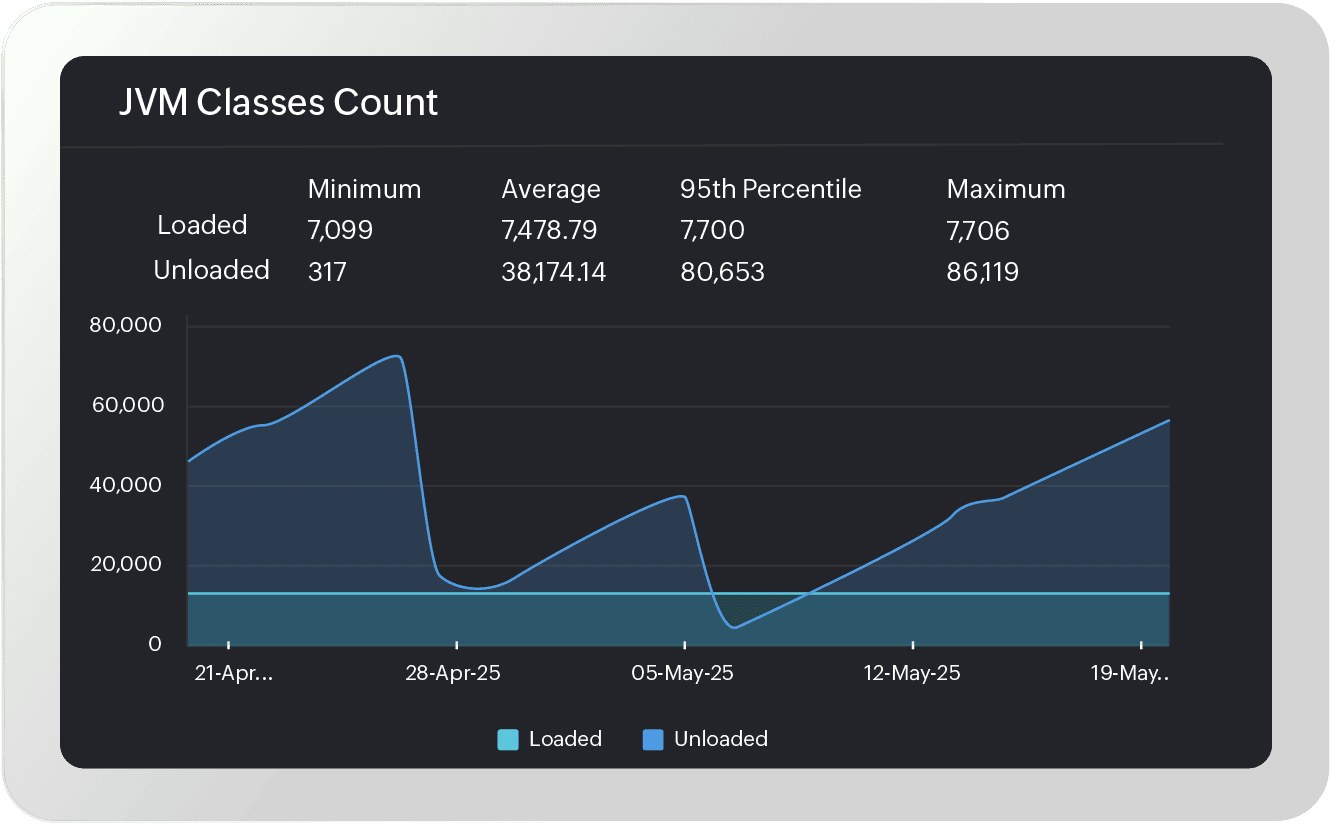
Keep tabs on class loading and JVM health

Gain insights into dynamic class loading behavior

  • Monitor the number of loaded and unloaded classes over time.
  • Detect class loader leaks or excessive dynamic loading.
  • Understand trends in class usage across deployments.
  • Combine with memory data to troubleshoot runtime anomalies.
  • Monitor class loading failures and dynamic class generation trends.
Unified monitoring of hybrid enterprise environments in one unified platform.

Unified dashboard for JVM and application performance

Correlate JVM stats with transaction performance for faster root cause analysis

  • View JVM metrics alongside application response times and errors.
  • Pinpoint whether slowdowns are caused by resource limits or bad code.
  • Jump directly from JVM charts to transaction traces or logs.
  • Streamline triage with unified visibility across the Java stack.
  • Diagnose issues easily with distributed tracing.
Correlate JVM metrics with application performance trends over time.

Start monitoring your JVM monitoring in minutes

Ensure optimal performance for your Java applications by deeply monitoring JVM metrics with Site24x7.

Start 30-day free trial Try now, sign up in 30 seconds
Request Demo
  • Request Demo
  • Get Quote
  • Get Quote