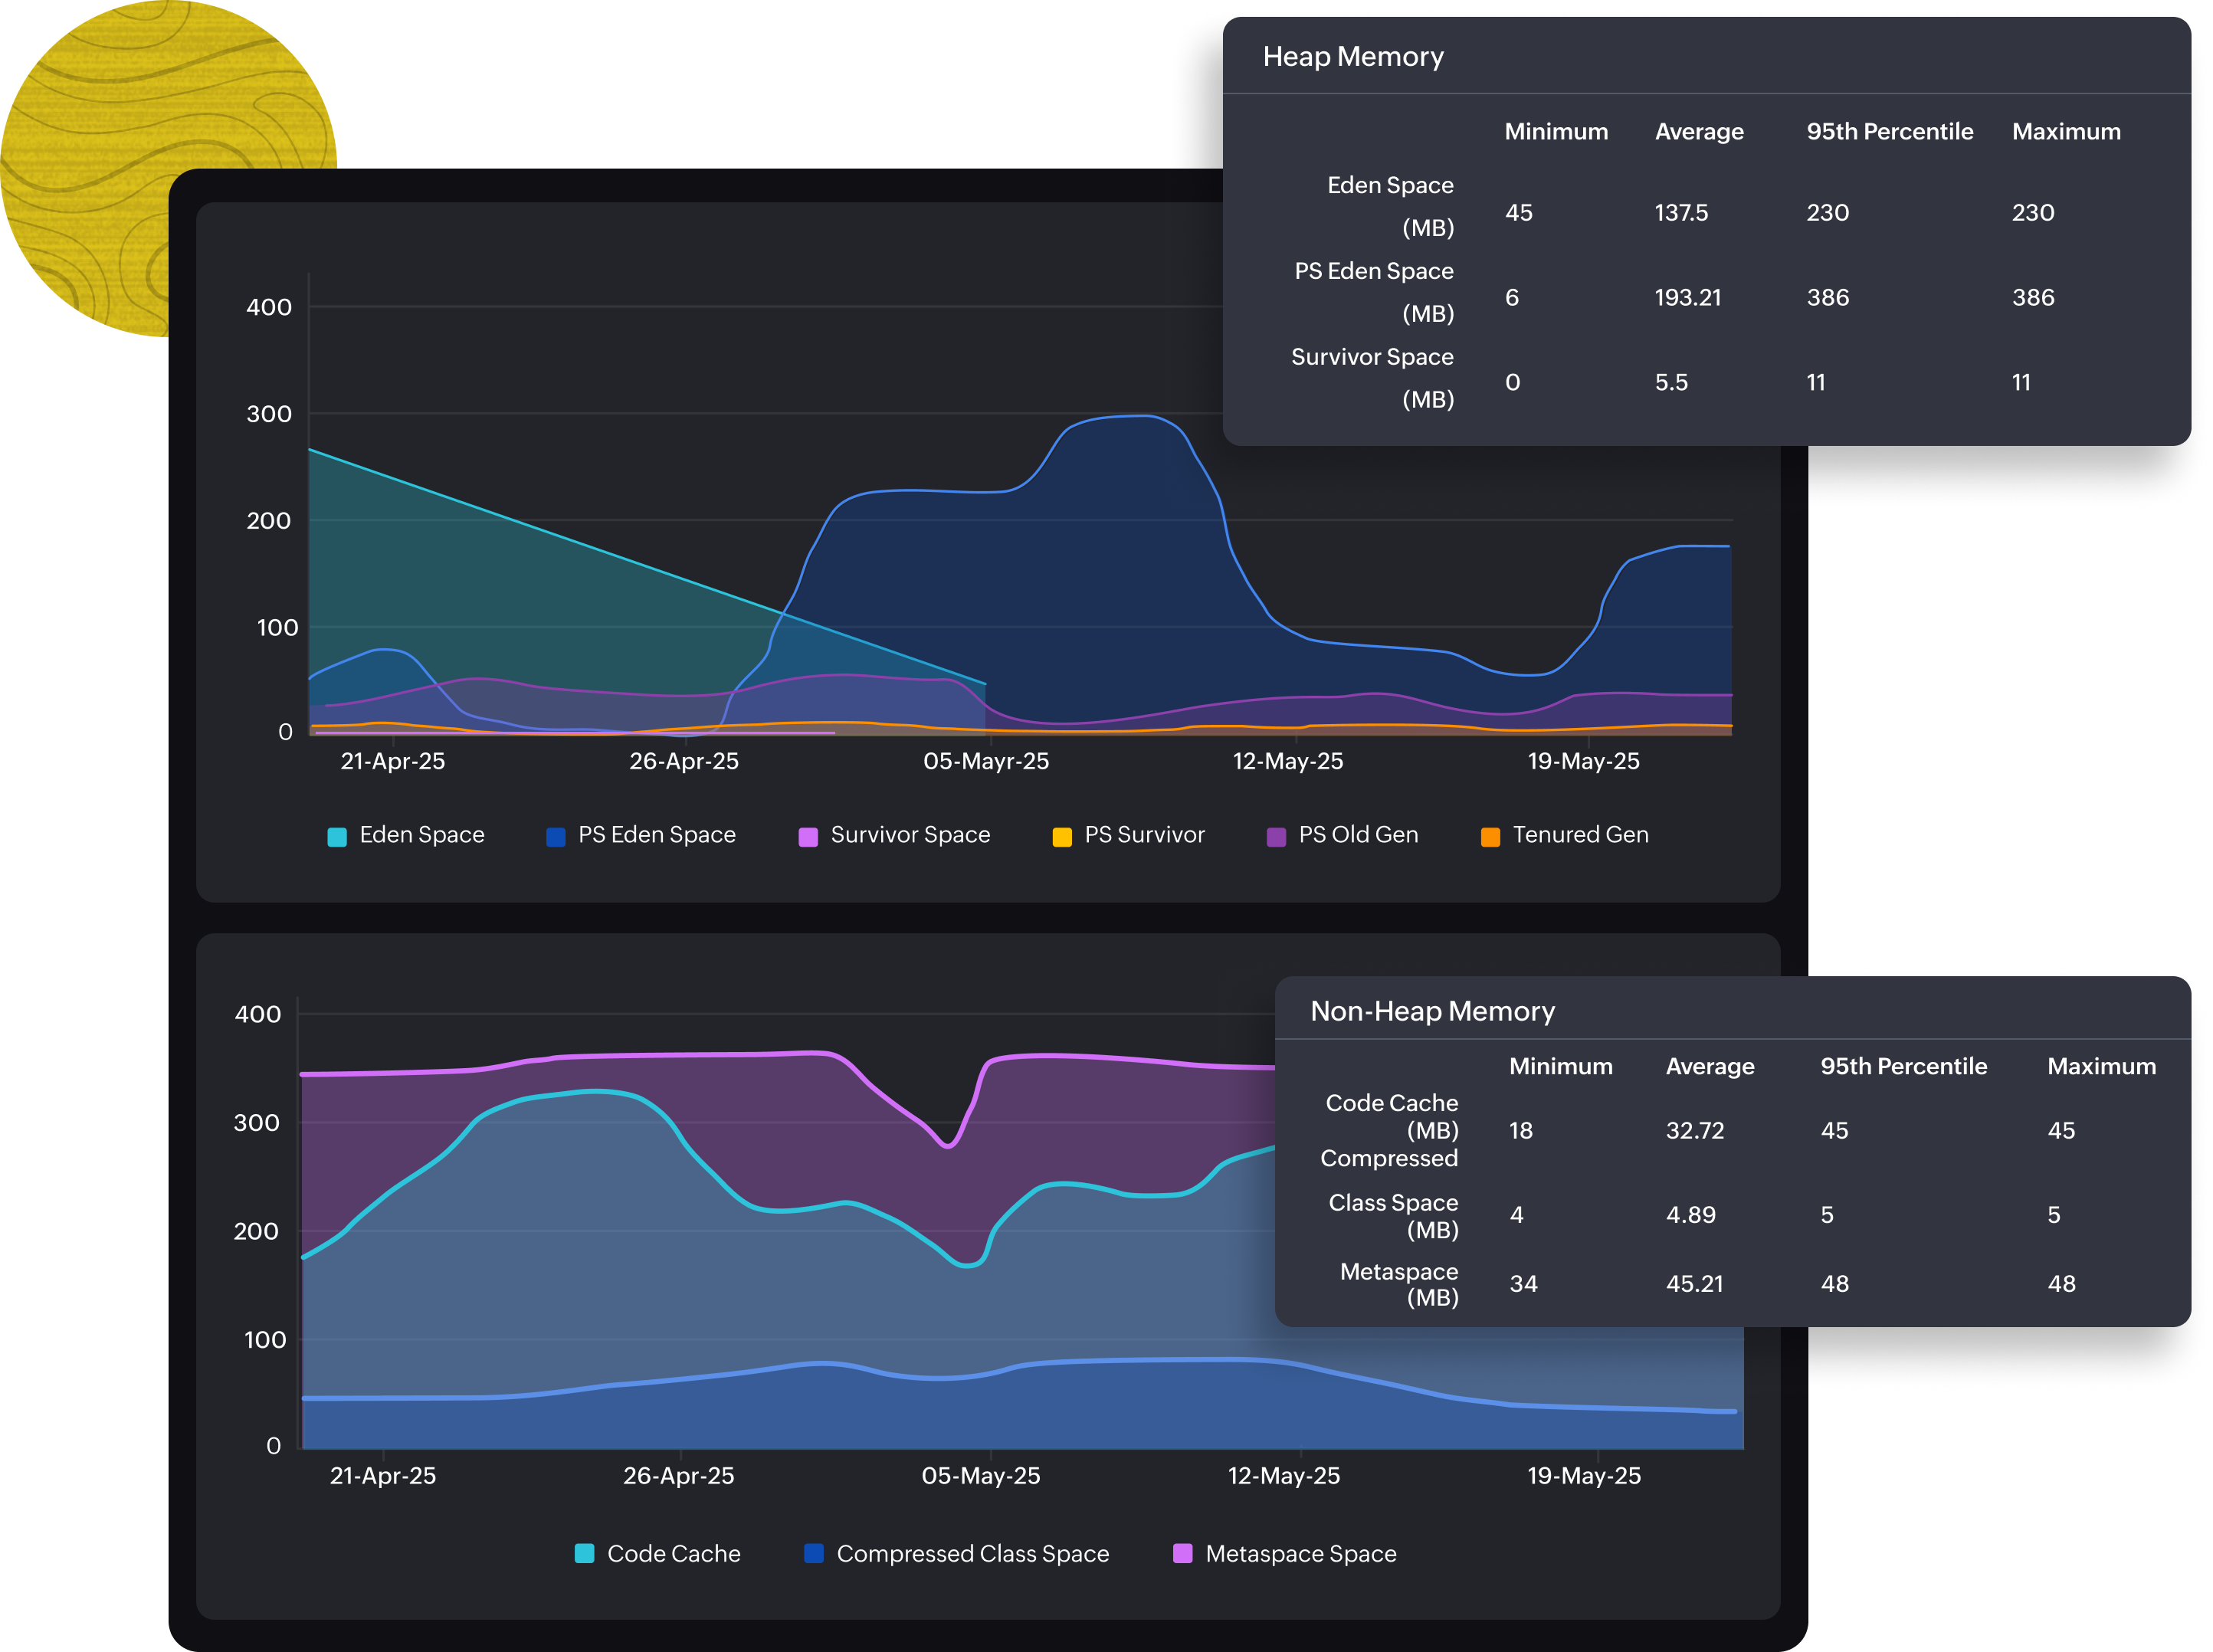
Track Eden, Survivor, and Old Generation memory spaces. Identify memory leaks and inefficiencies early.
Monitor garbage collection (GC) frequency and duration. Detect GC pauses or excessive collection cycles affecting app latency.
Track live, daemon, peak, and sleeping threads. Ensure proper thread pool usage and concurrency handling.
Observe how many classes are loaded/unloaded in real time to catch anomalies in dynamic loading scenarios.
Java applications are only as reliable as their runtime performance. Issues like memory leaks, blocked threads, or inefficient garbage collection can silently degrade the user experience before they trigger full-blown outages. Java runtime monitoring gives you the ability to detect these issues early, reduce MTTR, and ensure application responsiveness under all loads.

Site24x7’s APM Insight agent offers comprehensive Java runtime monitoring. It collects and visualizes JVM-level metrics with minimal overhead and integrates tightly with application performance monitoring.
| Problem | Root cause found using runtime monitoring | Resolution |
|---|---|---|
| OutOfMemoryError | Heap memory not reclaimed due to reference leaks; faulty caching logic holding strong references preventing garbage collection | Identified and fixed caching logic to release unused references, preventing memory leaks |
| GC pauses | Frequent full GC cycles observed under load, causing application pauses | Tuned GC algorithm (e.g., switched to G1GC) and adjusted heap sizing based on GC logs and JVM metrics |
| Excessive sleeping threads | Inefficient waiting/sleeping causing delayed responsiveness and thread blocking | Replace Thread.sleep() with proper wait/notify or concurrency utilities; optimize thread usage |
Check for prerequisites
Install the Java APM agent
View live runtime metrics