Real User Monitoring (RUM)
Even if your application is available, it may not be fast enough and most users won't wait. Keep an eye on how fast your web page loads, which page takes the longest, and whether the problem is on the server side, in network transit, or at the front-end. Obtain critical insight to improve your web application's performance.
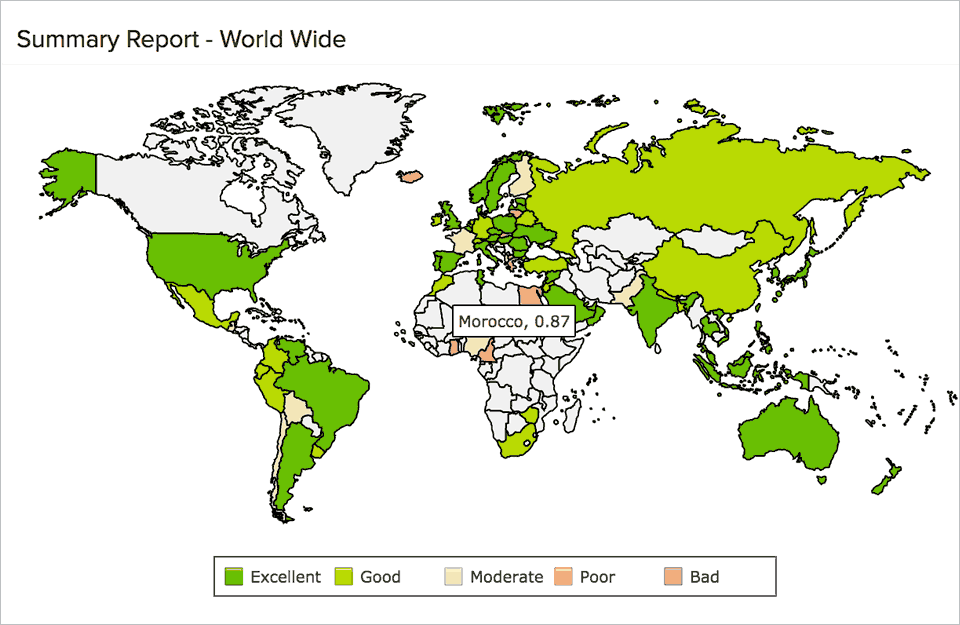
Monitor experience of real web users
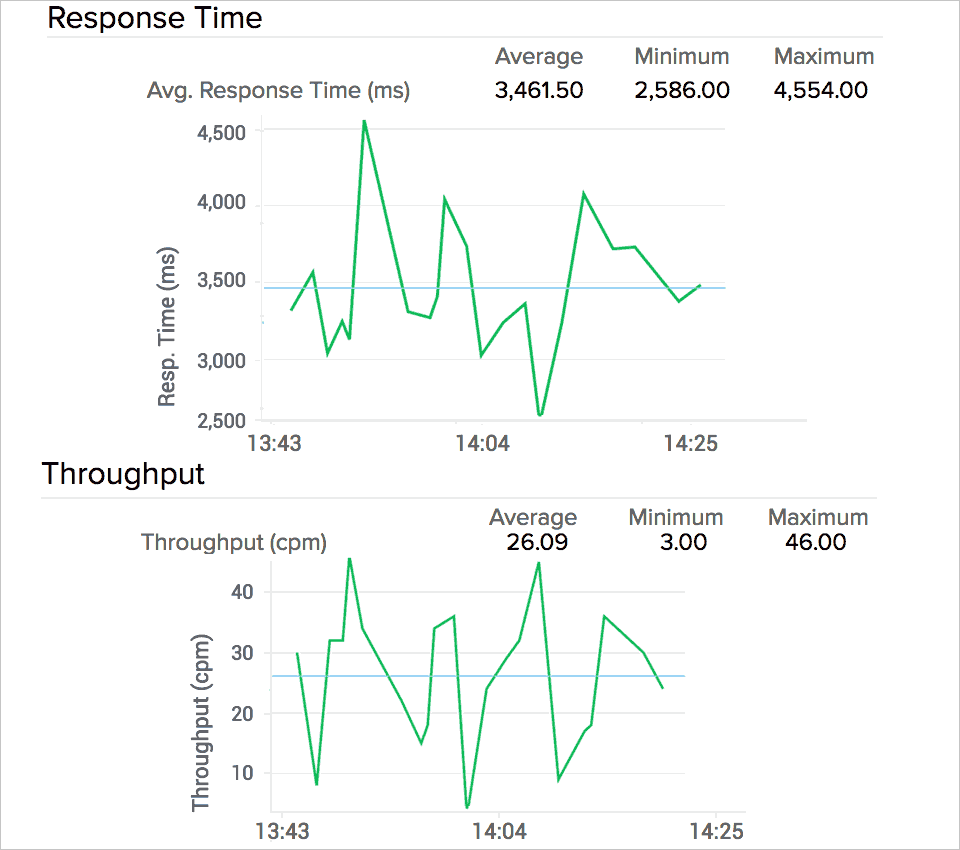
See page views as they occur, along with other details including geographic location, average response time, and throughput for all requests received.
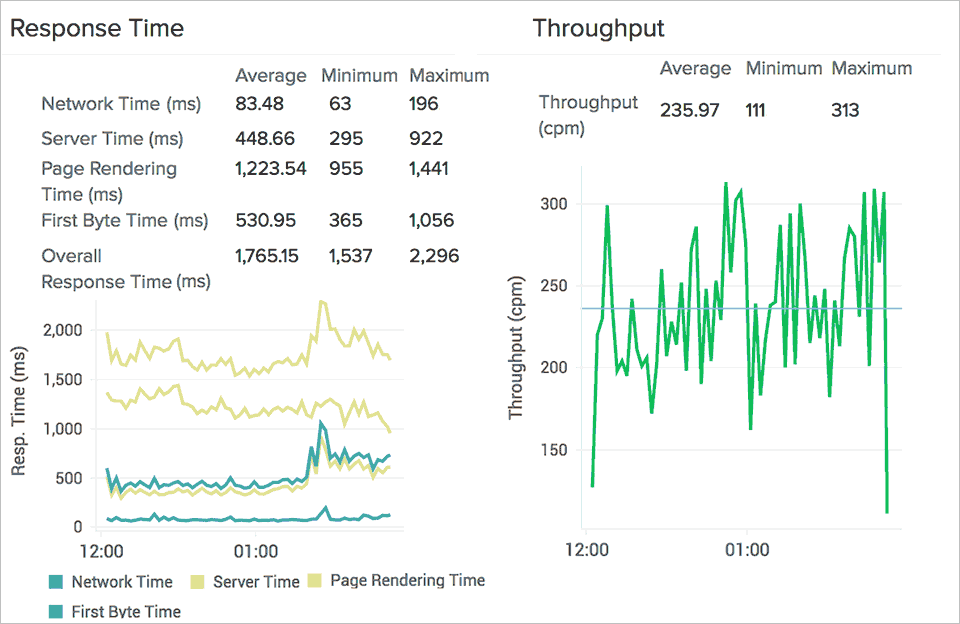
Response time break down
Analyze the response times for individual user requests to identify factors causing application performance issues. Are application server to database calls increasing your back-end time? Do you need to provision more CDNs to improve network time? Is the new JS MVC framework affecting DOM processing time?
Identify client-side performance bottlenecks
The document processing time and page rendering time metric shows you how long it takes for the web browser to parse HTML, JavaScript, and CSS elements. Fine tune your page assets to improve browser-side performance of your web application.
Keep end users satisfied
Measure end-user satisfaction for your website or web application by country with our Apdex score standard. Improve user experience by analyzing end-to-end transaction times and throughput for each HTTP request.
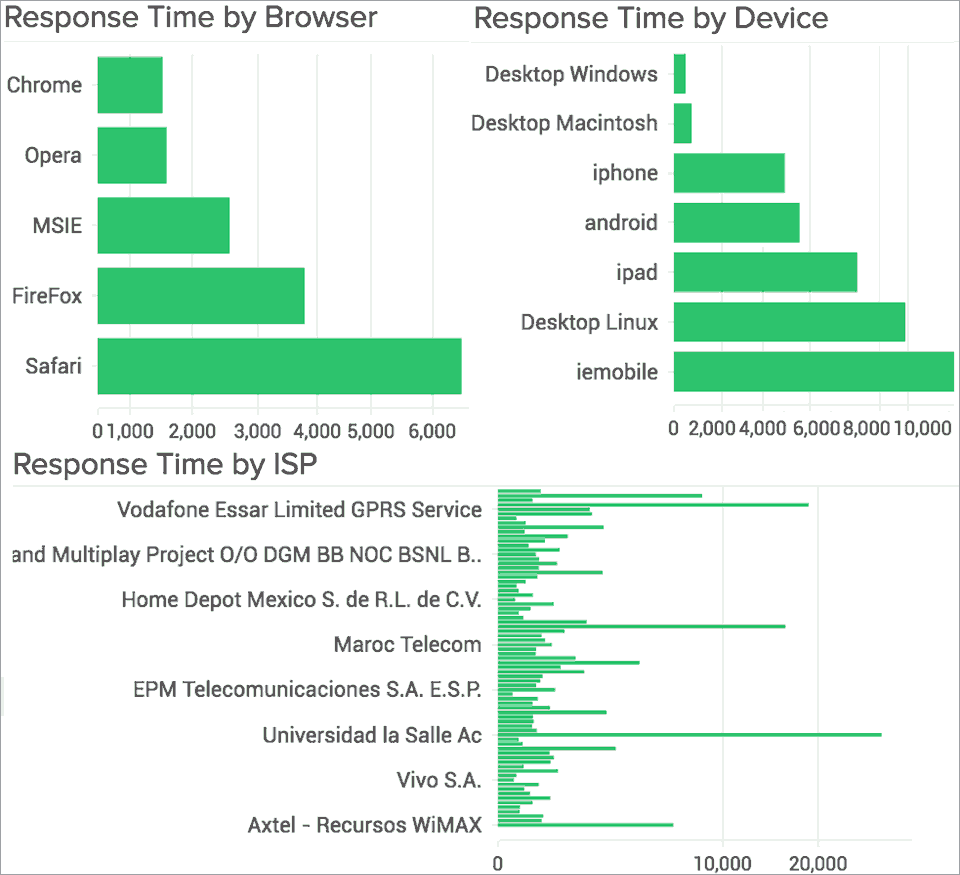
Browser, device, and ISP performance
Monitor user experience and page load times on different devices, browser types, and browser versions. See whether your user's ISP is impeding the performance of your cloud application.
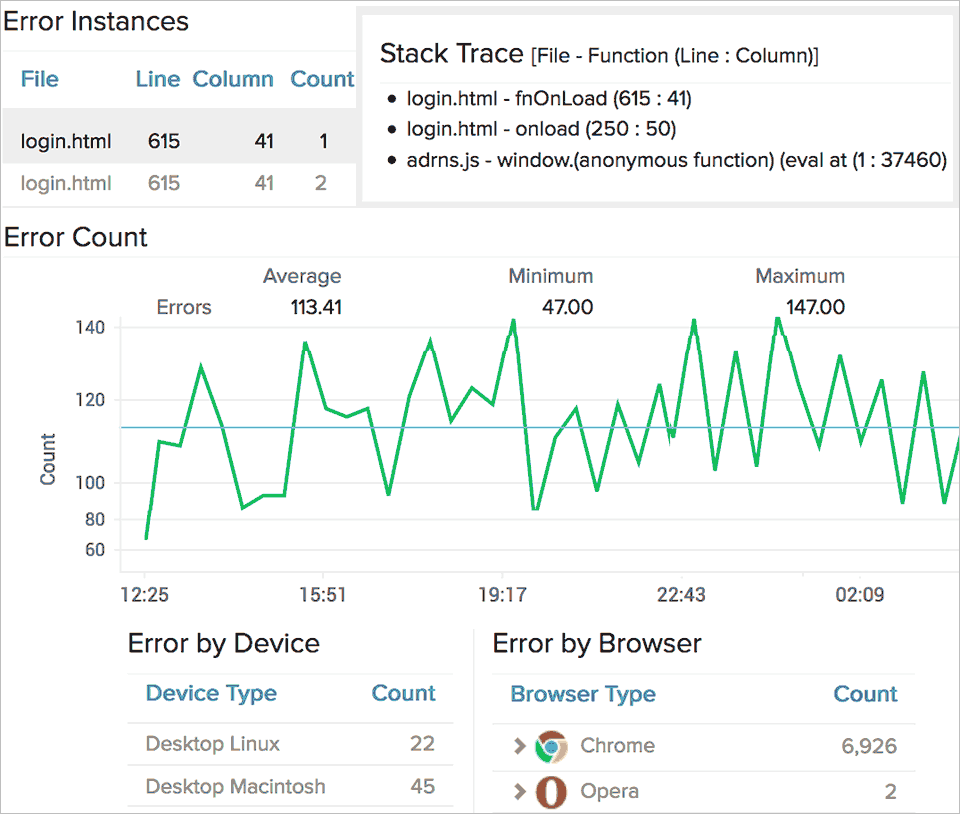
Granularity into JavaScript errors
Get detailed information on any JavaScript errors on your web application by device and browser type, including error type and count. Track individual JavaScript errors for each unique URL, down to the code with the stack trace details feature.
Monitor Single Page Applications
Analyze the response time taken for soft navigations, in page events, asynchronous AJAX calls and optimize end user experience in real time.
Get 500K RUM Pageviews for just $35/month with the PRO Plan.
Single page app visibility, Page load timings, JS errors, AJAX call timings and browser performance reports.
Sign Up NowMobile Real User Monitoring (RUM).
View your native iOS and Android mobile applications from an end-user perspective. Capture the transaction details of every single user touch and monitor every element of the mobile ecosystem to see how it affects application performance.
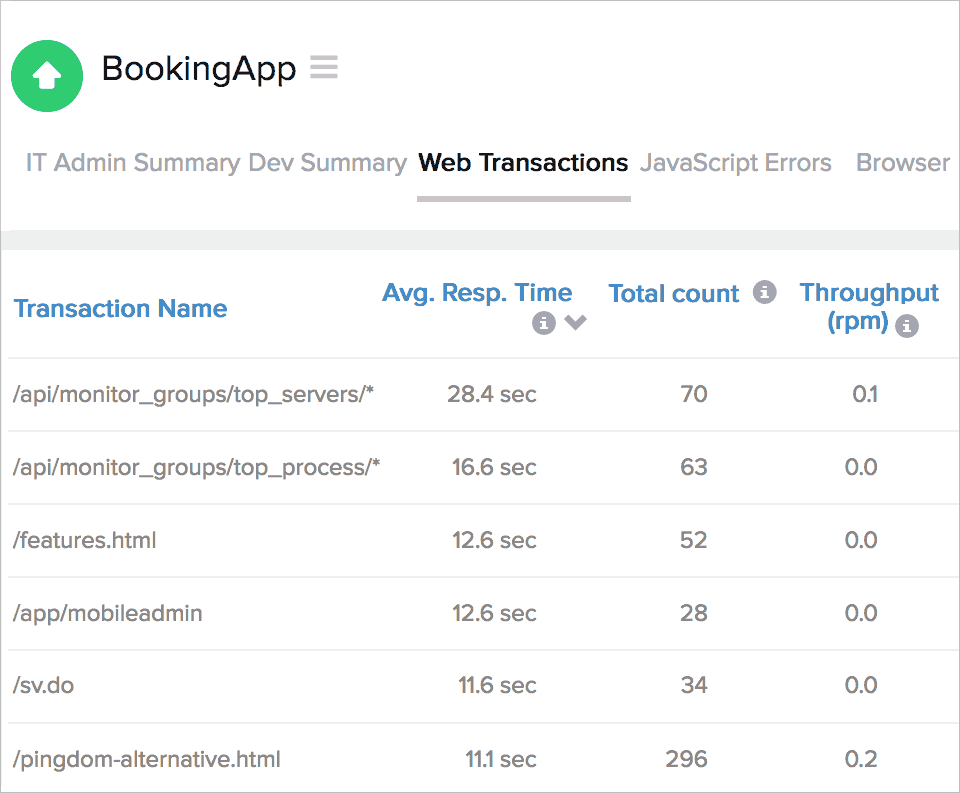
Capture performance metrics
- Analyze app performance with Site24x7 application performance monitoring, dig deep into each HTTP request, and obtain response time split up and throughput for each transaction
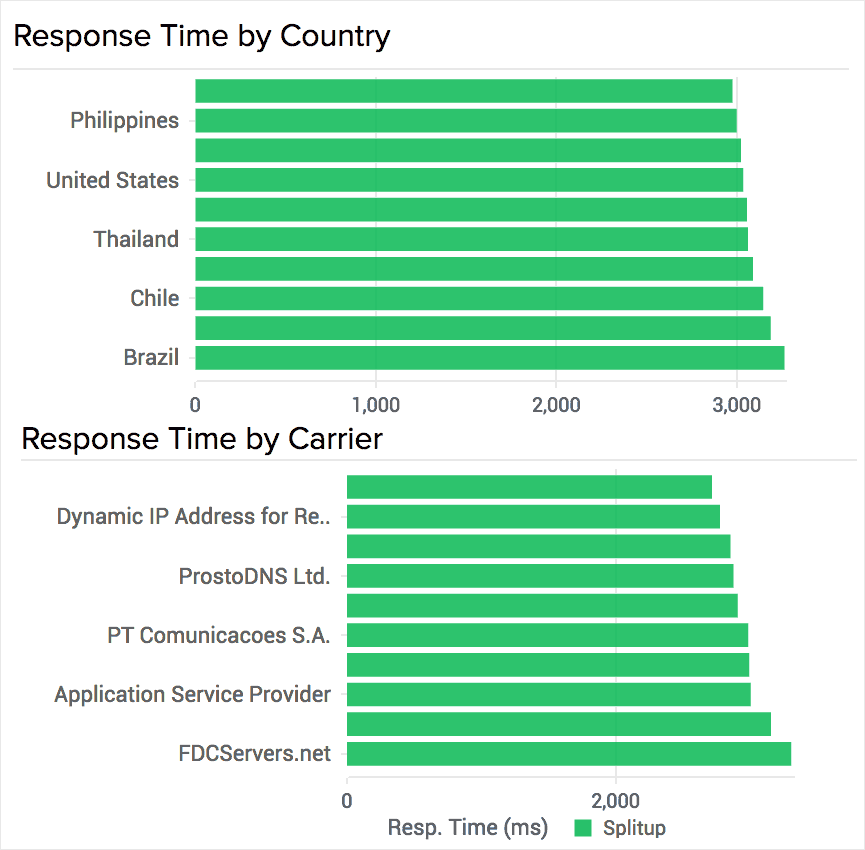
- Identify carrier-specific trends correlating with poor app performance
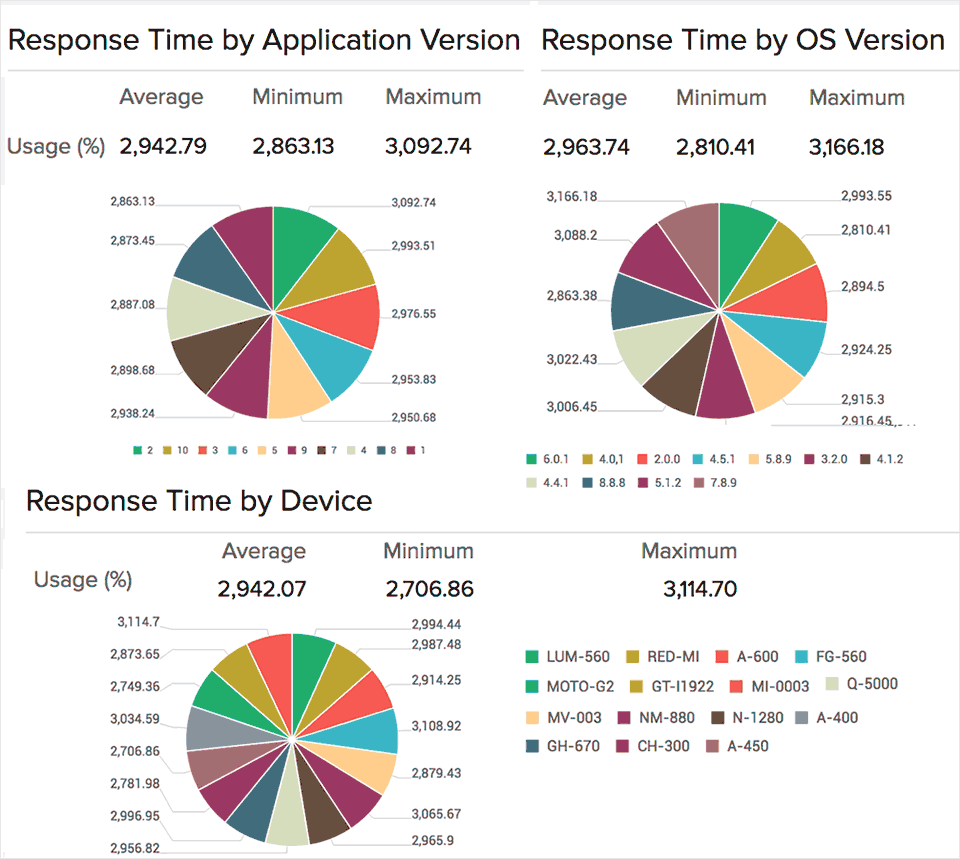
- Analyze how well your app is running on different versions of the OS
- Identify the most common devices used to access your app, measure response time by device, and see how well your apps perform on different devices.
Understand your core user demographic
- See where your users are based, identify regions experiencing poor app performance, and measure average response times and numbers of calls or requests by country.
- View objective data regarding the adoption rate and app version stability with the response time by app version metric.
Browser synthetic transaction monitoring
Record and simulate user experience on your website or web application from 60 global monitoring locations or from behind your firewall with our on-premises poller to ensure 24/7 application availability and high performance.
Uncover performance and availability issues before release.
Monitor the performance of web applications before they go into production. Run scripted transactions and uncover performance and functionality issues before your user does. Benchmark application performance by executing known scripts, which simulate typical user paths on your website, at regular intervals.
Play back user interactions on a real browser.
Record user interactions and play them back at regular intervals via a real browser or non-graphical interface. The recorder tool captures all elements the user clicks on and saves them as web scripts. During play back, the web page's entire JavaScript is executed, along with all elements including CSS, images, flash components, and Ajax calls. The non graphical interface captures only the core HTTP request and checks whether it returns a valid response code.
Manage third-party SLAs.
Web pages and applications typically leverage third-party elements such as external APIs, flash components, login forms, site search components, payment gateways, shopping carts, and in-line help desk support to provide a unique digital experience to users. Check whether these third- party components are available and functional before your user does and hold your vendors accountable for any SLA violations.

Monitor end user experience of internet services and web services protocols.
- Measure email round-trip time, identify bottlenecks in the email deliver process
- Test upload/download functions on your FTP enabled servers
- Monitor availability and performance of REST API end points.