Greetings,
We're back with a new set of enhancements for Real User Monitoring (RUM) and are giving you a sneak peek.
You can now visualize the following aspects of response time and throughput:
- Country and state-based views for respective geographies: You can now view the response time and throughput for a country and each of its states individually. For example, you can view metrics for Australia as a whole on the world map, or view metrics for the northern and southern regions in the Australia view. This provides granular details with respect to your chosen region.
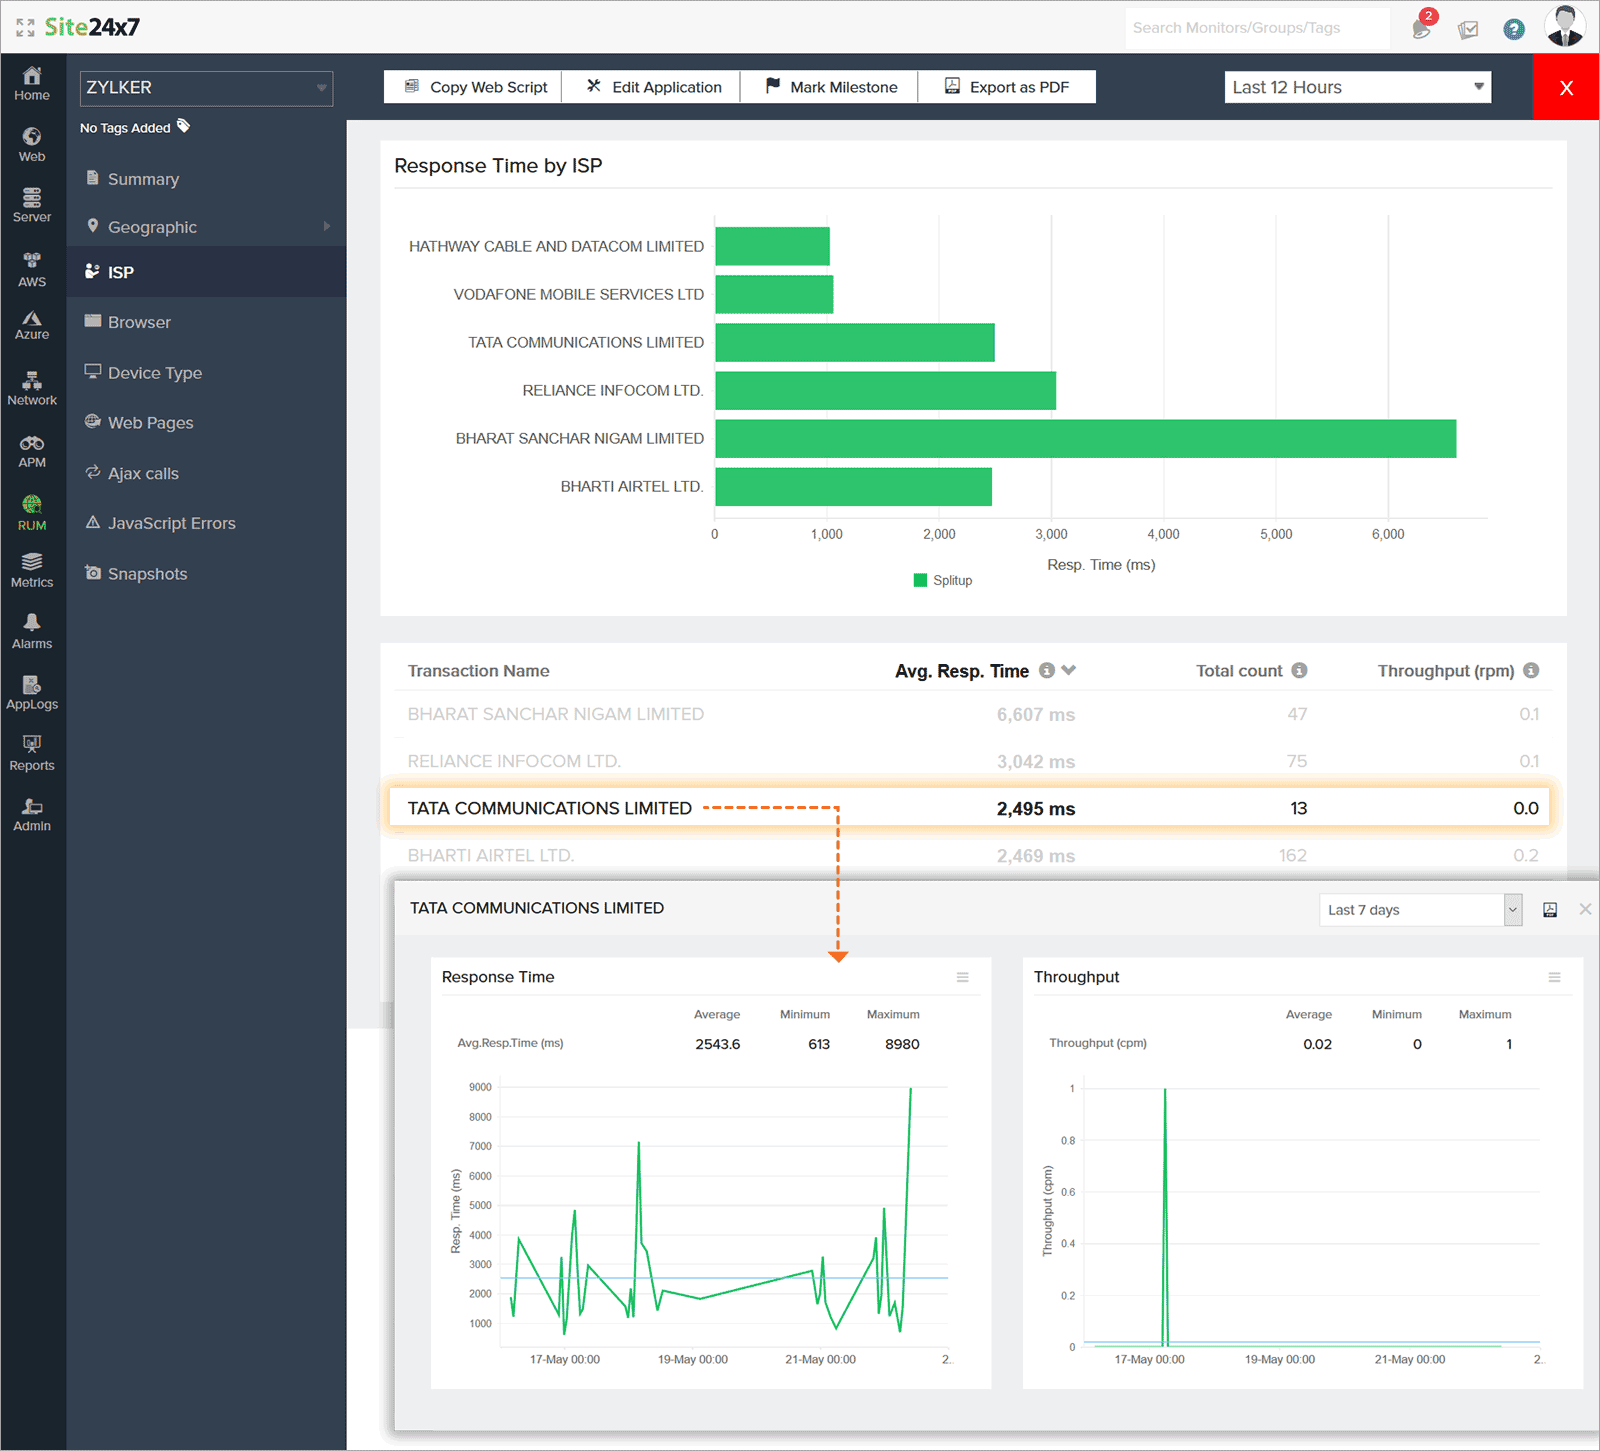
- ISP specific information: Analyze the response time taken by different ISPs. Response time and throughput split up for individual ISPs are shown for a chosen time period. This helps you assess whether application slowness is being caused by any specific vendor.
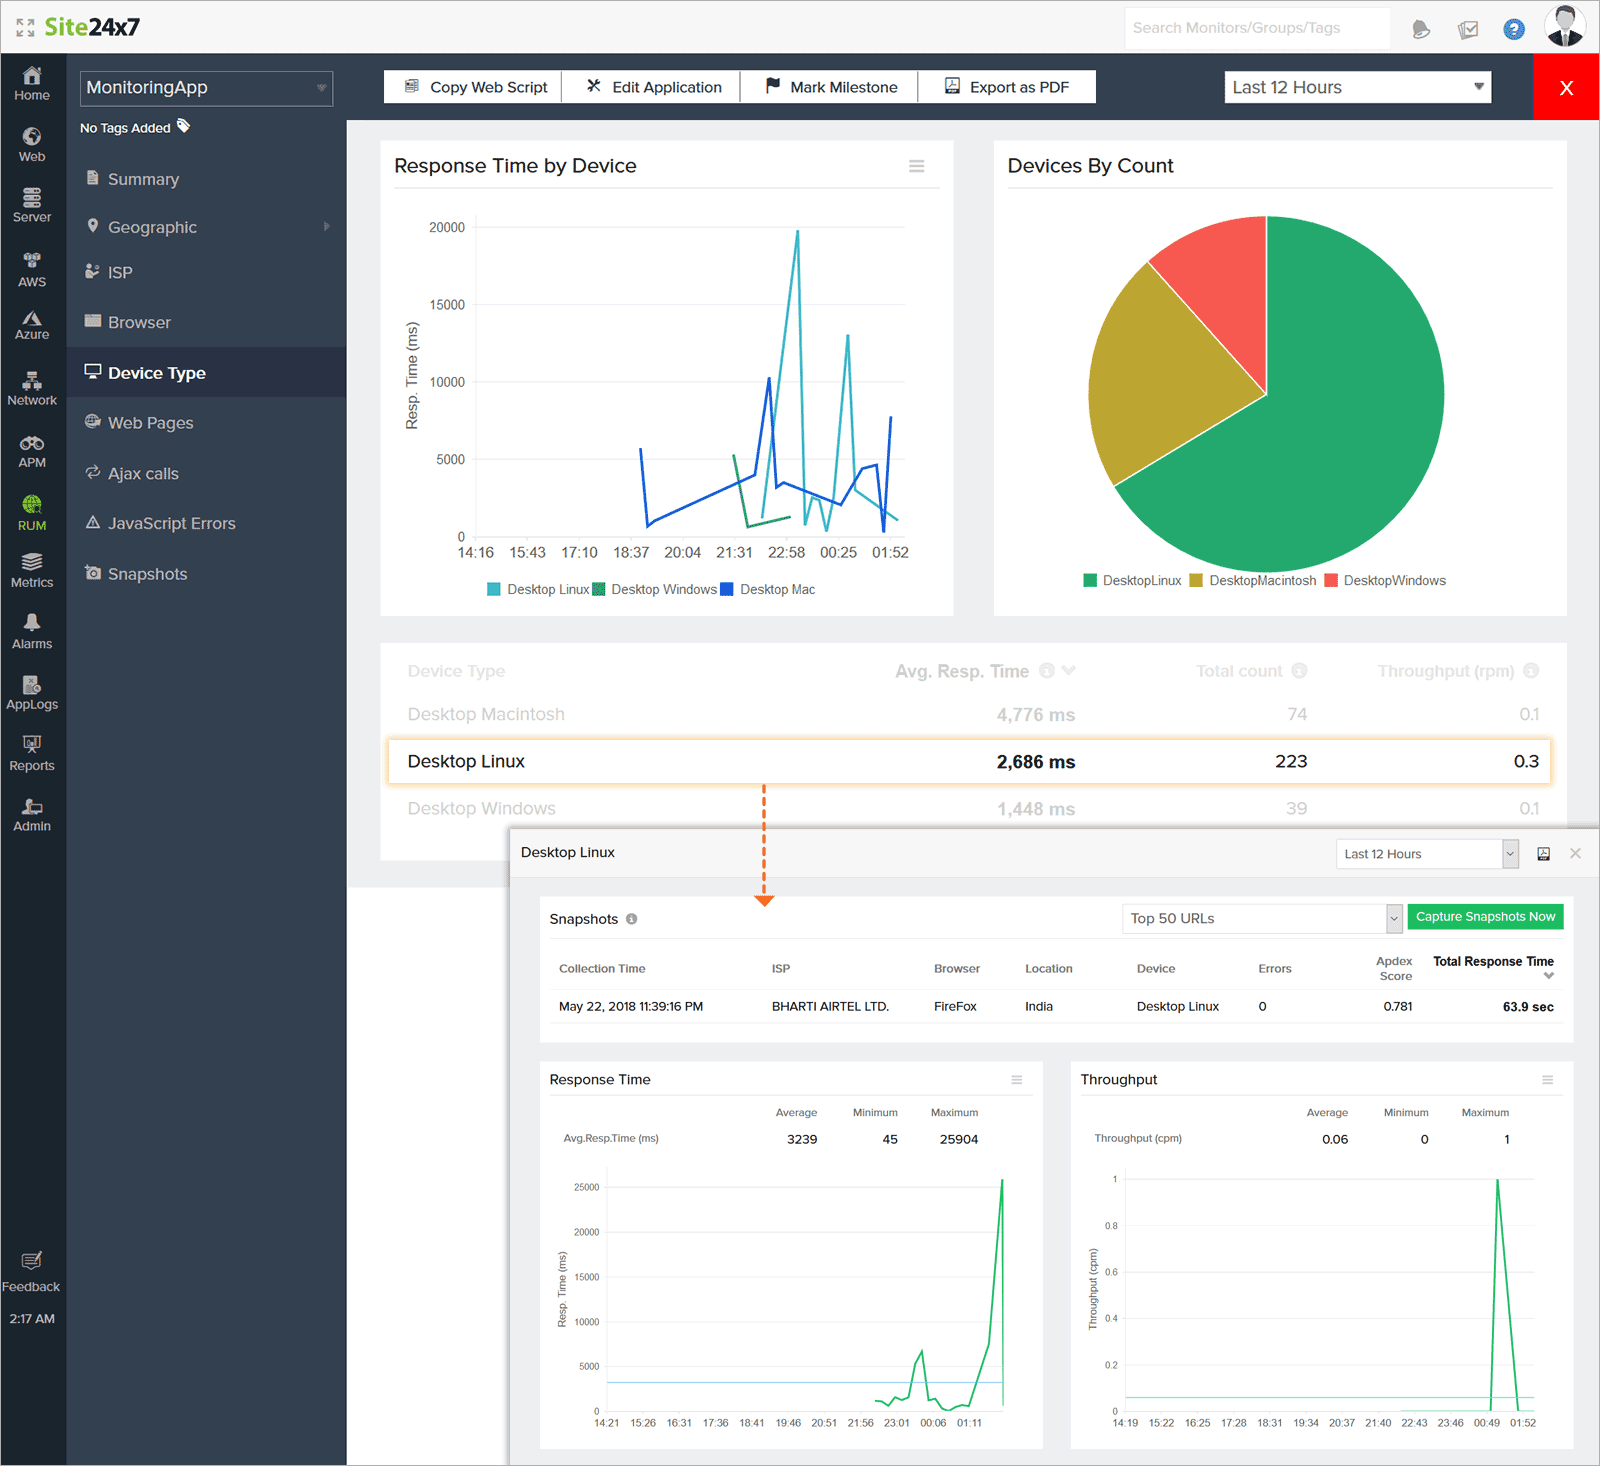
- Device type: Understand web application behavior in various devices with the help of the Response time graph. Response time and Throughput graphs for individual device types are shown for a chosen time period. You can also view the request count received by each device type.
- Browser type: Understand your website's response time across different browser types. You can also view the request count received by each browser type. Response time and throughput for each browser type is also listed for a chosen time period.
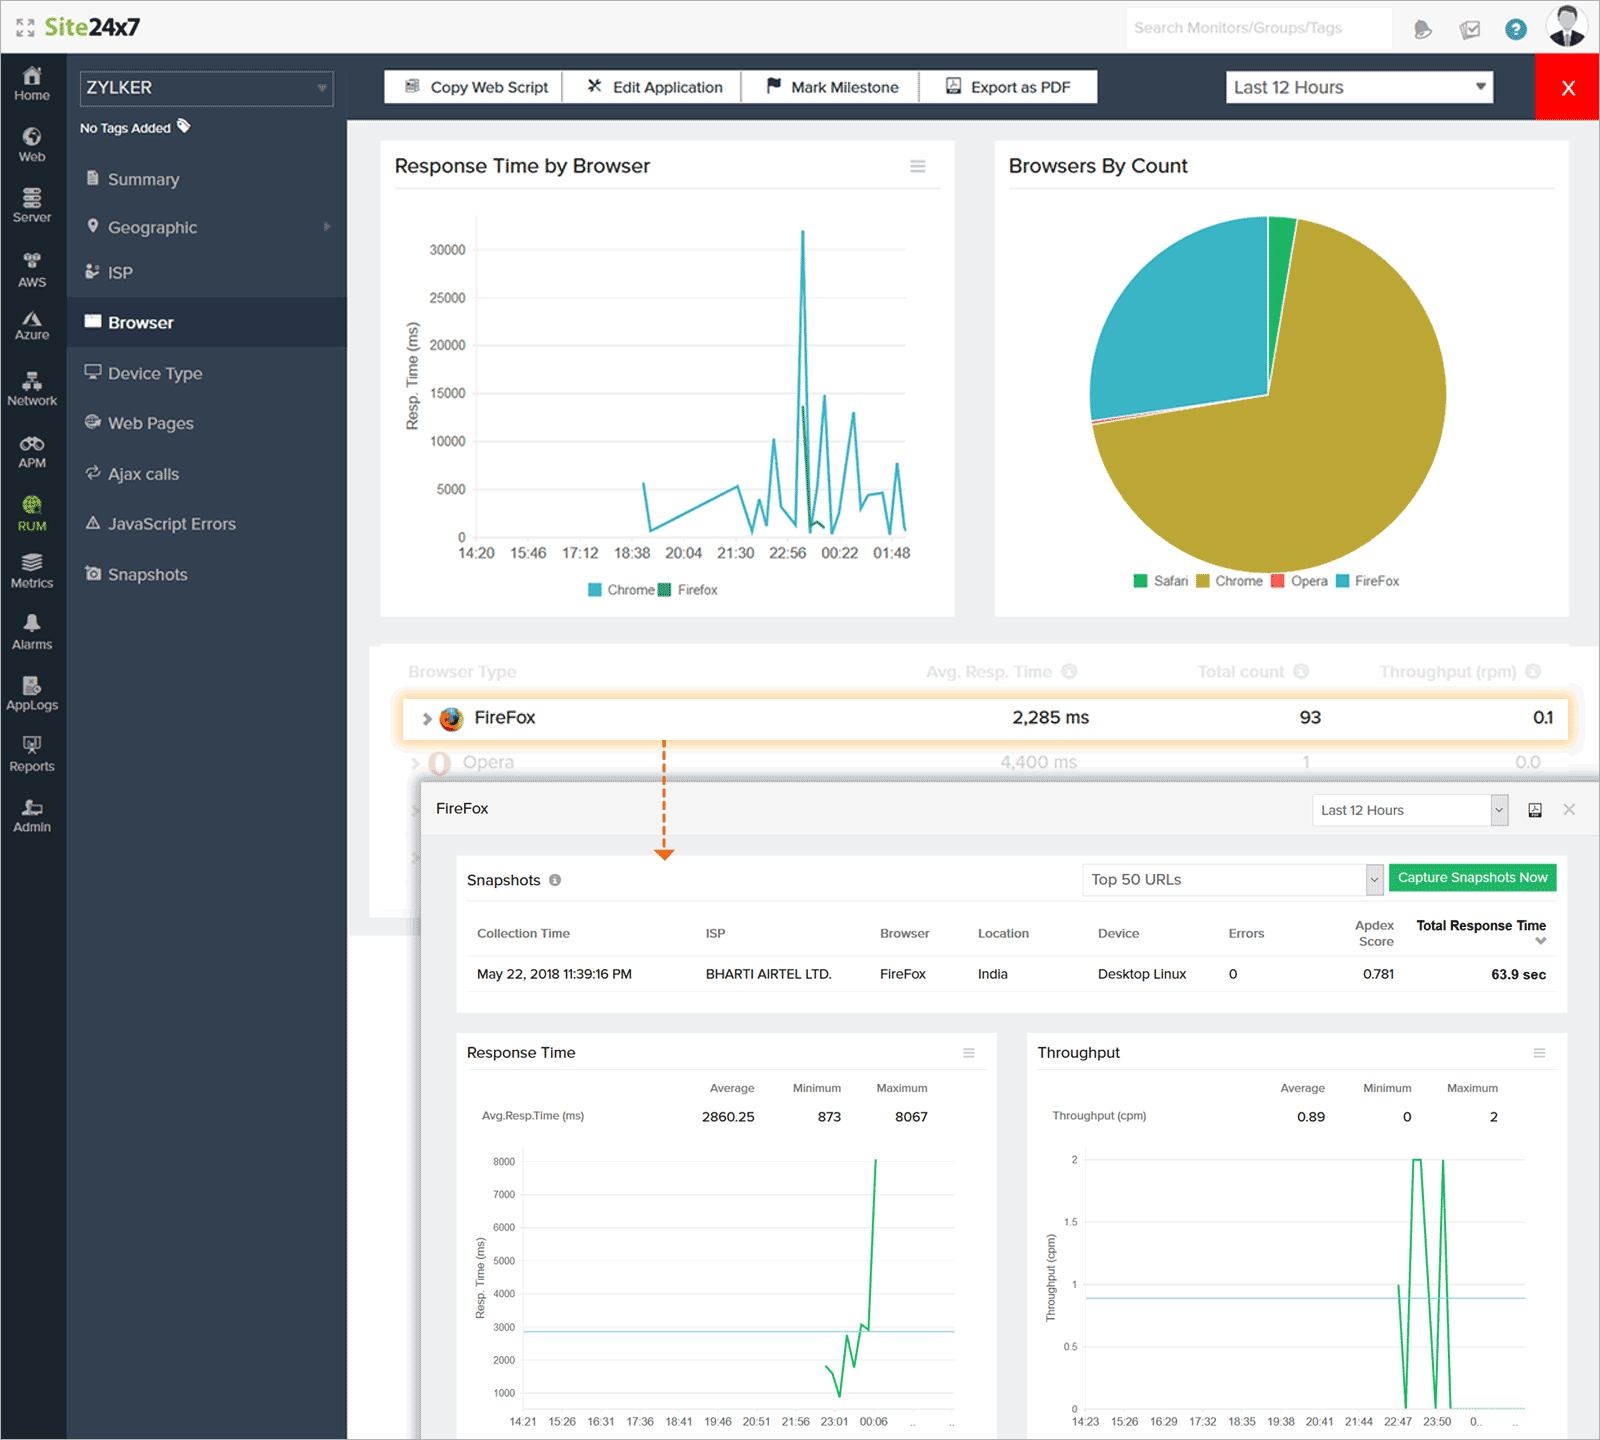
Related info: https://www.site24x7.com/help/apm/rum/rum-monitor-details.html
Stay tuned for future updates!
Like (2)
Reply
Replies (0)