Azure Blob Storage is foundational to modern cloud applications—supporting everything from media delivery and analytics to critical data pipelines. However, when its performance degrades, the consequences ripple across systems, including: user-facing delays, disrupted workloads, and escalating operational costs.
Identifying the root cause of Blob Storage latency can be complex. Often, logs show no issues, containers appear healthy, and yet, data access remains painfully slow. In this article, we'll break down the common causes of Azure Blob Storage performance issues and walk you through practical steps to diagnose, troubleshoot, and resolve them. Whether you're managing media files, app data, or analytics workloads, this guide will help you keep your Blob Storage fast, efficient, and dependable.
Diagnosing and troubleshooting Azure Blob Storage performance
Check if the performance issue is region-specific
Blob Storage performance can vary by region. Sometimes, the issue isn't with the blob itself but with latency between services spread across different Azure regions. If your computing and storage resources are in separate areas, even a slight separation can introduce noticeable delays, especially for data-intensive applications. If high latency is detected, consider geo-replicating your blobs or rearchitecting for data locality to keep interdependent services within the same region. This is a crucial step in diagnosing Azure Blob latency, especially for apps requiring low-latency access to frequently used assets. Additionally, check the Azure Status portal for any known issues in your area.
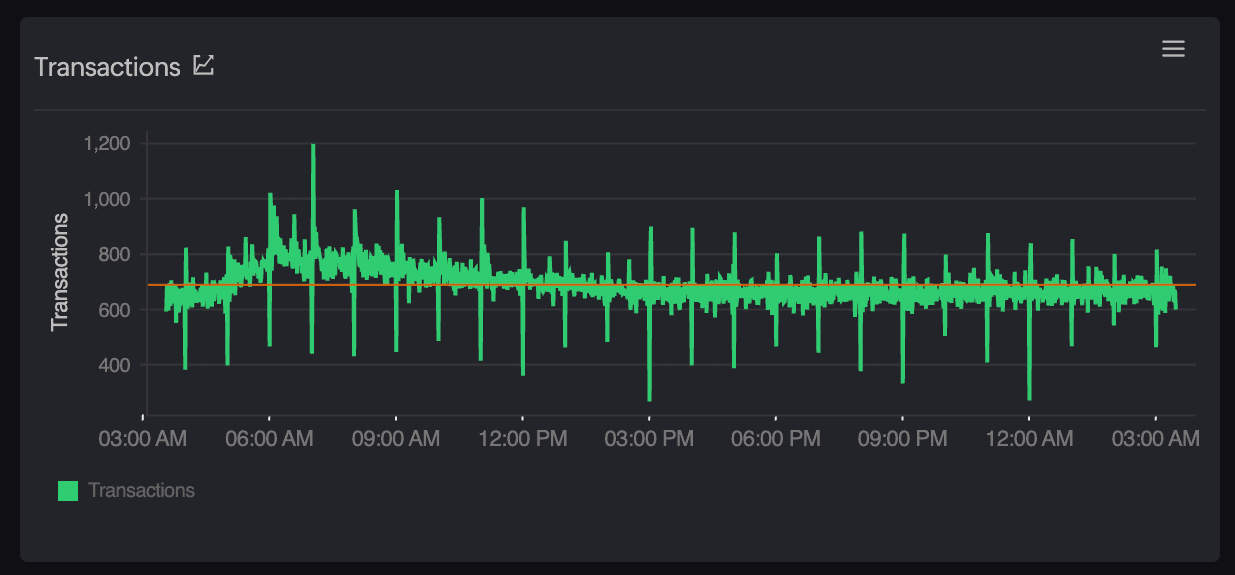
Investigate storage account throttling and limits
Azure Storage accounts have built-in scalability targets, and exceeding these can lead to throttling. For instance, during peak hours, a team uploading logs experienced slow response times because their storage account hit the request rate limit, resulting in throttling. If your application encounters spikes in request rates, you might observe 429 (Too Many Requests), 503 (Server Busy), or 500 (Operation Timeout) errors—common indicators of throttling. Monitoring tools like Site24x7 can help identify these issues and provide robust Azure Blob Storage monitoring through detailed telemetry on throttling and request patterns. Persistent throttling suggests that your workload is consistently surpassing the account's limits. In such cases, consider upgrading to a premium tier or distributing data across multiple storage accounts to balance the load.
Analyze blob access patterns and object sizes
Not all blobs are equal. Streaming large files like high-resolution PDFs or videos directly from Blob Storage can lead to timeouts or partial loads, especially when accessed via browsers. Such issues often arise when large blobs are delivered without optimization, causing performance bottlenecks. If you're delivering sizable files to end users, consider implementing chunked downloads and enabling range requests to allow partial data retrieval. Caching frequently accessed content closer to users, for instance, using reverse proxy techniques or integrating with Site24x7-monitored delivery endpoints, reduces load times and bandwidth consumption. For streaming scenarios, ensure appropriate content headers are set to support efficient data delivery.
Review network paths and application code
Performance issues with Azure Blob Storage aren't always due to the service itself; sometimes, they're rooted in how your application interacts with it. For instance, using outdated software development kits (SDKs) or making synchronous blob requests within loops can lead to long wait times and a degraded user experience. Ensure you're utilizing the latest Azure SDKs, which offer optimized asynchronous operations. Refactor any blocking code to adopt sync patterns, allowing for non-blocking I/O operations. Additionally, robust retry logic with exponential back off should be implemented to handle transient failures gracefully. Tracing request behaviors using Site24x7's application performance monitoring capabilities can help diagnose Blob Storage latency caused by inefficient code interactions, enabling you to identify and address inefficiencies in your application's communication with Azure services.
Check for issues with Azure Private Endpoints or firewalls
In secure enterprise environments, misconfigured Azure Private Endpoints can inadvertently introduce latency. For example, if DNS resolution isn't correctly set up, traffic intended for a private endpoint might traverse unintended paths, leading to increased access times. Additionally, improperly configured network security groups (NSGs) or firewalls can further impede performance by introducing unnecessary inspection delays. To ensure optimal performance, validate that DNS resolution directs traffic appropriately within your virtual network. Combined with Azure observability for storage, you can proactively identify misrouted traffic or DNS delays. Use Site24x7's network monitoring capabilities to trace network paths and diagnose potential bottlenecks to trace network routes and identify possible bottlenecks. Ensuring that NSGs and firewalls are configured to allow necessary traffic without redundant inspections can also help maintain efficient access to your Blob Storage resources.
Leverage logging and observability to detect root causes
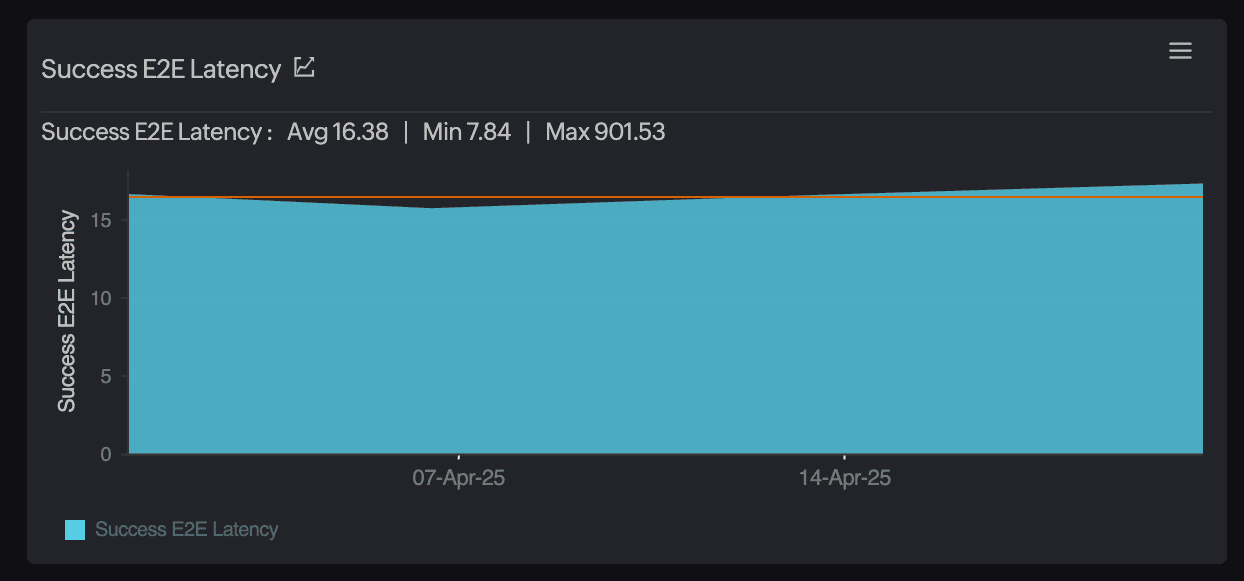
When performance issues arise, it's easy to blame the database, but Blob Storage can often be the hidden bottleneck. Without proper observability, pinpointing the exact cause becomes a guessing game. To gain clarity, enable diagnostics logging on your Blob service. Monitor metrics like SuccessE2ELatency, SuccessServerLatency, and AverageE2ELatency. These metrics help distinguish whether delays are occurring on the client side, within the server, or due to network issues. By analyzing these metrics, you can correlate Azure Blob latency with application performance, leading to more informed troubleshooting and optimization efforts.
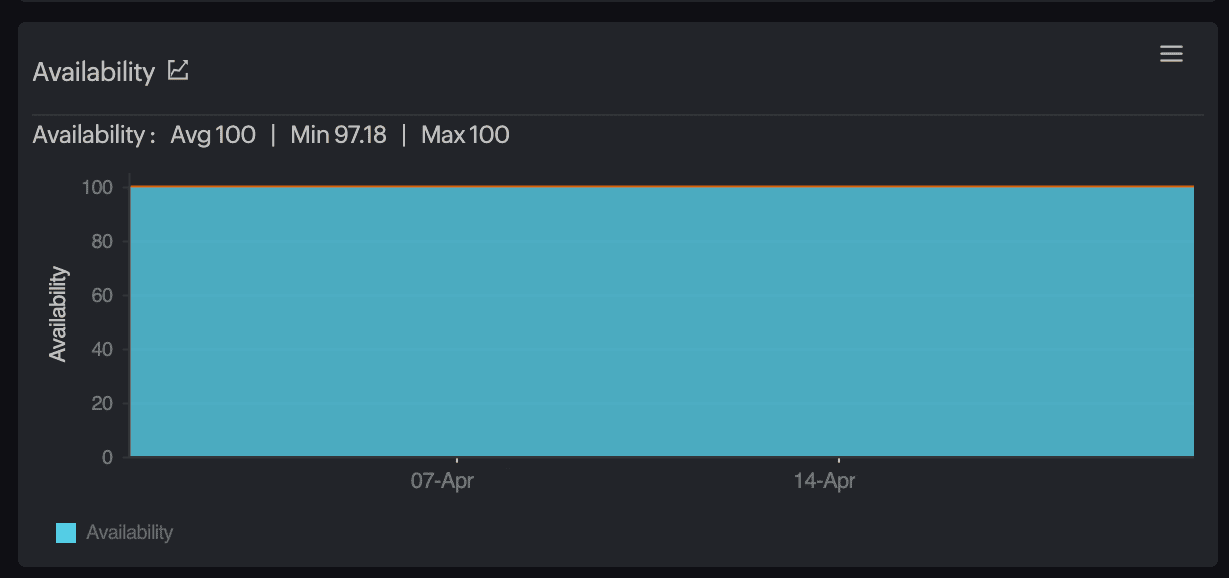
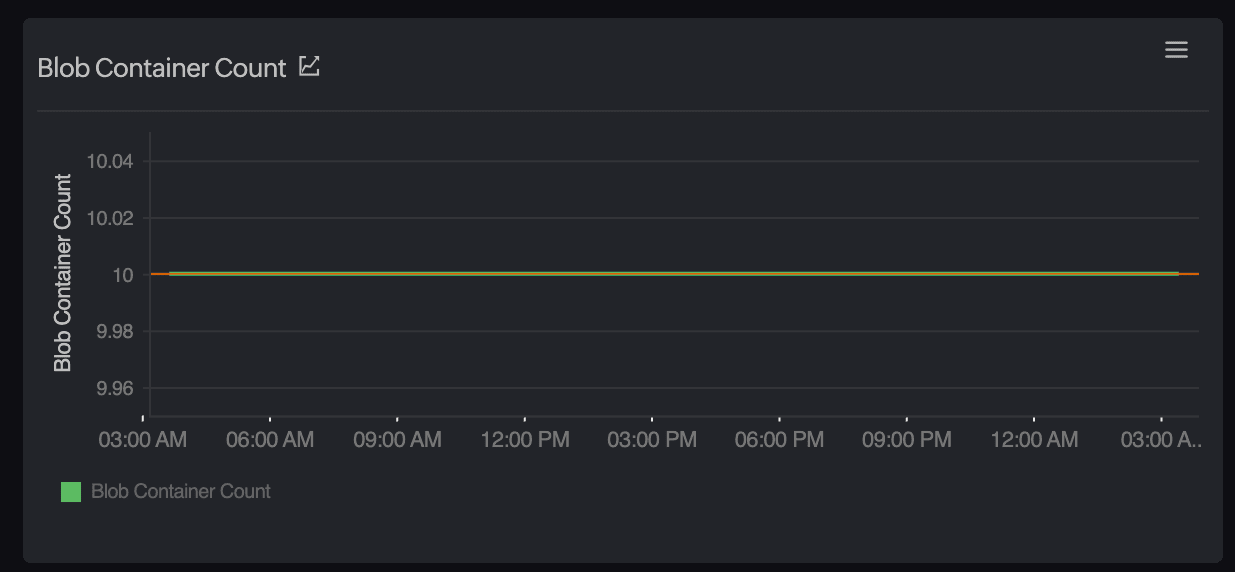
Leveraging Site24x7 for Azure Blob Storage Performance Optimization
It is often a small hiccup that escalates into an increased Blob Storage slowdown. But with the right tool at hand, nothing is unmanageable. Site24x7 simplifies debugging with out-of-the-box monitor Azure Blob Storage with Site24x7 tools that provide deep insights. When integrated into your Azure environment, this gives you full visibility into read/write latencies, server errors, and data throughput. It lets you track critical metrics like BlobCapacity, BlobCount, SuccessE2ELatency, and Availability while also correlating them with application-level insights thereby helping you optimize Azure Blob Storage. You can assign limits for specific containers, get alerted in the case of throttles, and even monitor across multiple storage accounts—ideal if you're running multi-region or multi-tenant environments. Site24x7 can especially be a natural fit if you're running other services in Azure alongside Blob Storage. Site24x7's unified Azure monitoring ensures you're not flying blind. Whether it's a spike in request queues, a delayed function trigger, or a misbehaving VM, everything's stitched together in a single view. As a developer, your time is better spent building things than debugging slow blobs. Let smart observability solutions like Site24x7 handle the grunt work while you focus on delivering fast, reliable experiences.