Downtime is no longer just an inconvenience—it’s a critical business risk. Even a brief interruption in application availability can lead to lost revenue, abandoned user sessions, and a flood of support requests. For on-call engineers, these incidents often arrive without warning and demand instant triage, even when root causes are buried deep in the code or infrastructure. In such moments, the ability to respond swiftly and confidently becomes essential—not just to restore service but to preserve user trust and business continuity.
Whether triggered by a misconfigured deployment, an overloaded service, or a chain reaction across microservices, unplanned downtime adds complexity with every passing minute. An Uptime Institute report revealed that 80% of data centers experienced at least one outage from 2019 to 2022, with 25% of the outages in 2021 classified as serious or severe. In such a fragile environment, readiness and rapid response aren’t just operational goals; they’re competitive differentiators.
What is application downtime?
Application downtime refers to the period during which an application or a critical part of its functionality becomes unavailable to end users or fails to operate as intended. This can range from full system outages to micro-outages affecting specific services or regions. Downtime can be classified as planned (for scheduled maintenance or upgrades) or unplanned (due to bugs, misconfigurations, resource exhaustion, infrastructure failures, or external attacks). The latter type is particularly disruptive and unpredictable, making it a key focus area for observability strategies.
The true cost of downtime
For large enterprises or SaaS providers, unplanned downtime can amount to a loss of millions of dollars per hour. Yet the cost of downtime goes far beyond direct revenue losses. Beyond the financial impact, downtime leads to:
- Customer churn due to poor experiences.
- SLA and compliance breach penalties.
- Reputational damage.
- Reduced developer productivity as the workforce spends a lot of time in reactive firefighting mode.
- Delays in deployments or releases.
With modern applications relying on CI/CD pipelines and global userbases, even milliseconds of latency or errors can affect hundreds or thousands of users instantly.
How monitoring prevents downtime
Monitoring acts as the first line of defense against outages. Collecting telemetry data (logs, metrics, traces, and events) provides real-time and historical visibility into application behavior. A robust APM solution not only surfaces performance issues but also provides contextual insights for quick resolutions. It enables:
- The early detection of performance regressions.
- Correlation across components to isolate the fault domain.
- Automated incident workflows and alerting.
- Baseline comparisons for anomaly detection.
- Predictive analytics to prevent issue recurrence.
5 tips to reduce unplanned downtime with APM
1. Leverage event correlation for faster incident triage
Modern applications generate an overwhelming volume of telemetry data. Isolating meaningful signals from the noise during an incident is a challenge without event correlation. APM tools that offer event correlation group related logs, metrics, and traces across services and timeframes, creating a unified incident timeline.
For example, a sudden spike in database latency, an increase in error rates in the API layer, and an out of memory alert from the container orchestrator can all stem from a single root issue like a bad deployment or traffic spike. Correlation engines use context (e.g., tags, transaction IDs, and time windows) to stitch these together, accelerating root cause analysis (RCA) and reducing alert fatigue.
2. Detect anomalies early with AI-powered alerting
Static thresholds are no longer sufficient for modern, elastic applications. What’s normal for one service during peak hours may be anomalous during off-hours. APM platforms with statistical or ML-based anomaly detection can flag deviations in behavior patterns in real time.
AI-driven alerting models establish dynamic baselines that adapt to seasonality, usage patterns, and architectural changes. For instance, if a queue processing time typically spikes on Monday mornings, the anomaly detection layer will account for this and avoid false positives. Dynamic ML alerts drastically reduce noise while ensuring that genuine anomalies are escalated to the right teams at the right times, improving the mean time to acknowledge.

3. Enable deep RCA with trace and log convergence
RCA shouldn’t require switching across dashboards or manually correlating trace IDs. Modern APM solutions integrate tracing, logging, and infrastructure telemetry on a single pane of glass. This convergence allows you to:
- Visualize latency bottlenecks in service dependency graphs.
- Jump from a failed transaction trace to the corresponding logs.
- Map infrastructure changes to performance regressions.
By capturing granular transaction metadata (e.g., payloads and stack traces), an APM solution enables developers and site reliability engineers (SREs) to pinpoint the exact source of failure, whether it’s a broken database index, a misconfigured load balancer, or a recent code commit.

4. Continuously detect and resolve issues before escalation
The ultimate goal of observability is not just to respond faster but to predict and prevent issues. APM platforms equipped with predictive analytics and health score modeling can identify early warning signs, like memory thrashing, thread pool exhaustion, or degraded third-party services, before they evolve into full-blown outages.
These insights power automated remediation workflows, such as adjusting thread pool sizes, dynamically tuning memory management parameters, or purging overloaded caches. With continuous detection in place, teams can implement self-healing mechanisms and reduce the dependency on manual intervention.

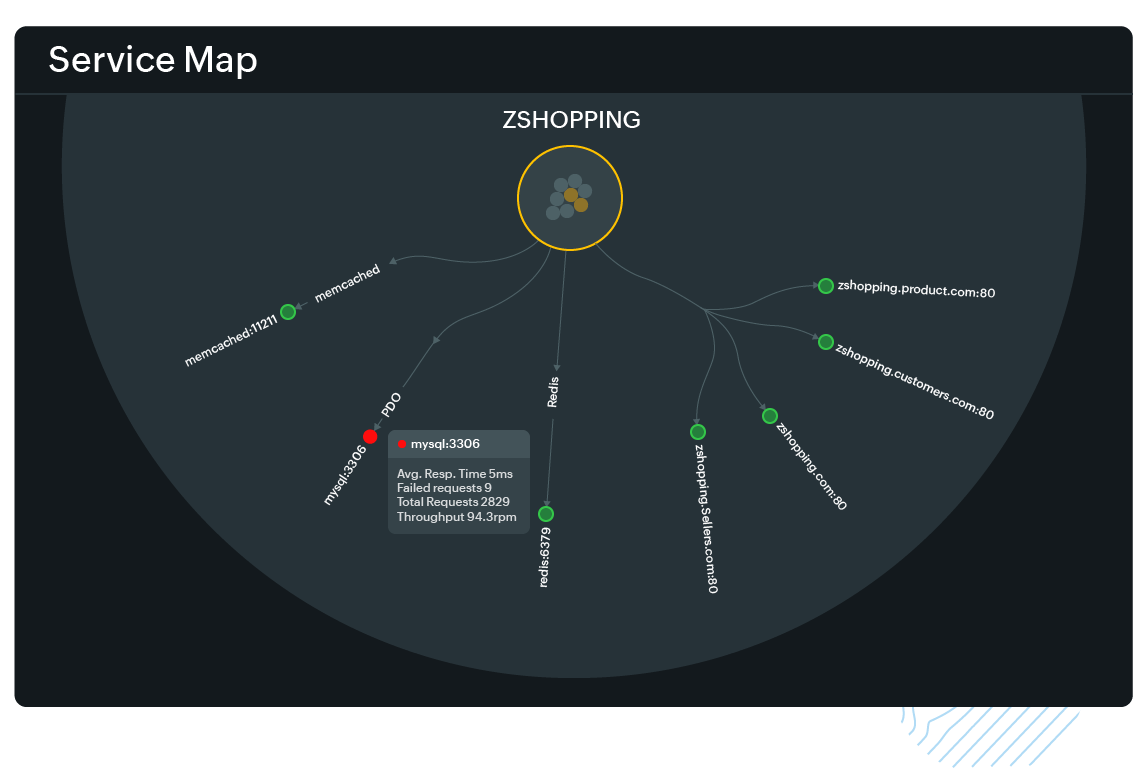
5. Visualize service dependencies with dynamic service maps
In distributed systems, understanding the relationships and dependencies between services is critical to reducing unplanned downtime. APM platforms that offer dynamic service maps provide real-time visual topologies of your entire application architecture, including microservices, databases, external APIs, and infrastructure layers.
These visualizations help teams trace failure propagation across services, identify which components are on the critical path, and determine which upstream or downstream services are being impacted. During an incident, service maps enable quicker triage by highlighting where anomalies originate and how they ripple through the system. This leads to faster containment, better prioritization of alerts, and more informed decision-making during incident response.
Building resilient systems with APM
Reducing unplanned downtime requires a shift from reactive firefighting to proactive observability. With Site24x7's APM Insight, organizations gain the data-driven intelligence needed to predict, prevent, and resolve incidents faster. By combining advanced techniques like event correlation, AI-driven anomaly detection, and unified RCA, APM Insight empowers DevOps and SRE teams to build resilient applications. Implementing APM for your application should be viewed as an investment and not as a cost; it’s about delivering seamless, performant, reliable digital experiences, no matter how complex the system architecture may be.