Apache Cassandra and Redis are two prominent NoSQL databases, each designed to address specific application needs. Many applications rely on these databases for seamless scalability and lightning-fast data access. However, performance bottlenecks such as slow queries, replication lag, memory saturation, and inefficient resource utilization can severely impact your application's speed, responsiveness, and availability. These issues often lead to increased latency, reduced throughput, and even system outages.
Identifying and addressing these performance issues is crucial to maintaining optimal application performance. Key metrics like latency, throughput, and error rate can be measured and monitored to detect potential issues early. This is where application performance monitoring (APM) comes into play. APM provides real-time visibility into the health of applications, detects inefficiencies, and helps teams proactively resolve issues before they impact end users.
In this blog, we will learn how, by leveraging APM, teams can gain insights into database issues based on the application performance metrics, identify potential bottlenecks, and take proactive measures to optimize operations.
Cassandra vs. Redis: Understanding the key differences for effective monitoring
Apache Cassandra and Redis are both NoSQL databases, but they differ fundamentally in architecture and data handling. Cassandra follows a peer-to-peer distributed model designed for high availability and scalability, whereas Redis operates as an in-memory key-value store optimized for ultra-low latency.
| Feature | Cassandra | Redis |
|---|---|---|
| Type | Distributed NoSQL database | In-memory data structure store |
| Primary strength | High write throughput, scalability, and fault tolerance | Ultra-fast response times, real-time data processing |
| Data storage | Stores large volumes of structured data across multiple nodes | Stores frequently accessed data in RAM |
| Scalability | Horizontally scalable with automatic data distribution across nodes | Scales well but is limited by available memory |
| Performance | Optimized for high availability and durability | Optimized for low-latency operations in microseconds |
| Ideal for | Write-intensive, large-scale applications needing high availability | Read-heavy workloads requiring real-time access |
| Use cases | Big data applications, persistent storage, multi-data center deployments | Caching, real-time analytics, message queues |
Why do we need to monitor the performance of applications using Cassandra or Redis?
By continuously monitoring database interactions, APM helps prevent downtime, optimize query execution, and improve system efficiency contributing to effective database performance optimization.
Monitoring the performance of applications using Cassandra or Redis is essential to ensure reliability, efficiency, and optimal resource utilization. Without proper monitoring, diagnosing and resolving performance issues can be time-consuming and complex.
Cassandra performance challenges: Disk I/O bottlenecks, inefficient compaction, replication lag, and slow queries.
Redis Performance Challenges: Memory saturation, CPU-intensive commands, and connection limits.
APM Tools help by:
- Providing real-time visibility into application and database performance
- Detecting anomalies, such as slow queries and failed database calls
- Tracking key performance metrics (Apdex score, throughput, error rates, etc.)
- Sending proactive alerts to prevent potential failures
By continuously monitoring database interactions, APM ensures reduced downtime, optimizes query execution, and improves system efficiency, contributing to effective database performance optimization.
Monitoring Cassandra with APM
Cassandra, which is ideal for handling massive datasets with high write throughput, can suffer from slow queries and inconsistent read performance due to replication lag.
Identify slow queries and minimize latency
Bottleneck: A high read/write latency can occur due to inefficient contextual query language (CQL) queries, such as full-table scans or unoptimized secondary indexes.
APM solution:
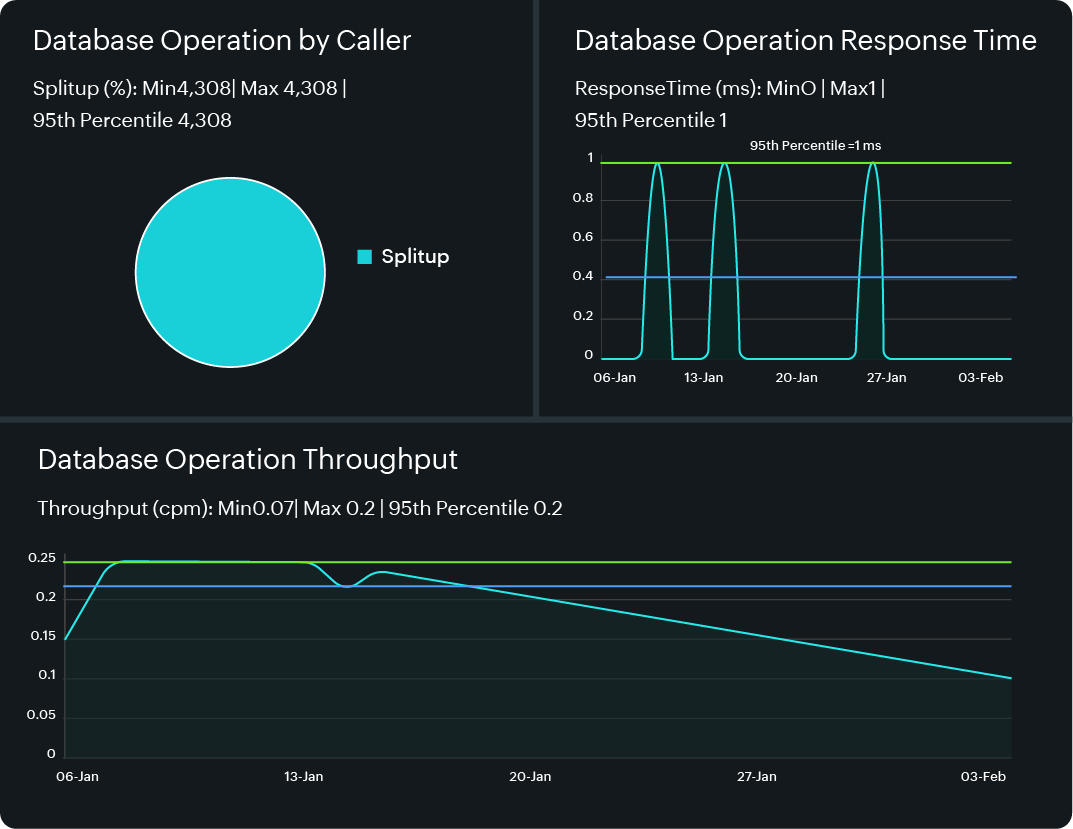
- Query execution time tracking: Site24x7 APM identifies slow CQL queries by monitoring the query execution time. This metric allows you to monitor the time taken by each CQL query to complete, thereby identifying slow-running queries. You can further set thresholds, allowing Site24x7 to alert you whenever queries exceed the defined limits.
- Throughput analysis: Helps track the number of queries executed over a period, so you can correlate high throughput with performance issues.
- Actionable insights: You can analyze these queries through transaction tracing to determine which queries are consuming the most time and optimize them.


Ensure data consistency and reduce replication lag issues
Bottleneck: A high replication lag can cause outdated or inconsistent data in replicas. Also, when applications use customizable consistency levels, it increases the complexity of ensuring data consistency across nodes. This can lead to slow reads or data inconsistencies, impacting application performance.
APM Solution:
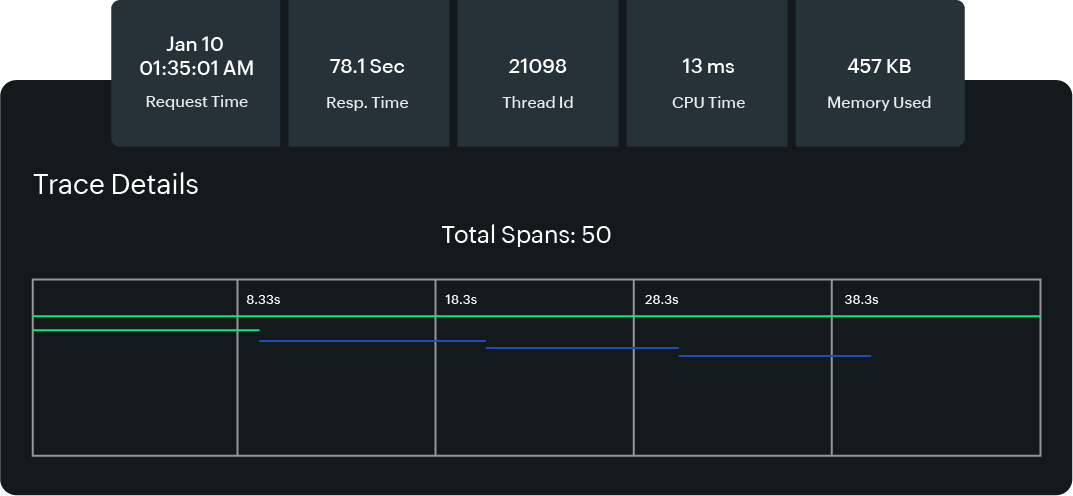
- Distributed tracing: It can help monitor the flow of requests across multiple services or nodes, identifying any delays or issues at specific points. It tracks the overall latency and bottlenecks in a system as request flows across multiple microservices, databases, and other components.
- Monitor replication lag: Site24x7's Cassandra plugin provides insights into metrics such as total latency (read and write), throughput, and pending tasks; monitoring these metrics can help identify potential replication issues.
- Alerts and thresholds: Site24x7 allows users to configure alerts for various metrics. By setting thresholds for metrics like latency or pending tasks, users can receive proactive notifications about potential performance issues.

Monitoring Redis with APM
Redis, an in-memory data store, is perfect for real-time applications but can experience memory pressure, high CPU usage from expensive commands, and connection saturation under heavy loads.
Identify slow transactions causing high latency
Bottleneck: Memory pressure from large datasets, expensive commands like KEYS, and HGETALL leading to CPU spikes and latency.
APM Features:
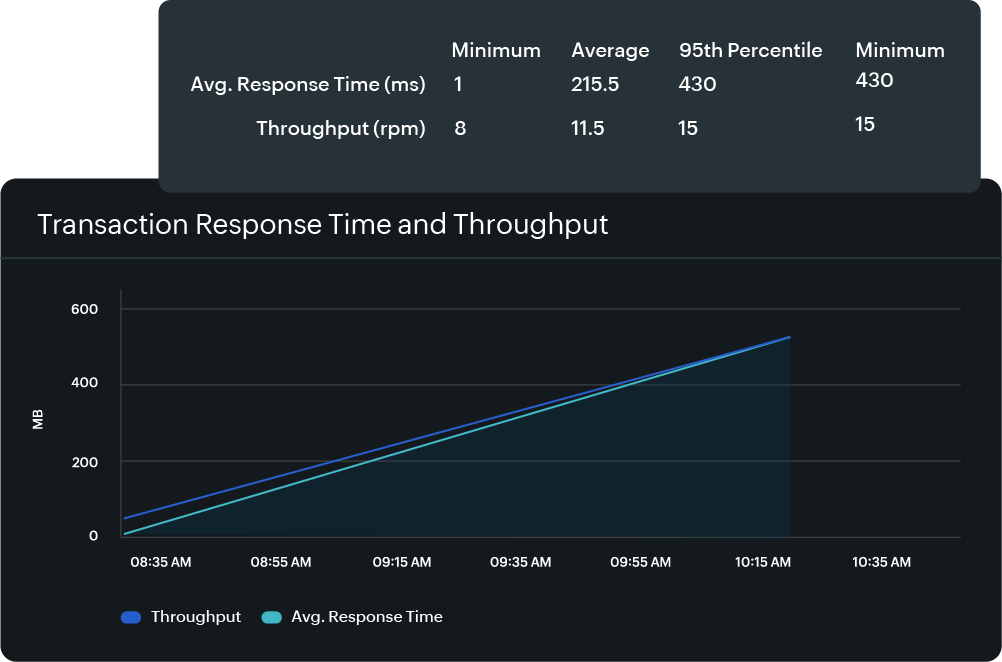
- Response time monitoring: Monitors the response times of Redis commands, identifying slow operations that may be causing latency.
- Transaction tracing: Tracks the entire flow of requests, from the Redis client to the server, to detect slow response times and pinpoint specific commands that are causing delays.
- Optimize memory usage: Using the out of the box memory metrics from the Site24x7 Redis plugin, monitor memory pressure on Redis instances. This includes checking for frequent cache evictions or memory spikes, which may indicate poor memory usage patterns.
Address imbalances due to underutilized replicas
Bottleneck: If certain Redis instances handle more traffic than others due to underutilized replicas, it can lead to performance degradation, resource exhaustion, and slower response times.
APM Solution: Site24x7's APM Insight includes features like Application Dependency Maps, which offer a complete overview of your application infrastructure and its connections to other dependent resources. This helps in analyzing traffic distribution across Redis instances to ensure balanced load.

Comprehensive database call analytics for Cassandra and Redis
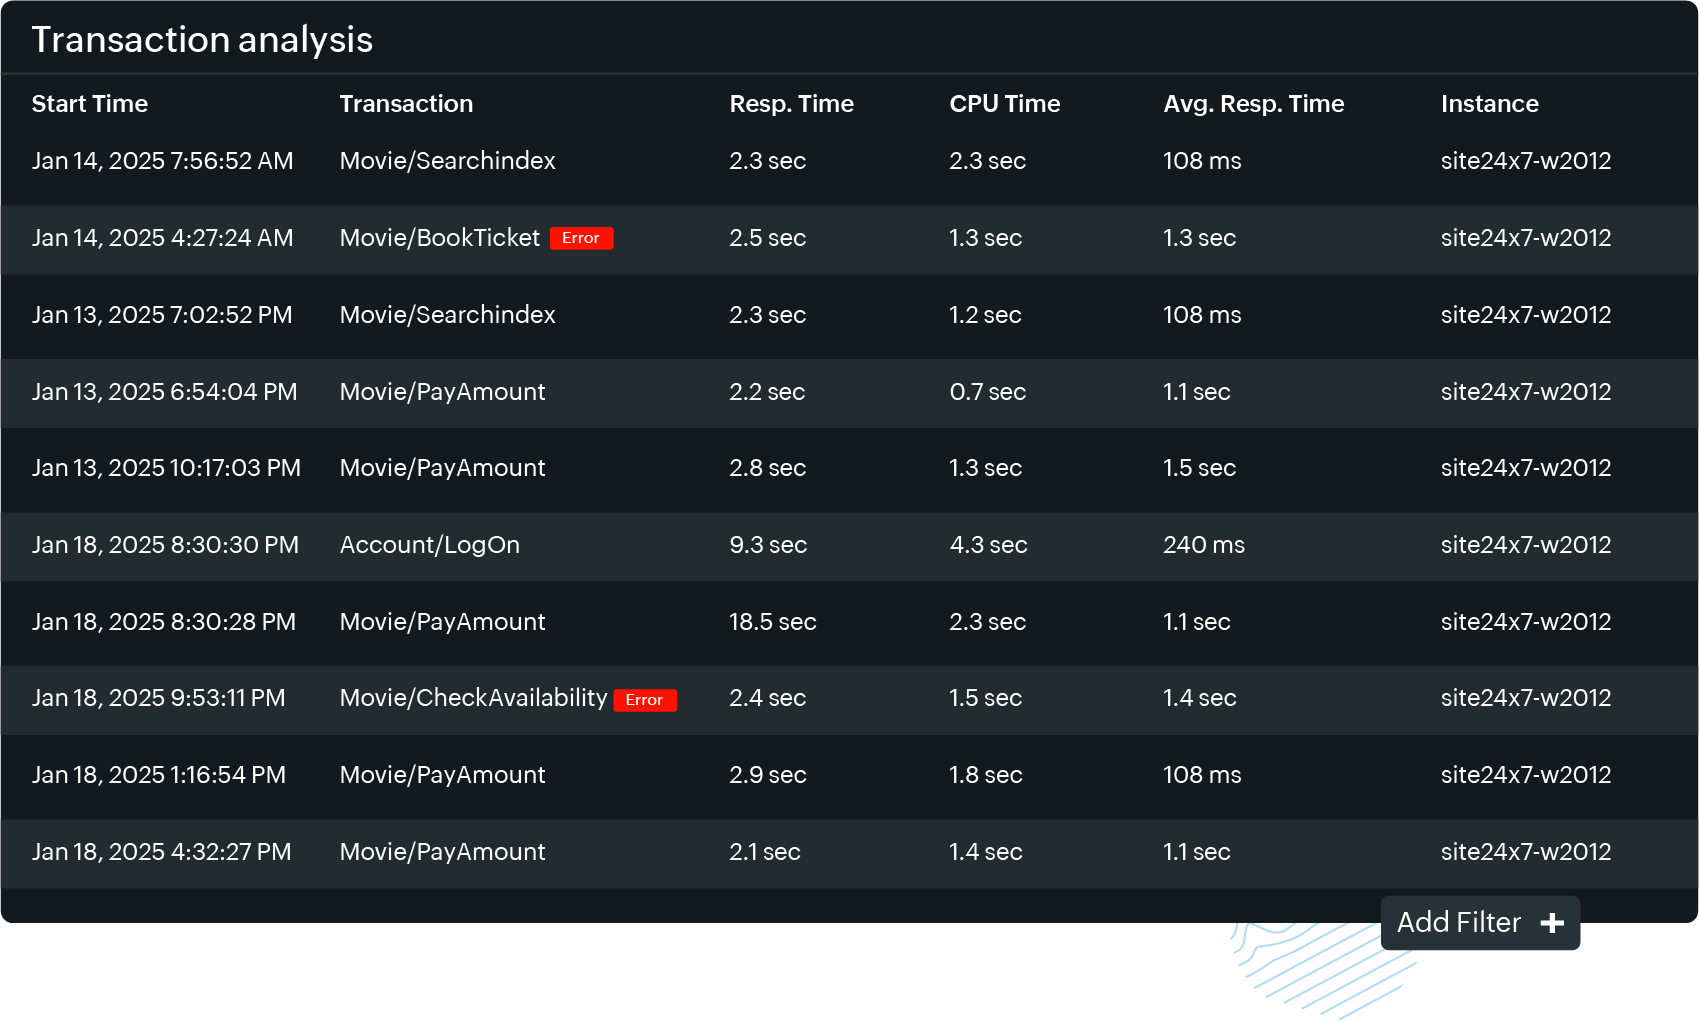
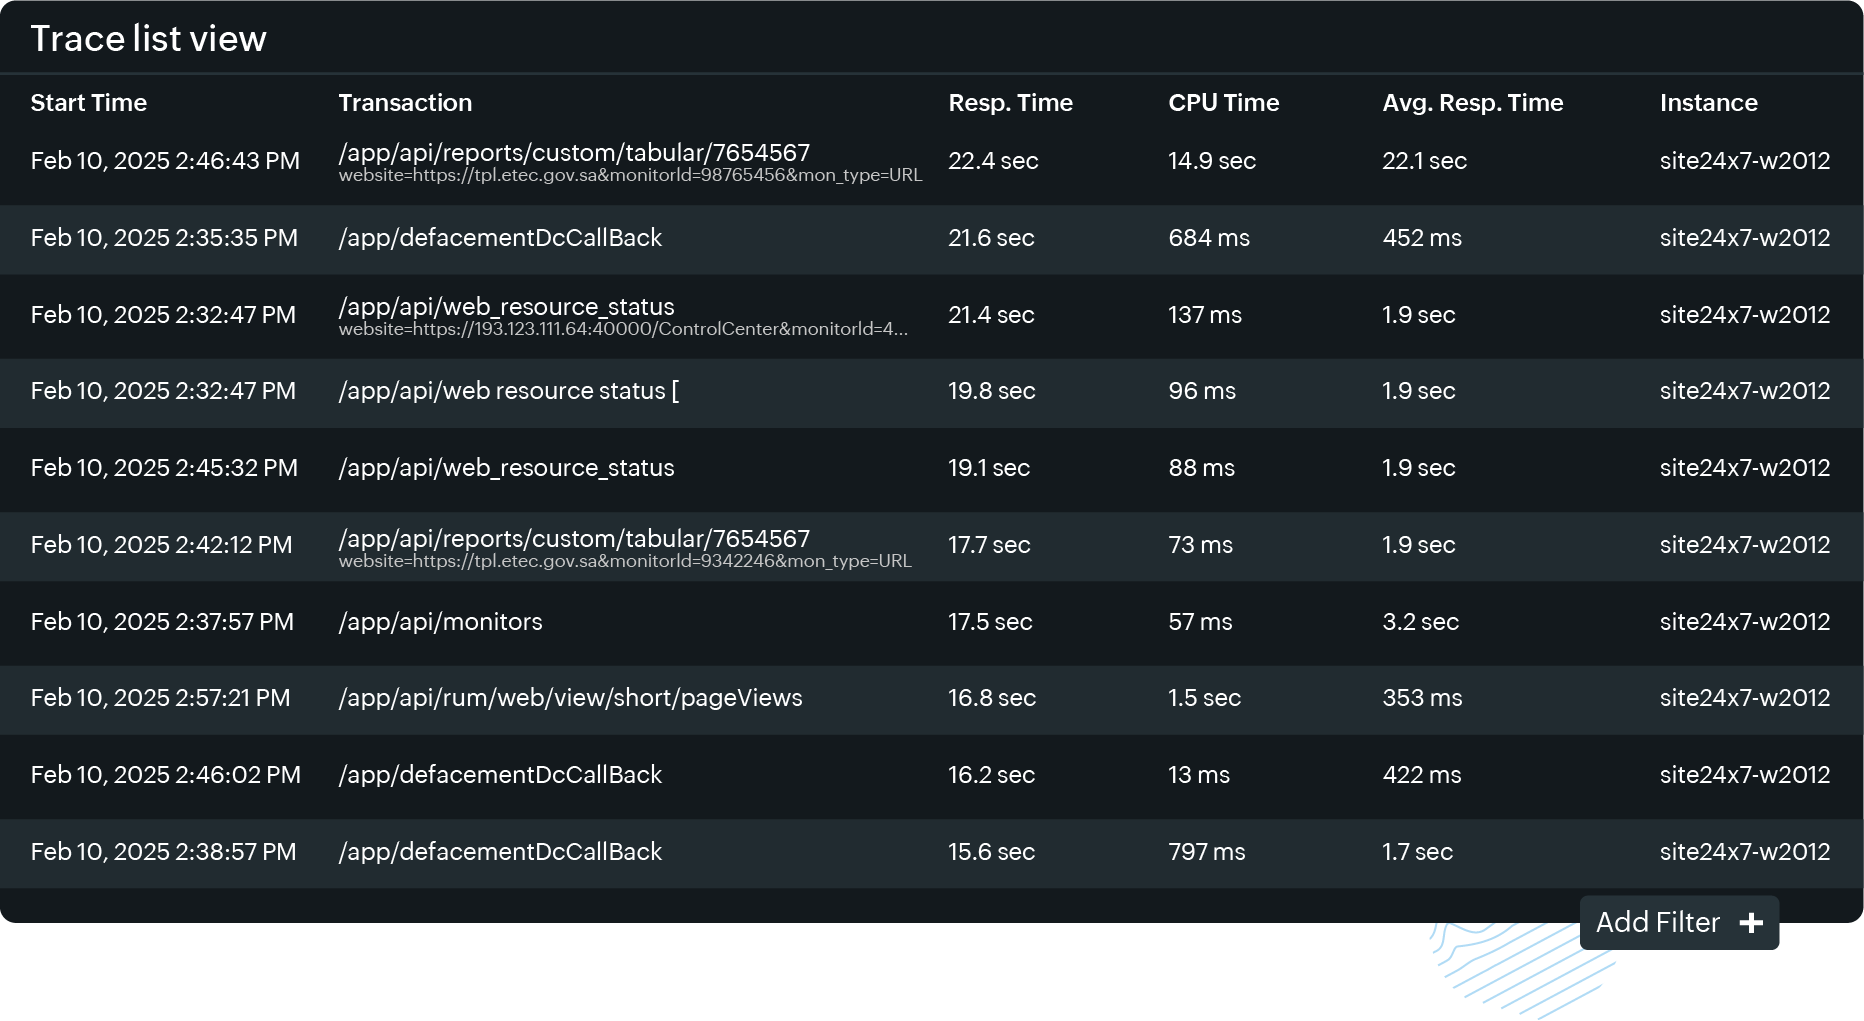
Get a bird's-eye view of Apache Cassandra and Redis calls in the trace list view and database view of Site24x7's APM tool. It provides a comprehensive and real-time visualization of all database interactions, where a user can quickly identify and take appropriate action on rogue calls, anomalies, and performance bottlenecks, such as:
- Slow queries: Identify and optimize slow-running queries that are impacting application performance.
- Failed calls: Detect and troubleshoot failed calls to prevent data loss and ensure data consistency.
- Inefficient data retrieval: Optimize data retrieval patterns to reduce latency and improve overall system performance
- Resource-intensive operations: Identify and optimize resource-intensive operations, such as large data transfers or complex queries, to prevent resource exhaustion and ensure smooth system operation
With this enhanced visibility, users can:
- Filter and sort calls by various criteria, such as call type, response time, and error rate, to quickly identify trends and patterns.
- Take corrective action, such as optimizing queries, adjusting configuration settings, or scaling resources, to improve overall system performance and reliability.
By providing a unified and intuitive view of Apache Cassandra and Redis calls, this feature enables users to proactively monitor, optimize, and troubleshoot their database interactions, ensuring optimal performance, reliability, and scalability of their applications.
Start monitoring your applications using Cassandra or Redis with Site24x7
Site24x7 APM provides a powerful suite of monitoring tools to ensure the optimal performance of Cassandra and Redis databases. By leveraging features like query execution time, transaction tracing, throughput analysis, infrastructure metrics,along with dedicated plugins for Cassandra and Redis—you can proactively identify and address performance bottlenecks in your databases. Stay ahead of potential issues and ensure seamless application performance and high availability with Site24x7.
Start your free trial today and optimize your database performance with Site24x7!