Web servers are essential elements that are in charge of providing web content online. They perform tasks such as handling requests, managing connections, and maintaining security, making them fundamental components of the internet infrastructure. Well-known web servers include Microsoft Internet Information Services (IIS), Apache HTTP Server, NGINX, and Apache Tomcat. This article will specifically discuss the IIS web server.
Frequent failures, slow webpages, and unexpected delays in response times may indicate potential performance issues with web applications hosted in your IIS web server. By analyzing metrics, traces, and logs together, you can identify problems, optimize performance, and enhance the user experience. Metrics provide performance data for troubleshooting, traces reveal the request and response flow for a better understanding of server behavior, and logs offer comprehensive visibility into your IIS infrastructure to ensure a seamless web application experience for users.
The primary focus of this article will be on the analysis of IIS logs, providing an overview of the key components of metrics and traces for an IIS server.
Understanding IIS logs
IIS is a native web server for hosting websites on Windows platforms while incorporating multiple components to manage requests efficiently.
With Site24x7, you can monitor different types of IIS logs, including:
-

IIS access logs: Capture various aspects of web application access, such as user visits, client IP addresses, browser information, response times, and status codes.
-
IIS error logs: Capture information about server errors and issues encountered during operation.
-
Windows event logs: Provide a detailed overview of system-wide events and activities, including events specific to the IIS server, such as service startup, configuration modifications, application pool recycling, and auditing.
Challenges in log analysis
Managing and monitoring logs for IIS, or any logs in general, can be quite challenging.
Some challenges include:
-
Storing a high volume of log data without overwhelming storage resources.
-
Sorting and sifting through millions of log lines to facilitate easy retrieval and analysis.
-
Aggregating logs from multiple servers and sources into a centralized platform for unified management.
-
Deciphering and extracting relevant information from diverse log formats.
-
Identifying and correlating related log entries across different sources to gain insights.
-
Ensuring scalability to handle increasing data and infrastructure demands.
-
Troubleshooting by quickly accessing and analyzing relevant log data to reduce mean time to repair (MTTR).
-
Achieving comprehensive observability across distributed environments.
Monitor and manage logs with ease
A centralized platform is crucial for managing log data. Site24x7's centralized, cloud-based log management solution offers comprehensive monitoring and analysis of IIS logs. It correlates logs and metrics on one platform for improved visibility and insights. With observability, admins can track and troubleshoot issues, optimize performance, and maintain a smooth IIS infrastructure.
Explore IIS server metrics, logs, and traces
Site24x7 can help you achieve efficient management of IIS server metrics, logs, and traces.
Metrics
Our IIS server monitoring solution enables you to monitor the availability and performance of your IIS servers actively. It provides real-time insights into server performance, and timely alerts for potential issues.
To monitor your Microsoft IIS server, log in to the Site24x7 portal, go to Server, add an IIS server, and analyze the resource usage of sites, apps, and application pools to avoid server problems.
Here, you can track key server metrics comprehensively, including:
-
Network statistics
-
Request statistics
-
Connection statistics
-
User statistics
-
Cache memory usage
-
Cache hits
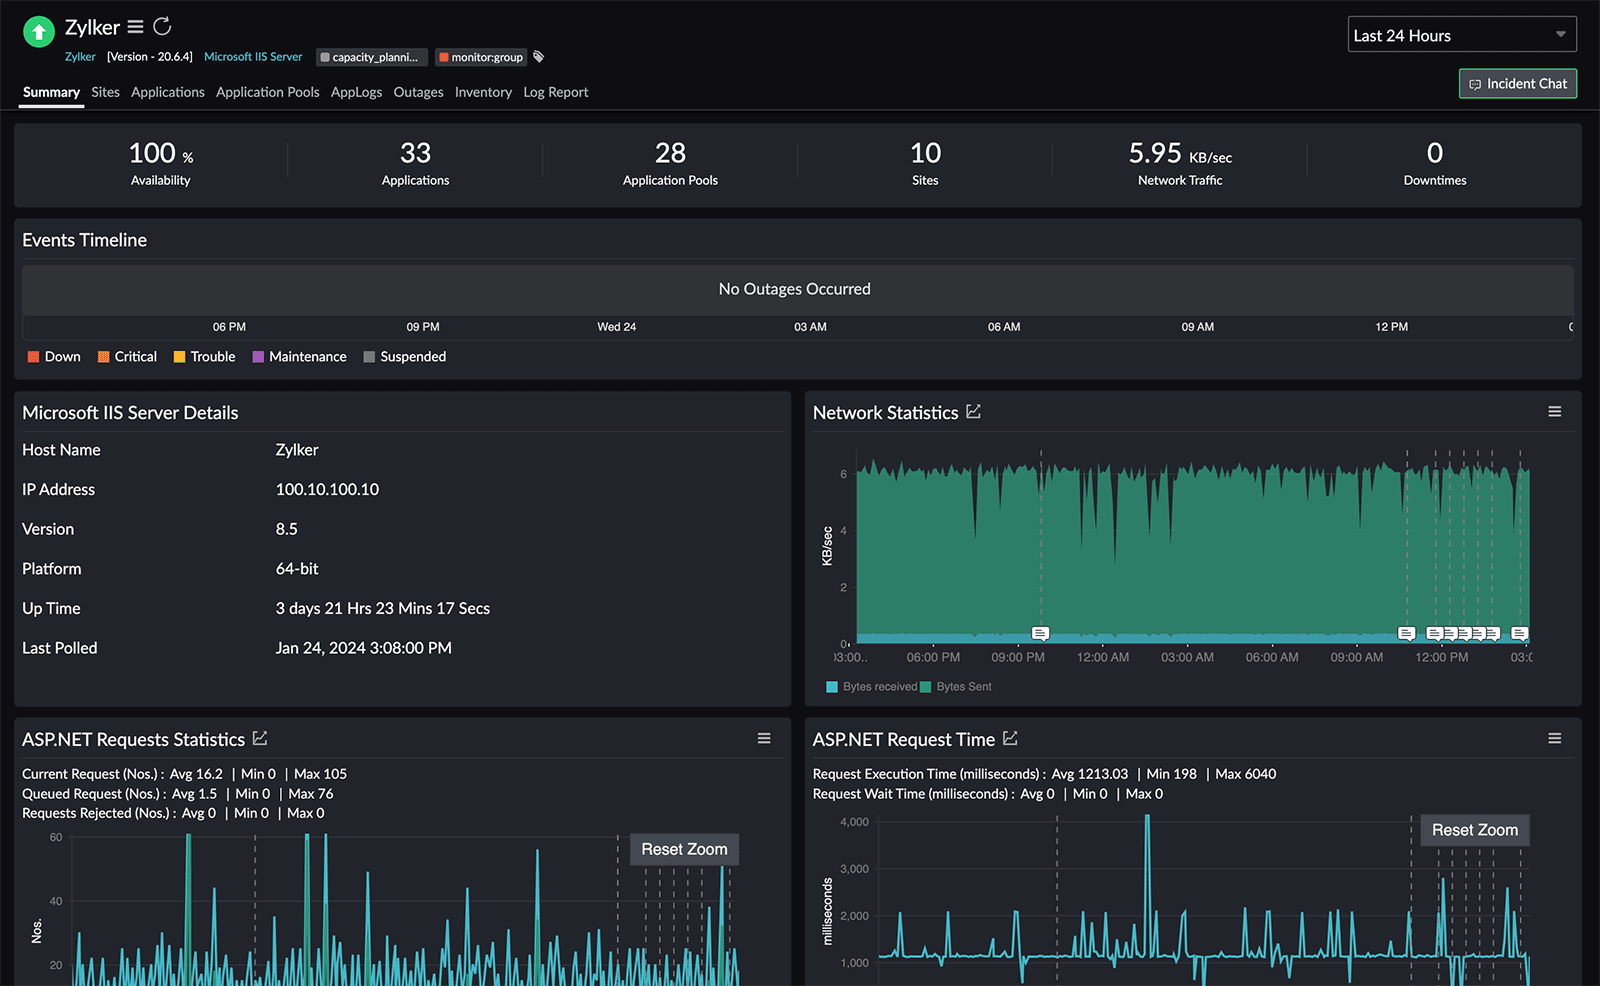 Fig. 1: IIS server monitoring dashboard
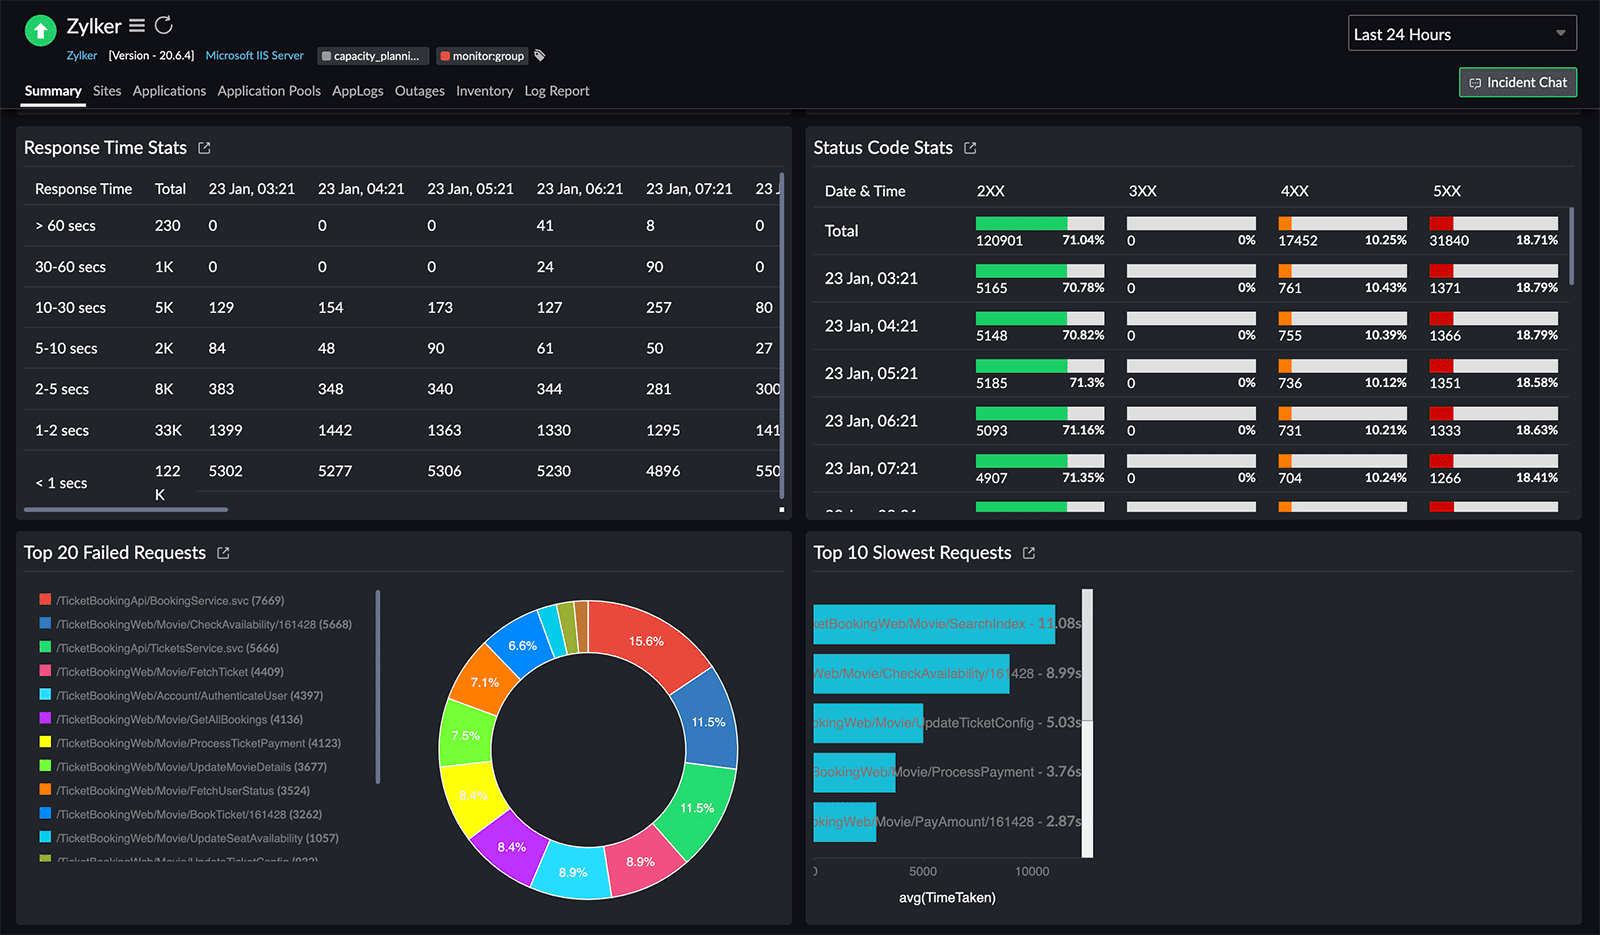 Fig. 2: Log-specific widgets
There are also log-specific widgets included in the IIS server dashboard that show:
-
Response Time Stats
-
Status Code Stats
-
Top 20 Failed Requests
-
Top 10 Slowest Requests
Response Time Stats offer a detailed breakdown and analysis of the time it takes for your web server to respond to incoming requests. This gives you a holistic view of how efficiently your web server handles requests, allowing you to pinpoint areas for improvement. Status Code Stats reveal the distribution of status codes, the Top 20 Failed Requests highlight critical errors, and the Top 10 Slowest Requests pinpoint the transactions causing slowness.
Logs
IIS logs focus on analyzing entries for specific insights. They are used to examine individual requests; errors; and user, server, and application behavior recorded in the logs. This facilitates troubleshooting, identifies patterns, and gathers detailed insights for targeted improvements.
Some common troubleshooting scenarios for IIS access logs include:
- Identifying 500 status code issues through application logs
- Identifying slow requests using application logs
Identifying 500 status code issues through application logs
HTTP status code 500, known as Internal Server Error, signifies that the server encountered an unexpected issue that prevented it from fulfilling the client's request. This generic error lacks specific details about the problem. When a server returns a 500 error, it indicates a server-side problem, possibly caused by misconfigurations, programming errors, or issues with resources. Identifying the root cause requires thorough investigation and troubleshooting.
To investigate the problem further, you can go to the Status Code Stats widget on the IIS server monitoring dashboard (shown in Fig. 2 and displayed in Fig. 3 below) and click the 5XX count that you want to troubleshoot.
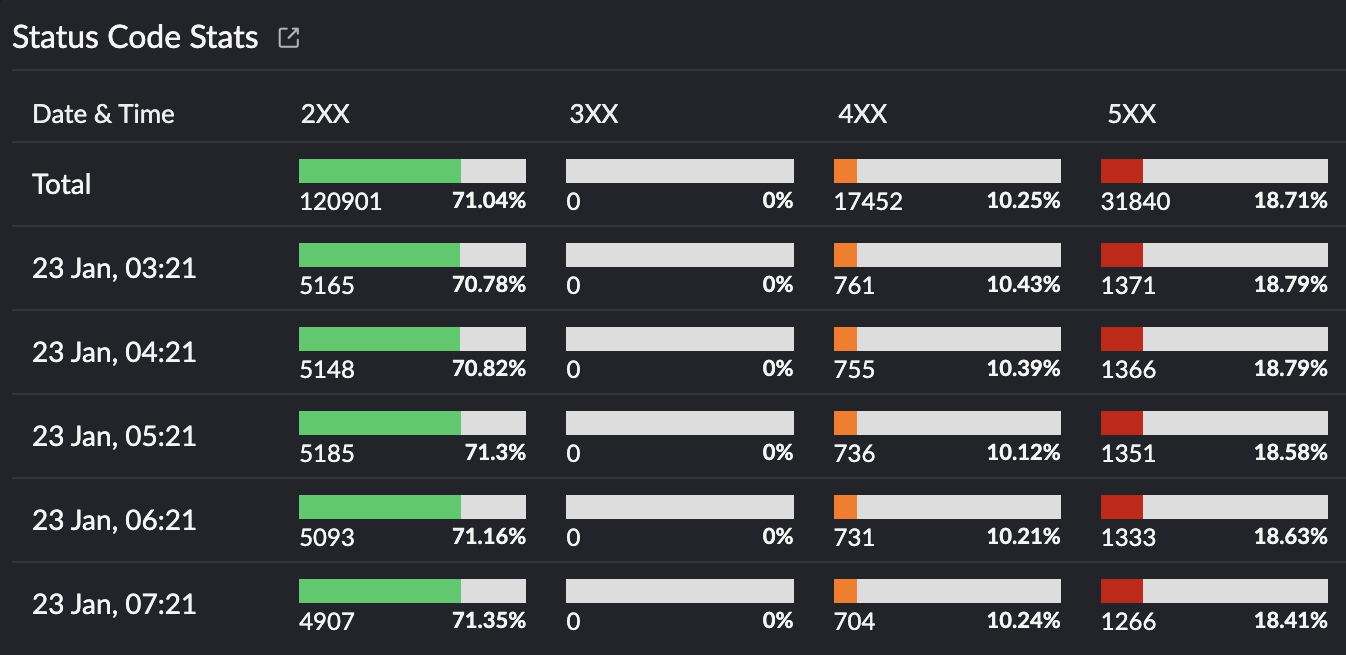 Fig 3: Status code statistics
You'll notice that the URI Check Availability (Fig. 4) has a high number of failures. Analyzing frequent failures in this specific URI can provide important insights into potential issues affecting its performance.
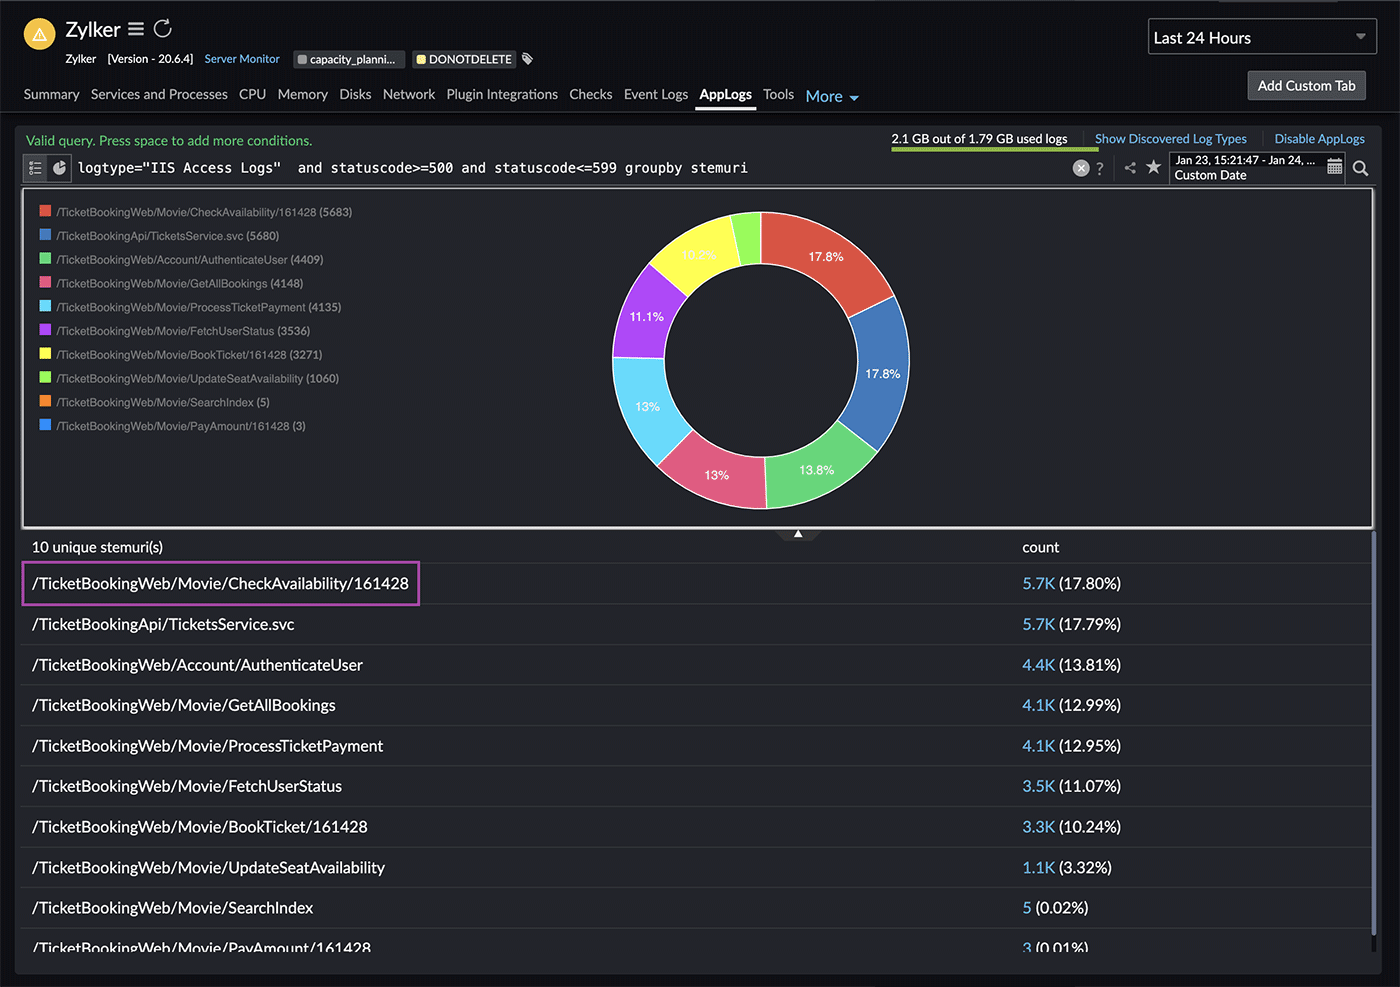 Fig. 4: Number of failures
To delve deeper, click the count of CheckAvailability. This will filter IIS access logs for entries with a status code of either 500 (Internal Server Error) or 599 (Network Connection Timeout Error) and a stem URI of "CheckAvailability."
Troubleshooting real-time application issues often involves comparing logs from different sources. However, this process can be time-consuming and requires opening multiple tabs for each log type and tracing the exact line of an issue. This is where the related log templates feature (Fig. 5) becomes useful, as it allows you to compare multiple fields in one log type with another by creating a template.
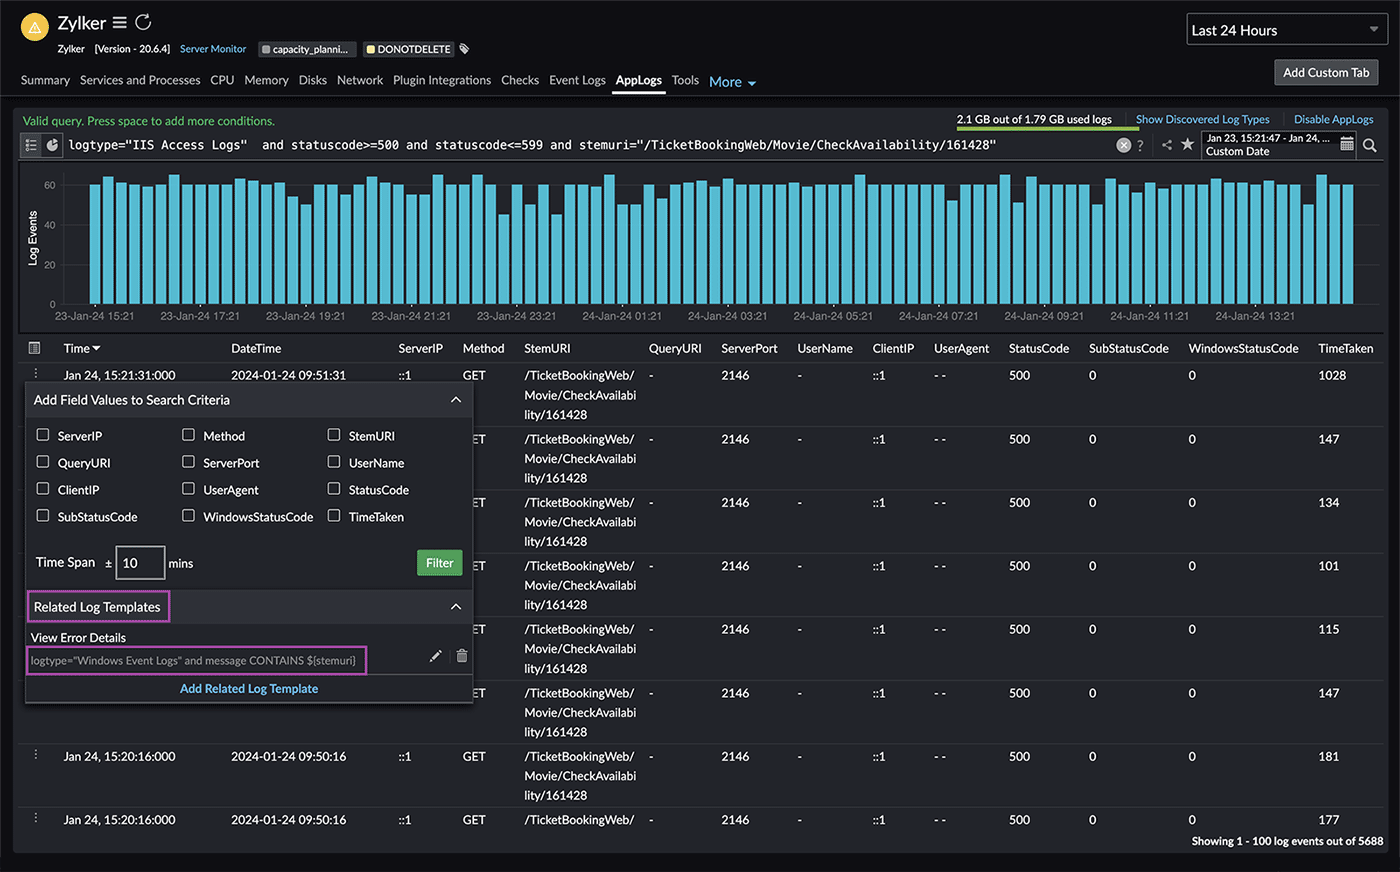 Fig. 5: Related logs
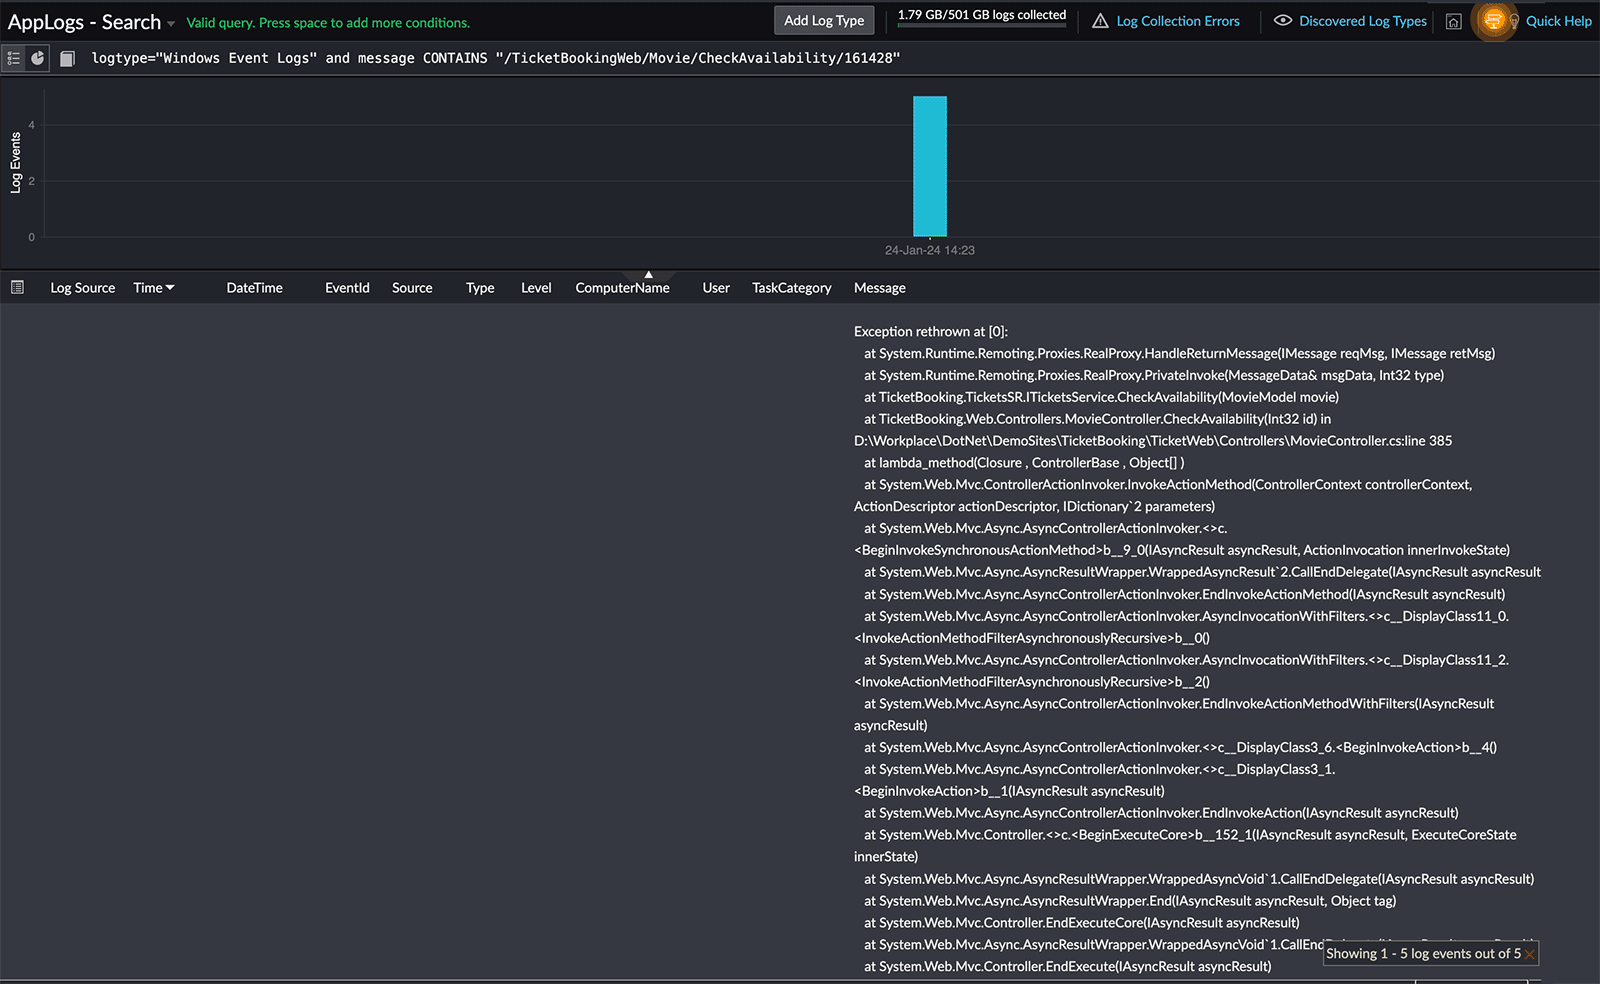 Fig 6: Error details
In this case, you can utilize the Windows event logs (highlighted in Fig. 5) to view the actual exception trace. By clicking the related log template created for Windows event logs, you can view the specific error details (Fig. 6) associated with the 500 status code.
By following these steps, you can effectively use IIS access logs as a valuable resource to diagnose and resolve HTTP 500 errors.
Identifying slow requests using application logs
Our next use case is to troubleshoot slow requests using application logs. Response Time Stats will give you an understanding of how well your transactions are performing, including any areas that may be experiencing slower processing. By analyzing this data, you can identify which request is taking longer to complete.
To do this, you can go to the Response Time Stats widget on the IIS server monitoring dashboard (shown in Fig. 2 and displayed in Fig. 7 below) and click the highest response time that you want to troubleshoot.
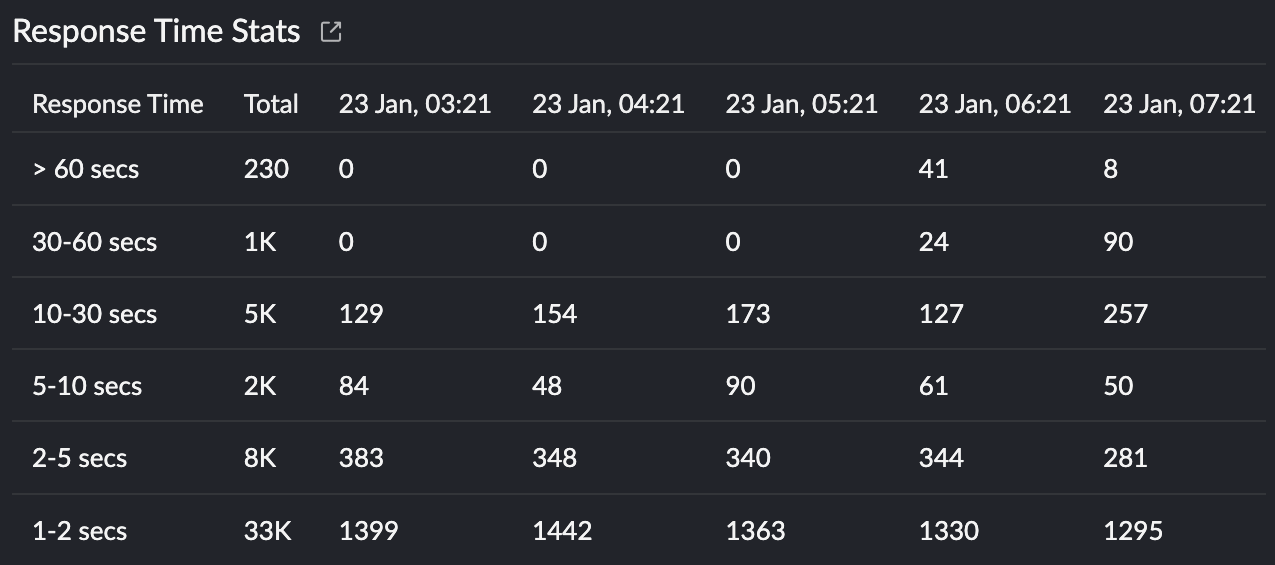 Fig. 7: Response time statistics
In the resultant window, you can use our powerful query language to organize the data, sorting it by average time taken in descending order.
You can also observe that a specific payment processing request (highlighted in Fig. 8) had a longer processing time. Using our application performance monitoring (APM) solution, you can identify the exact details of the trace responsible for this slow payment processing request.
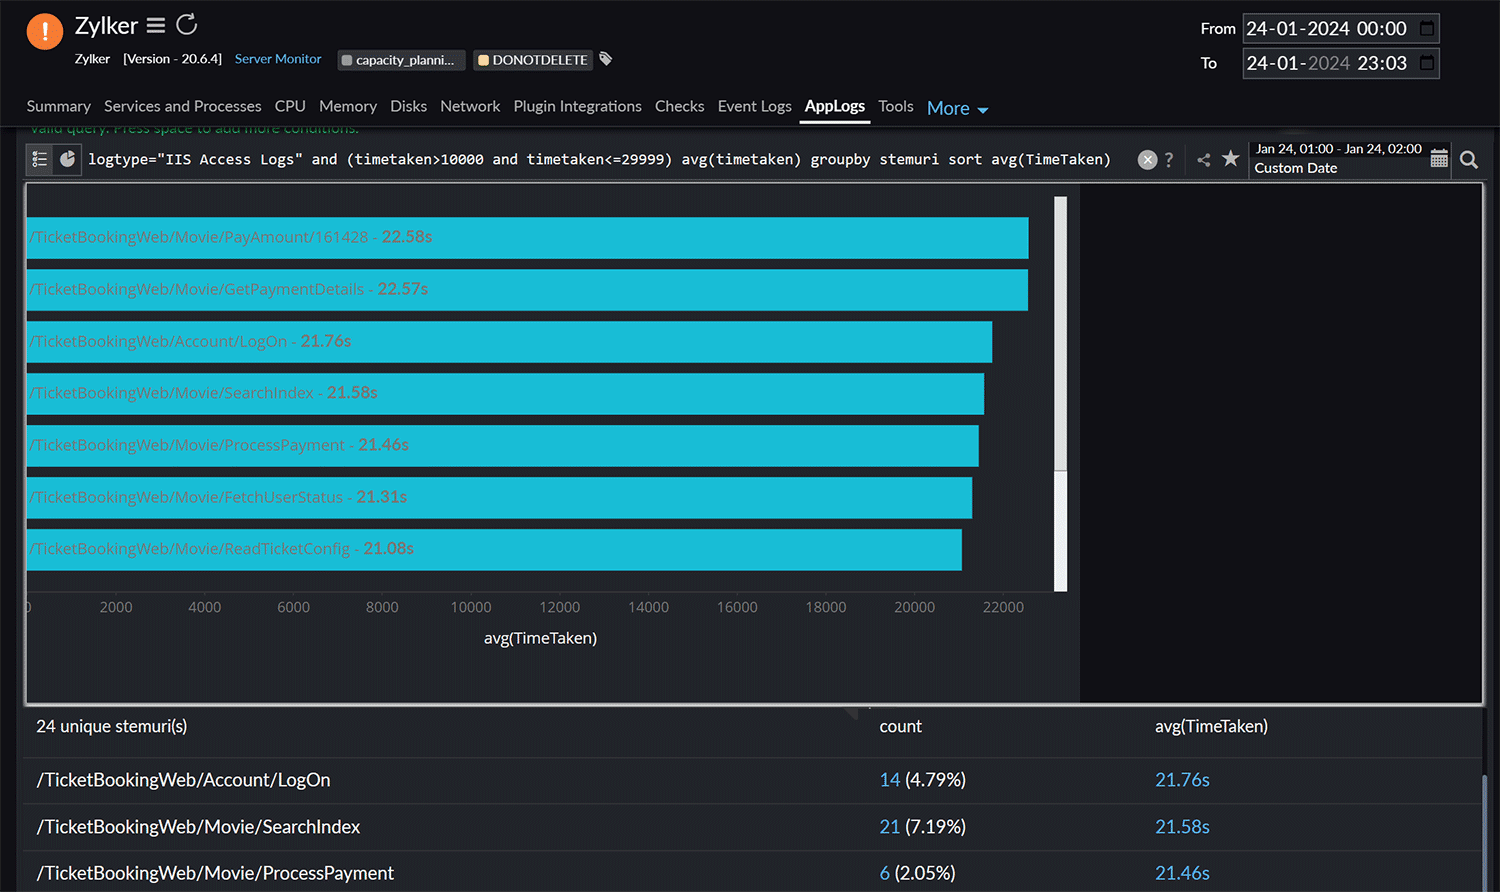 Fig. 8: List of URIs consuming longer processing time
Traces
Our APM solution effectively consolidates access log information and correlates it with component-level data, such as database calls, cache hits, and external HTTP requests. This facilitates the identification of issues and their root causes instantly. Here, you can see an exact trace (highlighted in Fig. 9), the slowest method calls, and their counts. This enables developers to explore these methods for performance corrections and optimizations.
By following these steps, you can effectively utilize IIS access logs and traces to identify and resolve issues related to slowness efficiently.
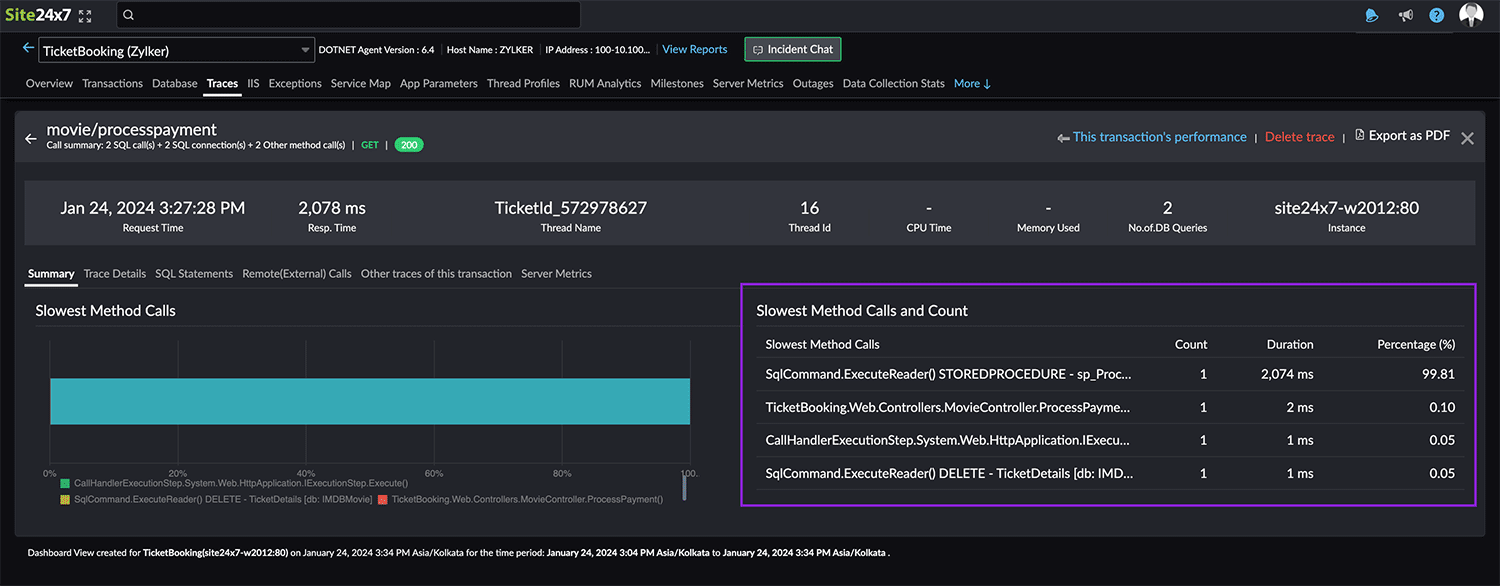 Fig. 9: Application performance trace
Make powerful searches based on query language
Our powerful query language can also be utilized for further analysis of logs.
The query language is a user-friendly search language used for retrieving valuable insights from millions of log entries. It offers a wide range of syntax options, including different operators for numbers and strings.
Below are some helpful queries that can be executed on IIS access logs:
1. Finding a DDoS attack
logtype="IIS Access Logs" and statuscode=400 groupby clientip
If you notice repeated requests from a specific client IP with a status code 400 (Bad Request) in your IIS access logs, it could indicate a potential issue. This status code suggests the server didn't understand the request.
To address this, check the source and examine the client IP responsible for these requests. It could be a misconfigured client or a potential security threat. After analyzing, adjust firewall rules to block or filter traffic from the suspicious IP if needed.
2. Finding the performance (avg, max, min) of your request
logtype="IIS Access Logs" avg(TimeTaken) min(TimeTaken) max(TimeTaken)
You can find the performance of your requests using various aggregation metrics in IIS access logs.
This allows you to calculate the average response time, identify the maximum or minimum response times, and understand the overall distribution of request processing duration.
Using the maximum value of TimeTaken is beneficial as it provides insights into the longest time taken for any individual request, which may not always be reflected by the average response time.
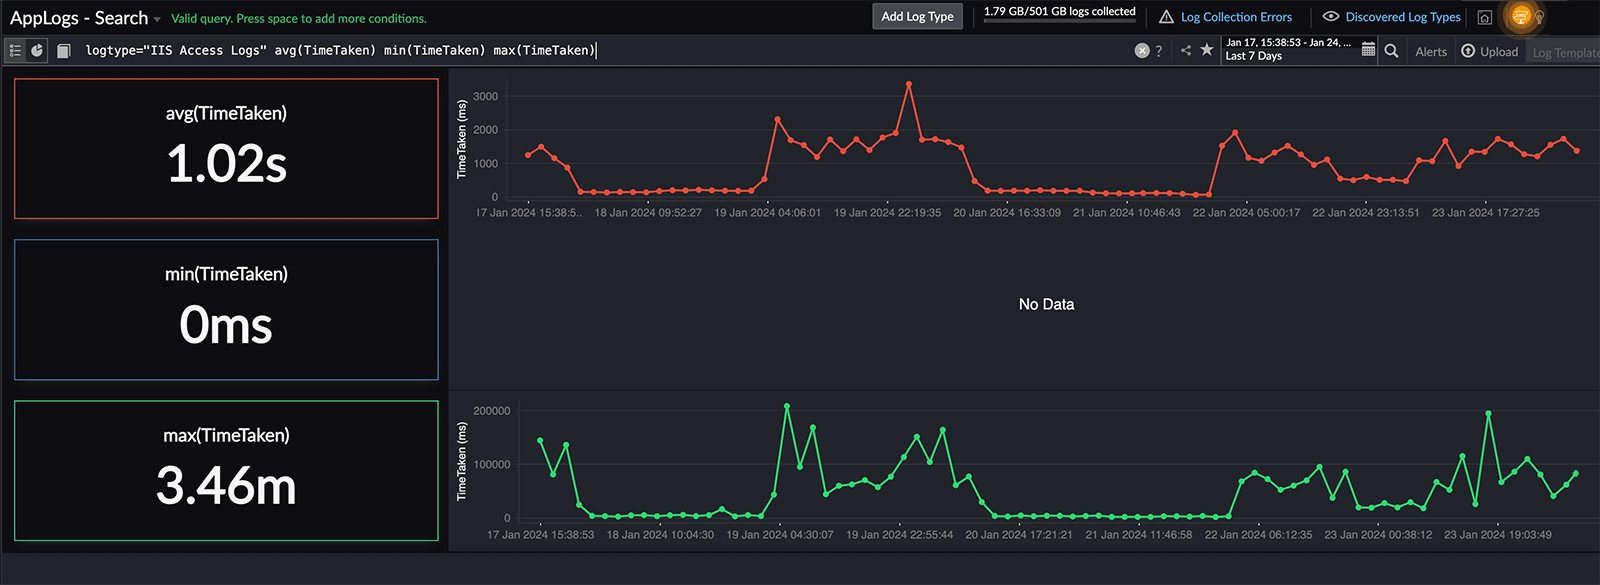 Fig. 10: Performance dashboard
 3. Finding the daily count of failed requests using a timeslice query
logtype="IIS Access Logs" and statuscode=500 timeslice 1d
You can use a timeslice query to determine the frequency of 500 errors on your server. This query breaks down log data into daily intervals and calculates the number of occurrences of the 500 status code each day.
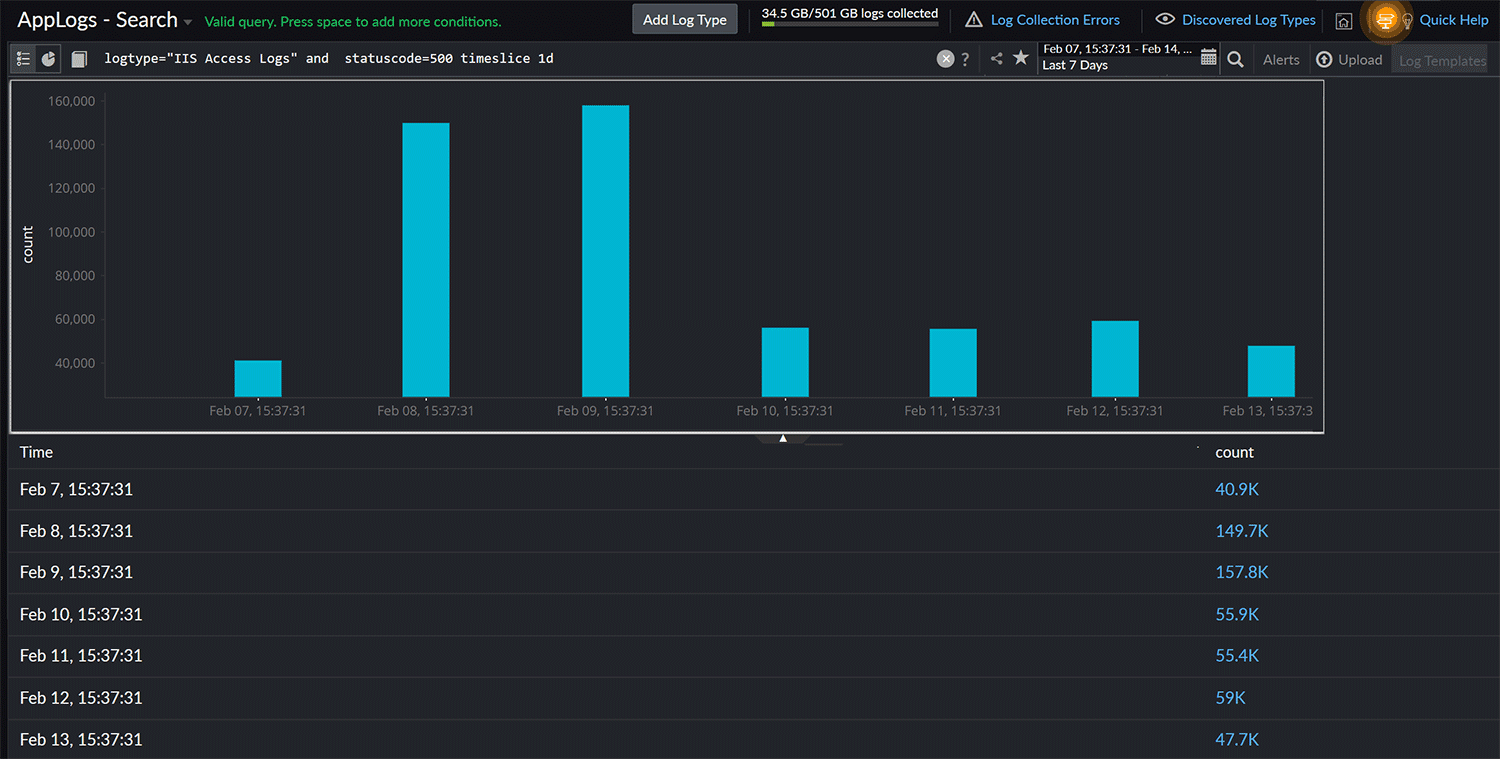 Fig. 11: Daily count of failed requests
 4. Categorizing daily request statuses based on their associated status codes
logtype="IIS Access Logs" groupby statuscode timeslice 1d
You can categorize requests by status code and analyze the data daily to gain insights into how your web server handles user requests each day. For instance, you might spot a sudden increase in the 500 status code on a specific day in the screenshot below, giving you a clear picture of daily request variations.
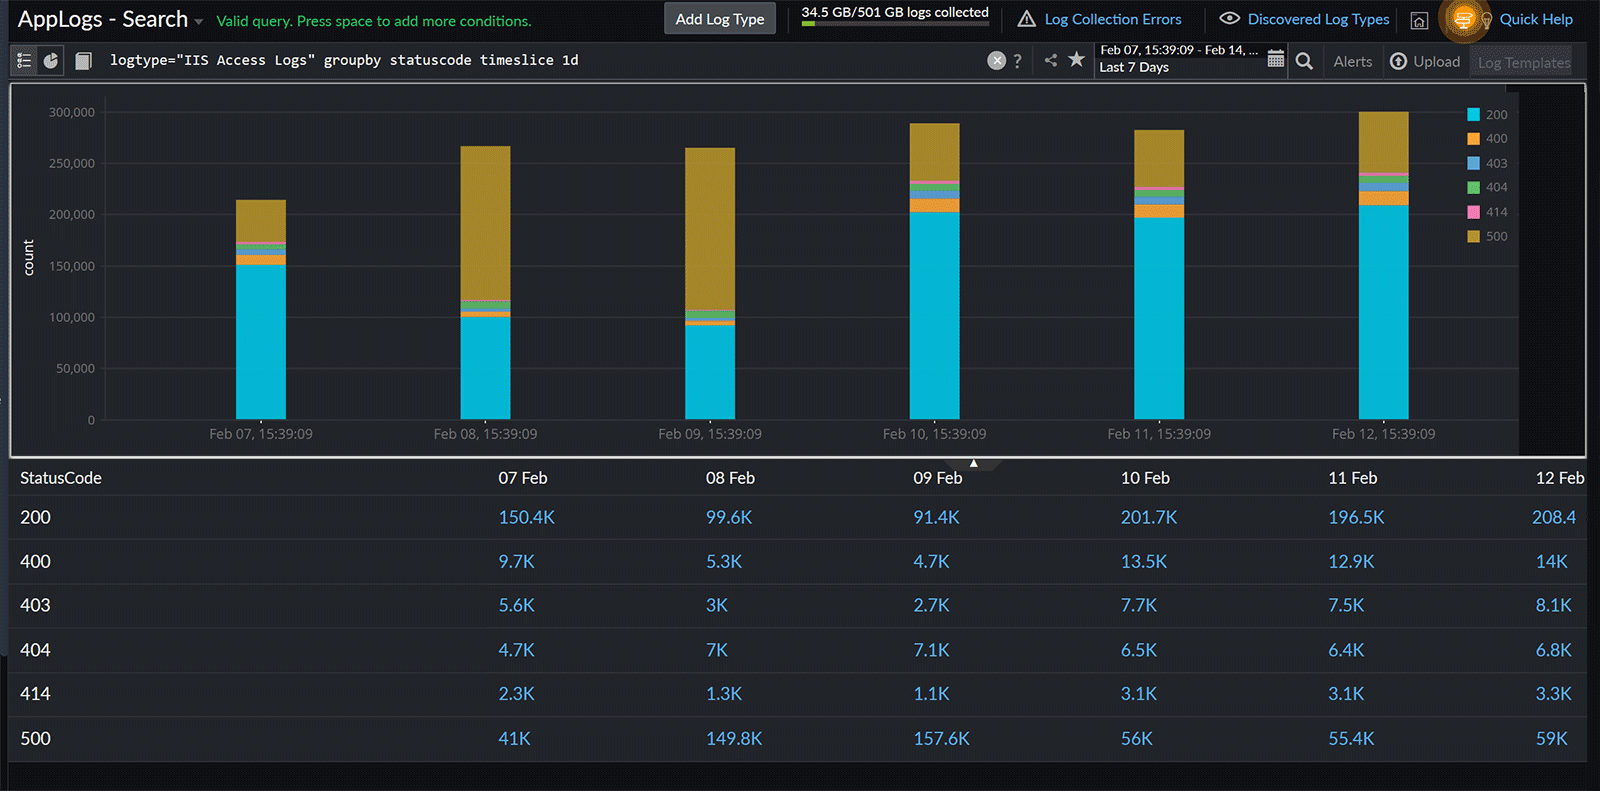 Fig. 12: Daily request status based on status codes
 5. Comparing the total successful request count each day this week with the corresponding days from last week
logtype="IIS Access Logs" and statuscode>=400 count | before 7d
This analysis helps you figure out if there have been any notable changes or trends in the rate of failed requests compared to the previous week. It is useful for identifying patterns, detecting anomalies, and gaining insights into the performance of your web server and user experience.
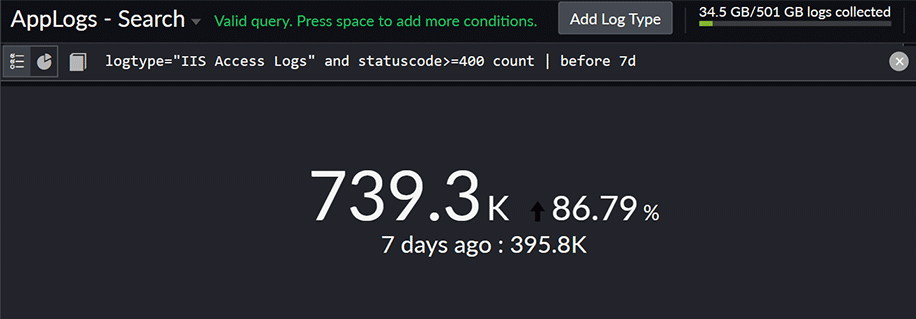 Fig. 13: Comparing the success count
 6. Figuring out the time taken for 95% of the requests in your IIS access logs
logtype="IIS Access Logs" percentile(TimeTaken) percents(95)
The 95th percentile is a statistical measure that indicates the value below which 95% of data falls. In this case, it refers to the TimeTaken values of the requests.
This analysis is crucial for understanding the typical behavior of request processing times. The 95th percentile is often used as a performance indicator. It helps identify outliers and provides a more robust measure than averages, especially in scenarios where a few requests might take significantly longer to process.
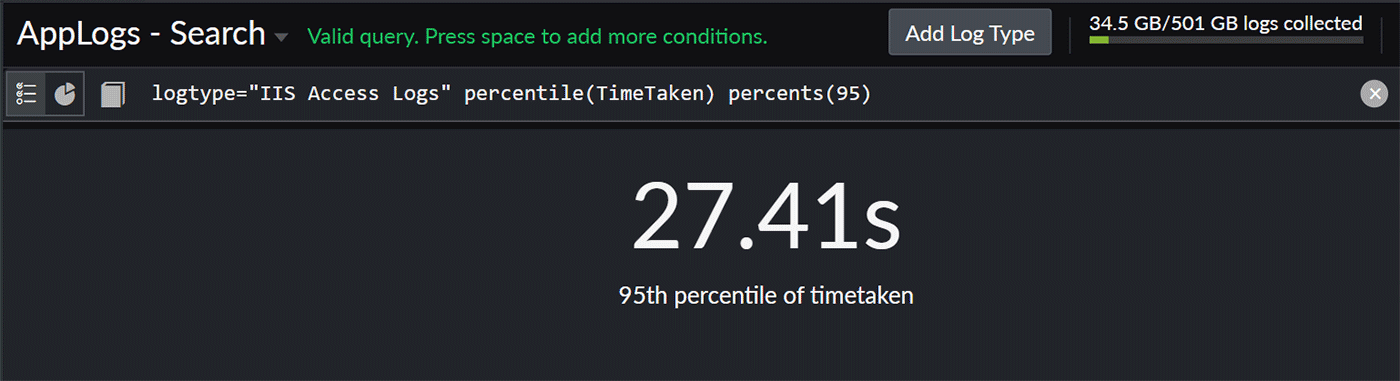 Fig. 14: Time taken for 95% of requests
 You can explore numerous combinations using the query language search.
Robust IIS monitoring with comprehensive log analysis creates an efficient and secure environment that can significantly benefit your IT operations.
Get started with Site24x7
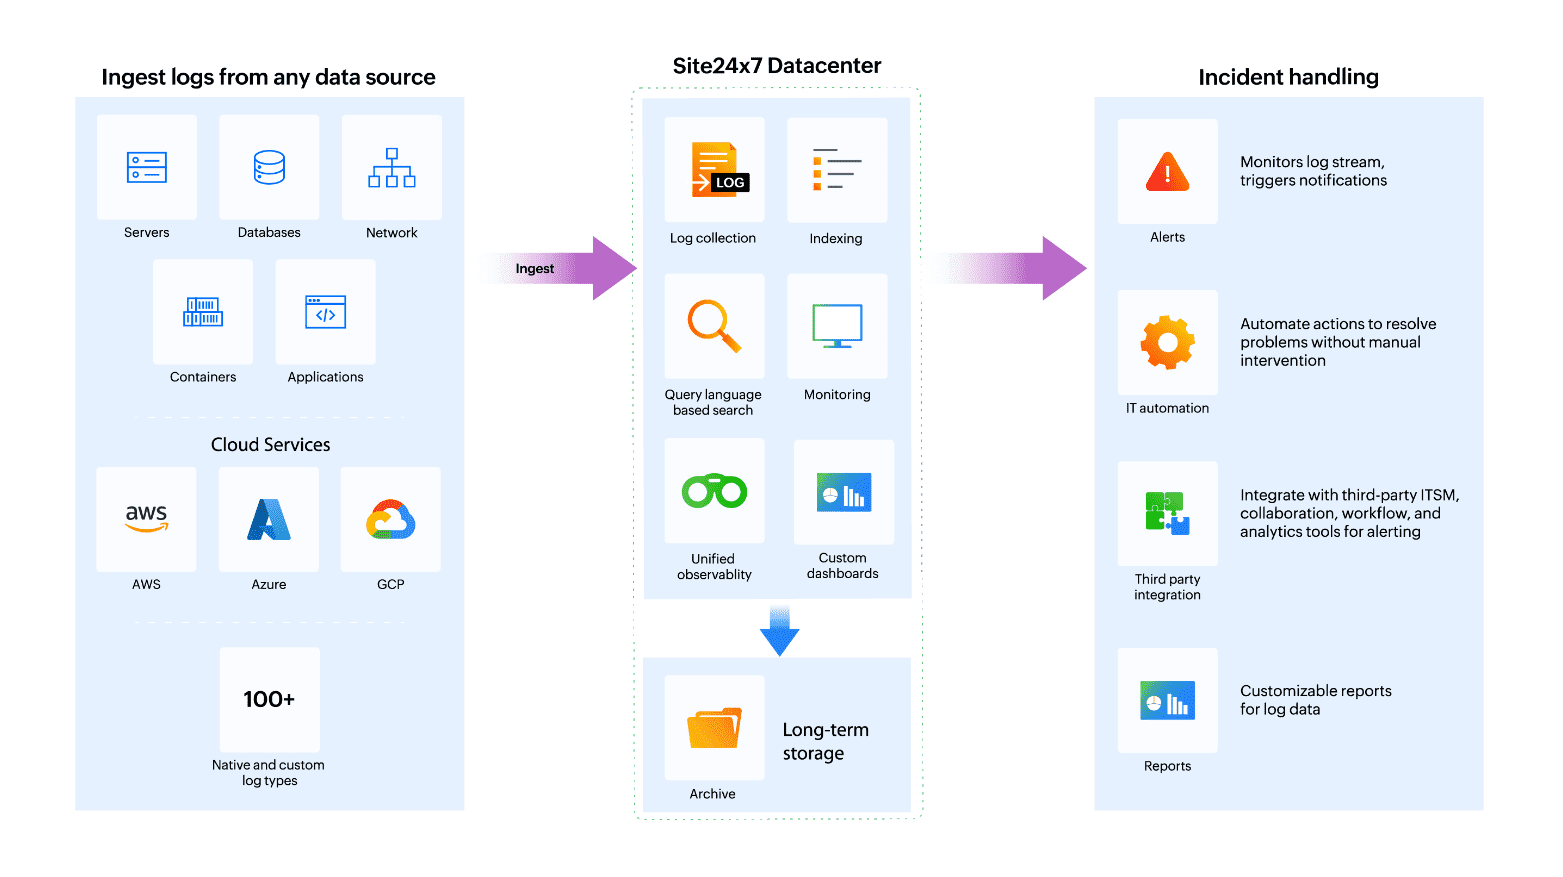 Fig. 15: Flow diagram
Site24x7's centralized cloud log management supports over 100 applications and automatically recognizes and manages logs. Collect, combine, and analyze logs across servers, databases, Kubernetes, applications, and frameworks. Configure log alerts for early issue detection, and leverage IT automation for automatic problem resolution. Site24x7's log management tool provides a great boost to DevOps productivity. Try Site24x7's log management now!