Consider a scenario where your application is lagging, users are dropping off, and your team is scrambling for answers. You check the dashboards—CPU is fine, memory looks okay, and network latency is negligible. So where’s the issue? Unfortunately, traditional performance metrics only skim the surface. They tell you that there's a problem, not where or why.
This is where code-level diagnostics become your trusted ally. Rather than guessing which component has gone rogue, code-level visibility lets you zoom into the exact method, class, or function responsible for performance degradation. Whether it's a misconfigured database query, a slow third-party API call, or a memory-leaking loop, this approach helps you catch it at the root.
Why you need code-level diagnostics
Performance bottlenecks don’t always reside in your infrastructure or environment. Many times, the real culprit lies within the application logic—inefficient code paths, synchronous blocking operations, or resource-heavy loops that are invisible from the surface.
Surface-level metrics like CPU, memory usage, or request count often fail to pinpoint these issues. What you need instead is granular visibility into your application’s execution path—line by line, call by call.
Real-world scenarios
- A backend API that handles 95% of the user requests begins to exceed its timeout threshold, resulting in failed transactions. Your infrastructure metrics are green, but the APM trace reveals that a nested loop inside a function was repeatedly processing duplicated entries.
- Your .NET application has sporadic latency issues. Code-level insights show an intermittent spike in SQL execution time tied to an un-indexed column.
With code-level diagnostics, these mysteries are quickly solved.
Improve code to boost performance
Applications are often built to scale, but only well-optimized code can scale efficiently. A few lines of inefficient code buried deep inside a frequently called function can silently throttle your performance.
With code-level tracing, you can:
- Identify slow methods that disproportionately affect overall response time.
- Catch synchronous I/O operations where asynchronous could be used.
- Pinpoint expensive SQL queries or object relational mapping (ORM) inefficiencies.
- Discover uncaught exceptions that degrade application performance silently.
Fixing issues at this layer is not just about tuning performance—it's about engineering robustness and reducing technical debt long-term.
Code-level visibility across platforms
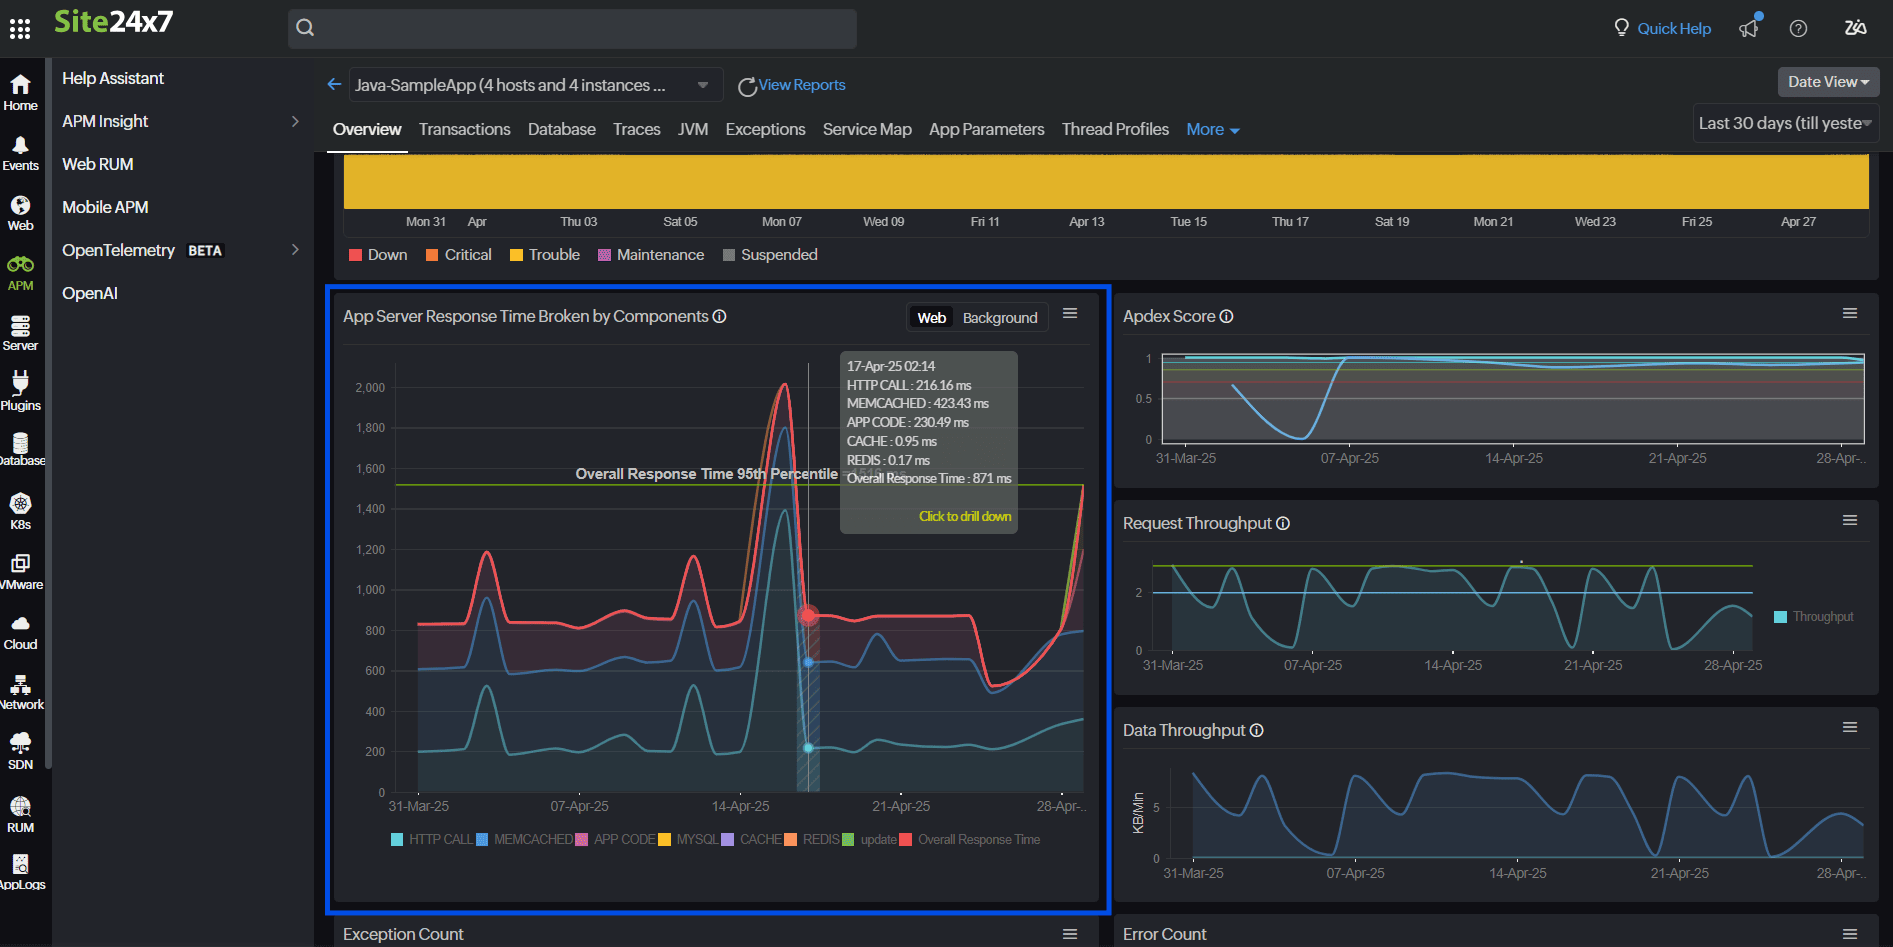
Modern APM tools like Site24x7 APM Insight offer deep code-level tracing across various technology stacks:
- Java: JVM introspection, method-level tracing, and garbage collection stats.
- .NET: CLR metrics, async call tracking, and IIS performance.
- Python: WSGI framework support, SQL query monitoring for supported ORM, and error tracking with stack traces.
- PHP: Script-level execution tracing, function call stack, and SQL query monitoring.
- Ruby: Request/response time tracking, database query monitoring, and error handling.
- Node.js: Custom instrumentation and garbage collection metrics.
Regardless of the platform, you get precise metrics from within the code execution flow.
Deep trace diagnostics: A content streaming use case
Let’s take the example of a content streaming platform like a video-on-demand (VOD) service. Users expect videos to load instantly, stream without buffering, and be able to switch seamlessly between qualities when needed. When performance dips, diagnosing the issue at a granular level becomes critical.
Let's explore this scenario in depth and see how code-level visibility helps trace and resolve issues across every layer of such a system.
Monitor user satisfaction with Apdex trends
A sudden dip in the Apdex score from users in a particular region alerts you that users are dissatisfied. It’s the first signal that something's wrong.

Identify slow components impacting user experience
The homepage takes 6 seconds to load. Tracing reveals that 3.5 seconds are spent loading personalized video recommendations due to inefficient ranking logic. With a response time breakdown by component and code segment, you can quickly isolate the bottleneck.
Visualize execution flow to detect processing delays
Distributed tracing captures every RPC or HTTP call as a “span,” which has a recording of the call's start time, end time, and metadata. Viewing these spans in a waterfall chart or service-map reveals where requests stall—whether in the player, CDN handshake, auth service, or backend logic. APM's Trace Details view automatically reconstructs the topology of a streaming session so engineers immediately see which service contributes most to end-to-end delay.

Detect bottlenecks in third-party service dependencies
Content streaming workflows rely heavily on third-party CDNs, ad-tech, and analytics pipelines. Without tracing, these external calls appear as opaque network hops. APM instruments outbound HTTP and gRPC calls, tagging each external span with vendor name, endpoint, and status codes. Teams can then isolate high-latency CDN lookups or failing DRM license checks by filtering on span attributes.
Optimize database performance with SQL-level visibility
A search query to fetch “trending shows” takes too long. Traces reveal a full table scan caused by a missing index on the views_count column. With SQL query execution times, slow query logs, and parameterized SQL insights, you can tune database performance precisely.

Expose compute-heavy functions with high CPU or memory usage
APM's Thread profiling periodically captures the thread stack traces and aggregates call counts to reveal CPU-intensive functions, even in high-throughput environments. On-demand heap dumps under load can help you correlate memory snapshots with peak-traffic traces. Heap dump analysis provides you with dominator-tree views and leak-suspect reports, letting you drill into the largest object retainers and pinpoint leaked classes or collections

Diagnose backend queue delays during peak load
Event-driven VOD pipelines (e.g., transcoding queues, analytics ingestion) must handle bursts of network activity without excessive lag. RUM can help you monitor consumer lag in data streaming and message-queue latency by measuring request-queuing time in front-end services.
Trace complex request paths across microservices
A single playback request spans the content service, user entitlements, ads injector, and CDN selector. Distributed tracing across microservices reveals that the ad selection microservice is slowing down the entire request flow.
Isolate recurring errors using trace-linked exceptions
Several users experience black screens. Exception tracking uncovers null pointer errors in the backend when handling metadata requests for closed captions. Visibility into exception counts and full-stack traces accelerates debugging.

Uncover request-level inefficiencies for client optimization
Large header payloads from legacy smart TVs degrade performance. Traces help identify problematic request patterns based on HTTP headers, payload size, and method.
Correlate infrastructure load with application behavior
On-premises transcoding servers show disk I/O spikes during ingestion. Correlating server metrics (CPU, memory, disk I/O) with application traces highlights the need for storage upgrades or resource re-balancing.
This isn’t just observability—it’s surgical diagnostics for your software. By integrating OpenTelemetry with Site24x7, you can augment your tracing capabilities even further. OpenTelemetry enables you to add custom spans and standardize instrumentation across services, enhancing Site24x7’s visibility. This integration also allows you to correlate traces, logs, and metrics from multiple sources, providing a more comprehensive view of your application’s performance and speeding up issue resolution.
Performance that scales with you
When you can trace slowness to a specific line of code, you’re not just optimizing; you’re transforming your development workflow. Code-level visibility helps engineers proactively fix issues before they reach production, reduce downtime, and deliver exceptional user experiences.
Moreover, it promotes technical excellence—by surfacing hidden inefficiencies and reducing long-term maintenance costs. With tools like Site24x7 APM Insight, this level of transparency is just a few clicks away.
So, stop guessing. Start tracing with code-level visibility with APM Insight.