Windows Management Instrumentation (WMI) Provider Host is an essential component of the Windows operating system (OS). It’s responsible for collecting and supplying system information to applications and helping manage devices in the network.
This hands-on article gives an in-depth discussion of the WMI Provider Host and its role in the Windows operating system. It looks at common troubleshooting strategies and dives into more advanced approaches to tackling WMI Provider Host problems and ensuring your Windows system functions smoothly.
WMI Provider Host, or WmiPrvSE.exe, is a critical Windows OS component. It’s an intermediary between system hardware and software that allows applications to access system information.
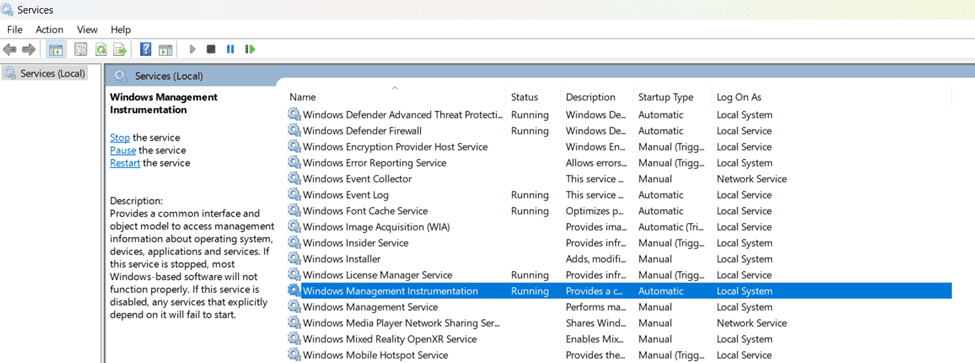 Fig. 1: Windows Management Instrumentation Service in the Windows Services Management Console
You can open Task Manager on any Windows device to validate the details of the WmiPrvSE.exe process. This often shows up multiple times. Depending on the details of each running process, you can verify the central processing unit (CPU) and memory loads and determine whether the process is interacting with the system itself (SYSTEM User Name) or with the network (NETWORK User Name).
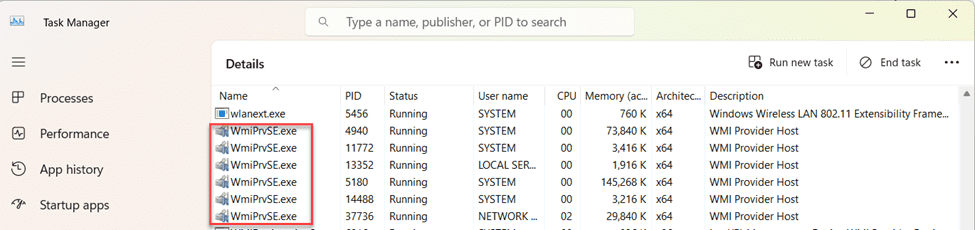 Fig. 2: WmiPrvSE.exe running multiple instances on a Windows device
One of the core functionalities of the WMI Provider Host is enabling health checks on the underlying Windows OS. These health checks provide monitoring details and relay system information to the applications running on top of the OS, reporting possible issues related to the OS or its core components.
For example, it provides detailed information in Windows Event logs (visible through Windows Event Viewer) and collects and shares details about the Windows machine’s physical hardware. These include mainboard information, chipset details, and memory state. Additionally, it provides access to system metrics about performance.
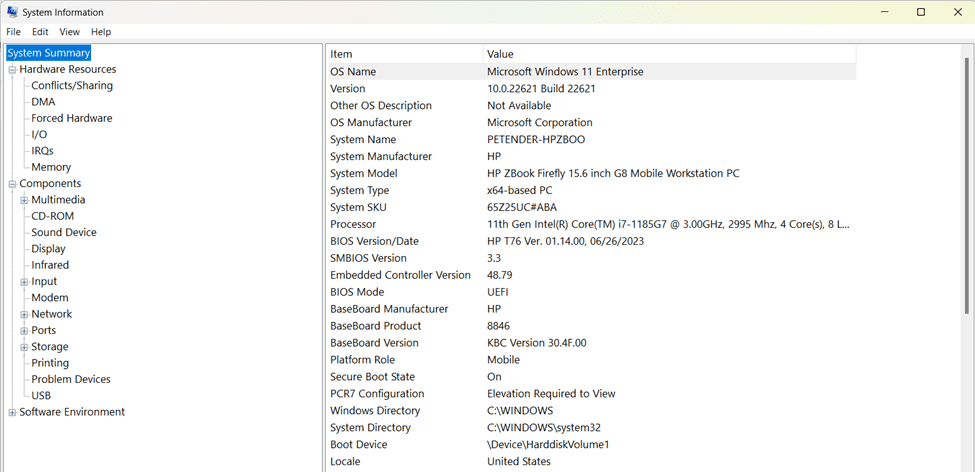 Fig. 3: The Microsoft System Information application showing a system summary of the device hardware resources, components, and software environment information
In addition to core system information, the WMI Provider Host is a crucial network management component and provides network-related data. It lists statistics of the network stack, the OS itself, and applications relying on network information, such as your browser and network connectivity validation checks.
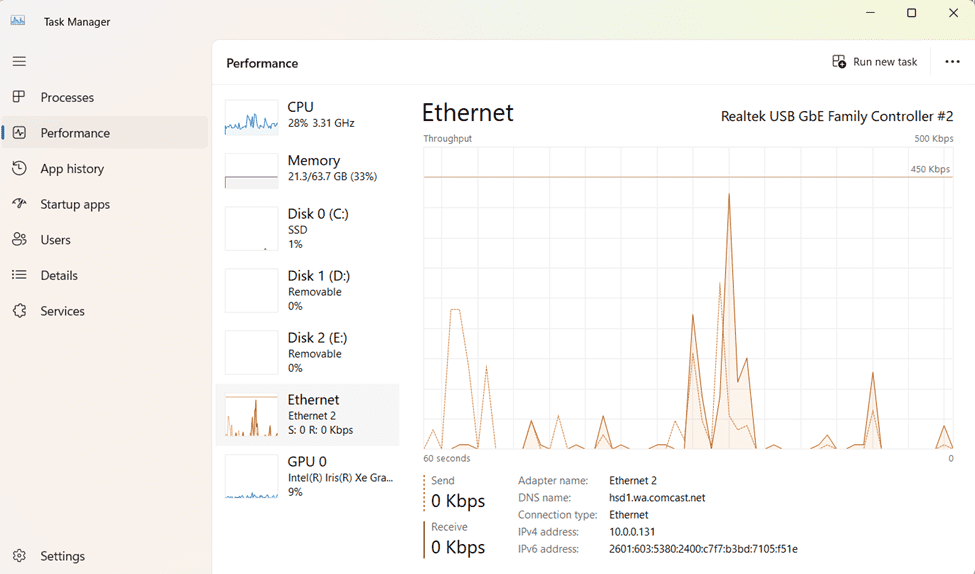 Fig. 4: Real-time statistics about the network performance are visible in Task Manager, provided by the WMI Host Service
Now that you understand WMI Host Service is a core part of the OS and why it’s so important, let’s review why troubleshooting may be necessary and share some common resolutions.
Initially, Windows introduced WMI as a core part of the Windows 2000 OS for both client and server. But even years before, users could install it from a separate download with Windows 95 and Windows NT4 workstations and servers. This means it has a history of about 30 years and has run on millions of computers in that timeframe.
Let’s examine a couple of these common issues in detail.
The processor is one of the most critical components in any device. When the CPU isn’t performing well, other issues may occur, such as the system failing to start or applications crashing. These issues impact performance and reduce the efficiency and stability of the OS, its applications, and its hardware state.
If the WMI Provider Host consumes too much CPU, it can create significant system instability and poor performance.
Errors and event log issues with the WMI Host Service often arise due to misconfigurations, resource conflicts, or corrupted system files. These issues can lead to disruptions in system monitoring, performance degradation, or even application failures. Because the WMI Host Service acts as the crucial interface between the operating system and hardware components, it's essential that you maintain detailed logs. Doing so supports timely identification and resolution of problems.
When the WMI Service no longer runs as expected, it typically results in losing event logs, crashing applications, or applications no longer starting. A healthy WMI Host Service is key to an overall smooth-running Windows machine.
To mitigate the common issues above, you might consider turning off the WMI Provider Host and related services. However, there are several reasons why that isn’t a good idea:
Stopping the WMI Provider service can exacerbate performance-related challenges. The following sections illustrate how to resolve these common problems caused by WMI Provider Host.
As is the case for fixing many issues on a Windows machine, Task Manager is one of the best resources you can use for troubleshooting WMI Provider Host issues.
From the Windows search in the Taskbar or directly from the Start Menu, open the Task Manager App.
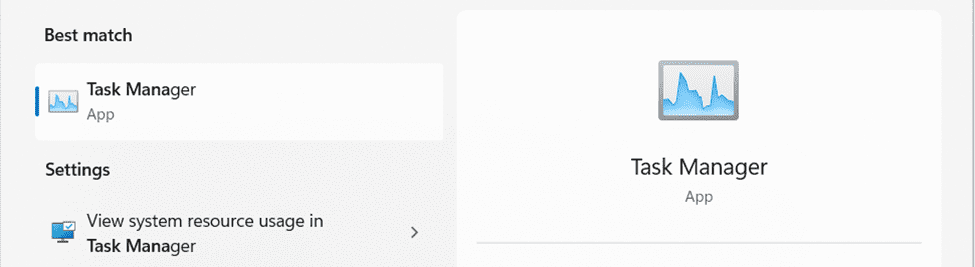 Fig. 5: Task Manager search results from the Start menu
Click on Processes. In the list of background processes, look for “WMI Provider Host.”
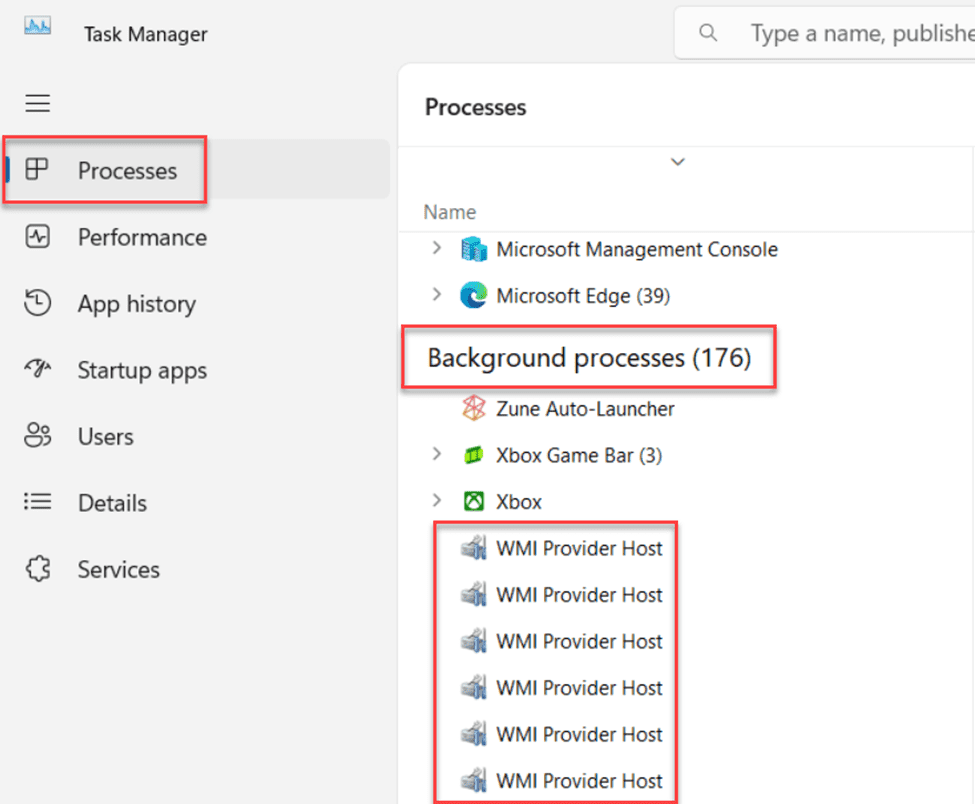 Fig. 6: WMI Provider Host processes listed in the Task Manager console
Next, check whether any of the listed WMI Provider Host processes have a high CPU load. Choose the specific process and right-click to open the context menu. Select Go to details.
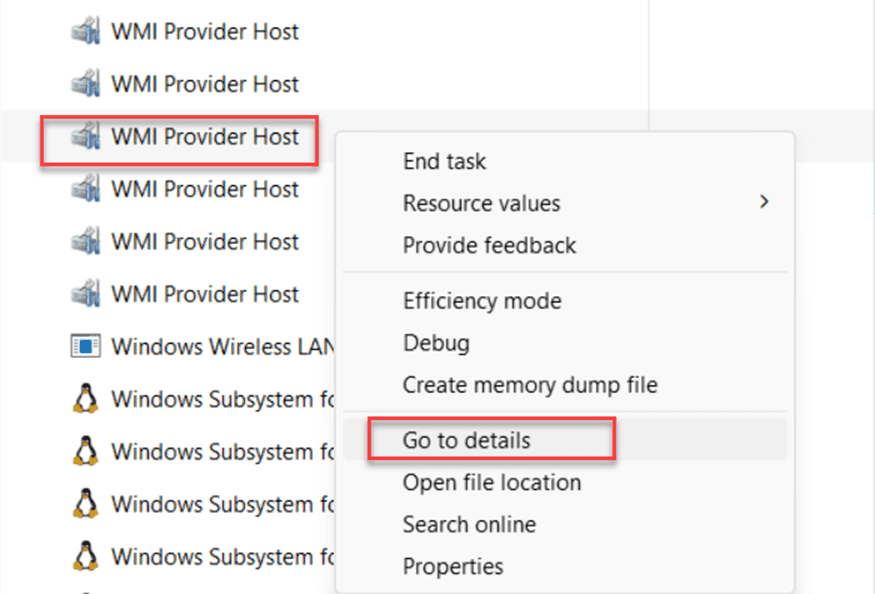 Fig. 7: The context menu opened, showing how to access a more detailed view of a running process
This opens up the Details blade view of Task Manager. Here, you see the actual running process, its process ID (PID), and the corresponding CPU and memory load.
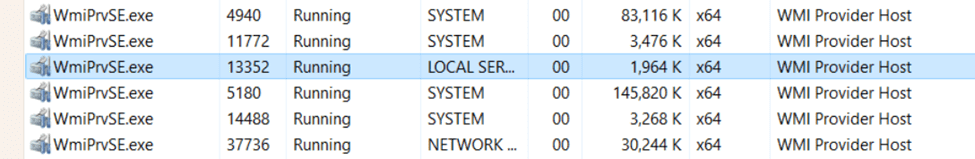 Fig. 8: Details view in Task Manager of a running WmiPrvSE.exe process
Open the context menu by right-clicking on the process. Next, select Open file location.
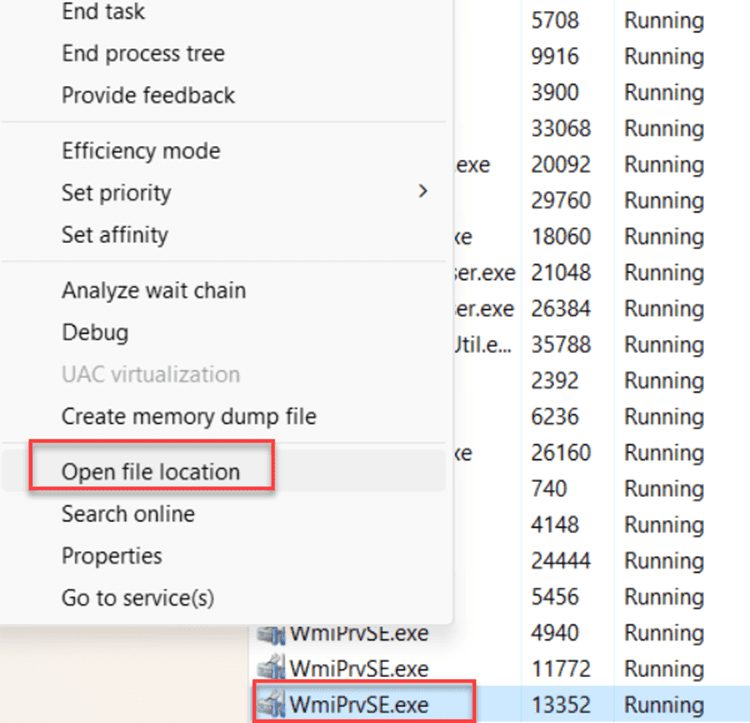 Fig. 9: Determining the file location for the WmiPrvSE.exe process
Validate the file location of the WmiPrvSE process, which should be C:\Windows\System32\wbem.
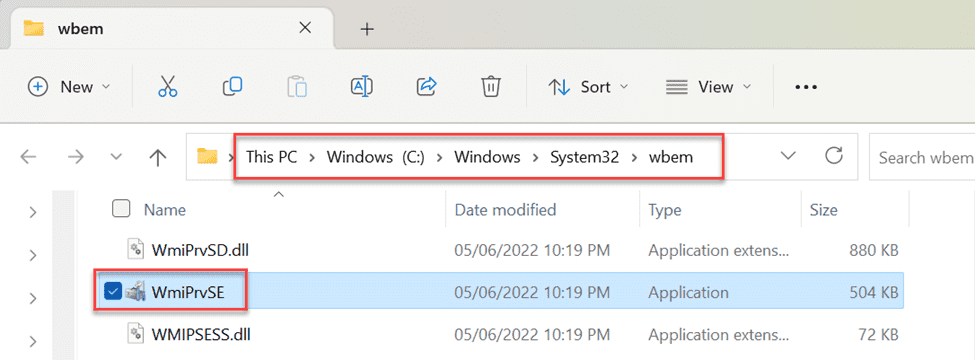 Fig. 10: WmiPrvSE.exe process file location
Note: If the process opens up in a different folder, it could indicate that you’re a victim of a virus or malware trying to mimic itself as a trustworthy system process.
Navigate to the Task Manager management console, select the faulty WMI Host Provider process causing high CPU spikes, and stop the task by clicking End task from the context menu.
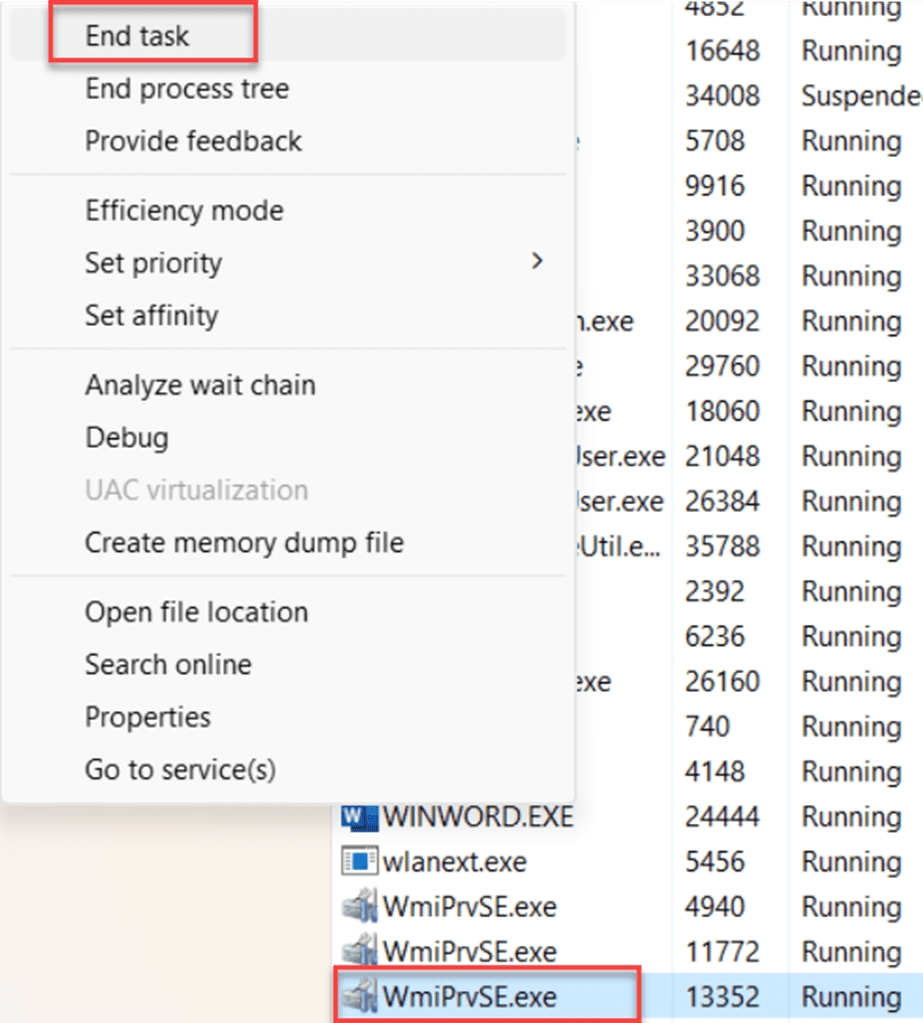 Fig. 11: Ending the running WmiPrvSE.exe process from the context menu
While ending the task typically stops the high CPU consumption, we recommend troubleshooting further to find the root cause of the high CPU use. Assess the cause by validating if the CPU usage is only occurring at specific times (like a scheduled backup), if it’s linked to opening or running a specific application, or if it’s caused by performing a specific task within an application (like running a complex search or triggering a long printing job).
Performance Monitor is another tool that helps pinpoint the cause of any problem. Open Performance Monitor via the Start menu or search in the taskbar.
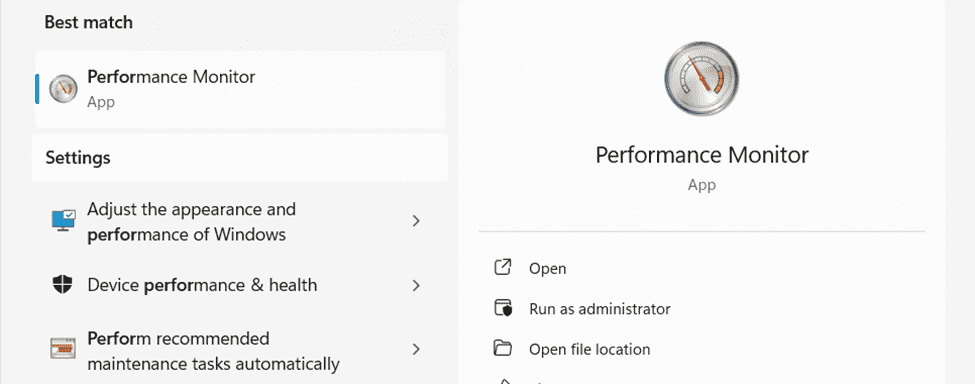 Fig. 12: Performance Monitor in the Start menu
Add a new counter by clicking the green + icon within the Performance Monitor app.
Select Process from the list of counters. Then, choose ID Process. Under Instances of Selected Objects, search for the WmiPrvSE processes.
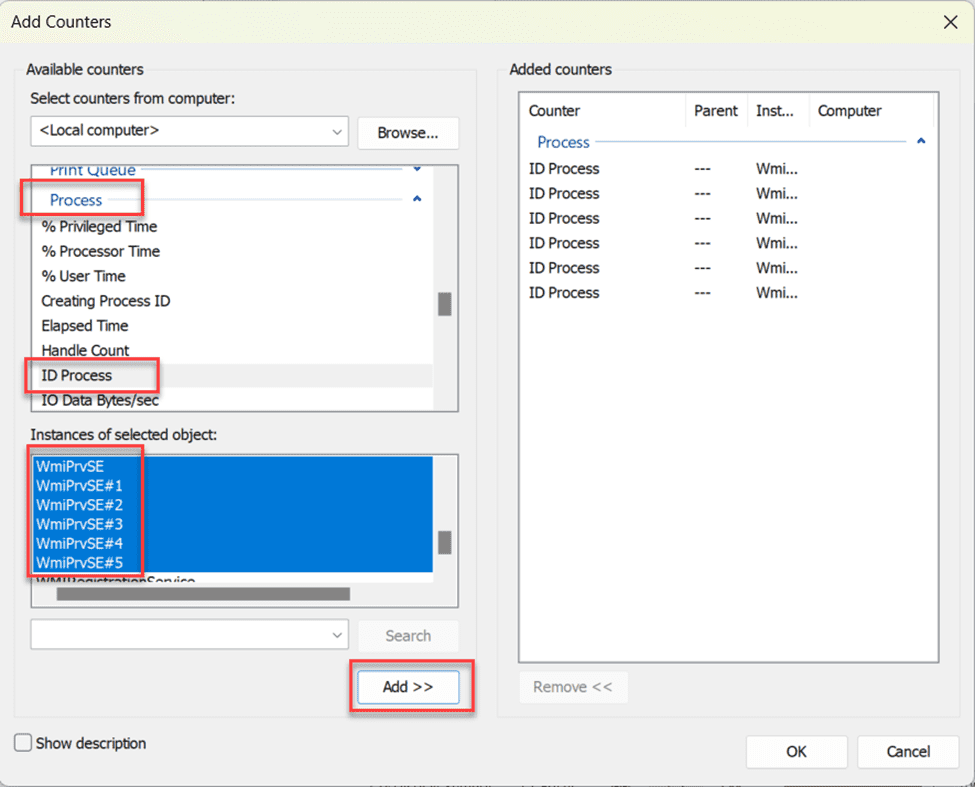 Fig. 14: WmiPrvSE process counters
Click the Add >> button to add the counters to the view.
Repeat the process to add new counters. Select Process and, this time, choose% Processor Time as the counter. Then, select the WmiPrvSE processes and add them as the counter.
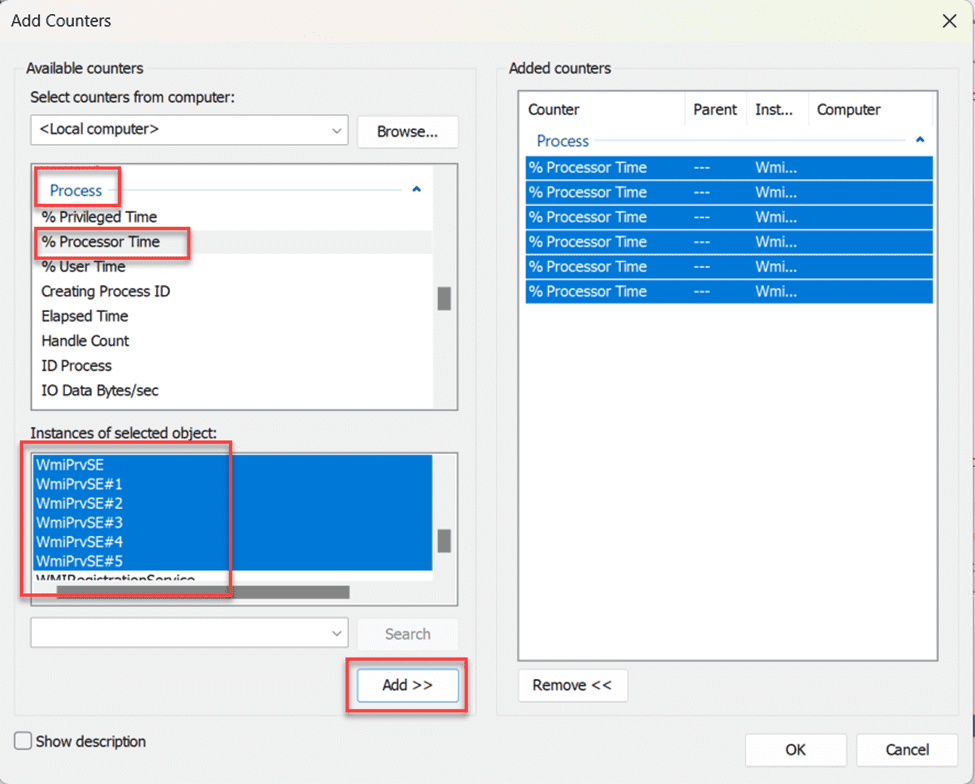 Fig. 15: WmiPrvSE process counters for % Processor Time
After adding different counters to the chart view, identify the symptoms by analyzing the behavior of the different WMI Process items. For example, the screenshot below indicates a repetitive CPU spike occurs every 20 seconds. Identifying a similar pattern would help you better understand the behavior of an application or a task running on your machine.
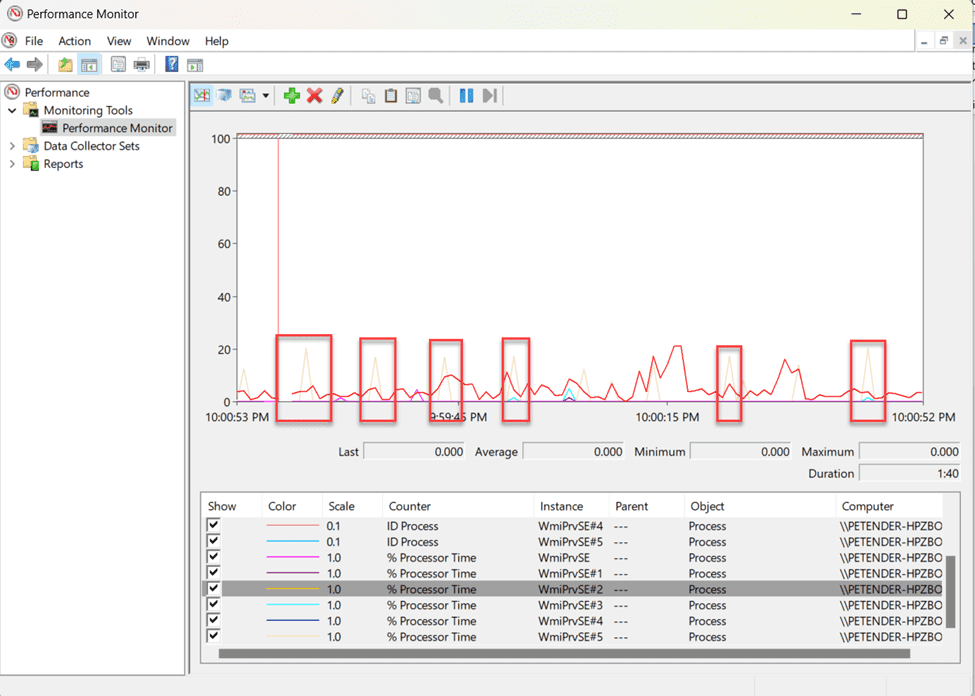 Fig. 16: Performance Monitor showing a 20% CPU spike at regular intervals
In addition to troubleshooting using Task Manager and Performance Monitor, it’s helpful to inspect the Event Viewer logs for the WMI activity. WMI-Activity logs provide a comprehensive perspective on system performance, giving you access error messages and critical information. Reviewing these logs makes troubleshooting easier.
To get started, open Event Viewer from the Start menu search.
 Fig. 17: Open Event Viewer from the Start menu search
Within the Event Viewer Management Console, navigate to the following location: Applications and Service Logs > Microsoft > Windows > WMI Activity.
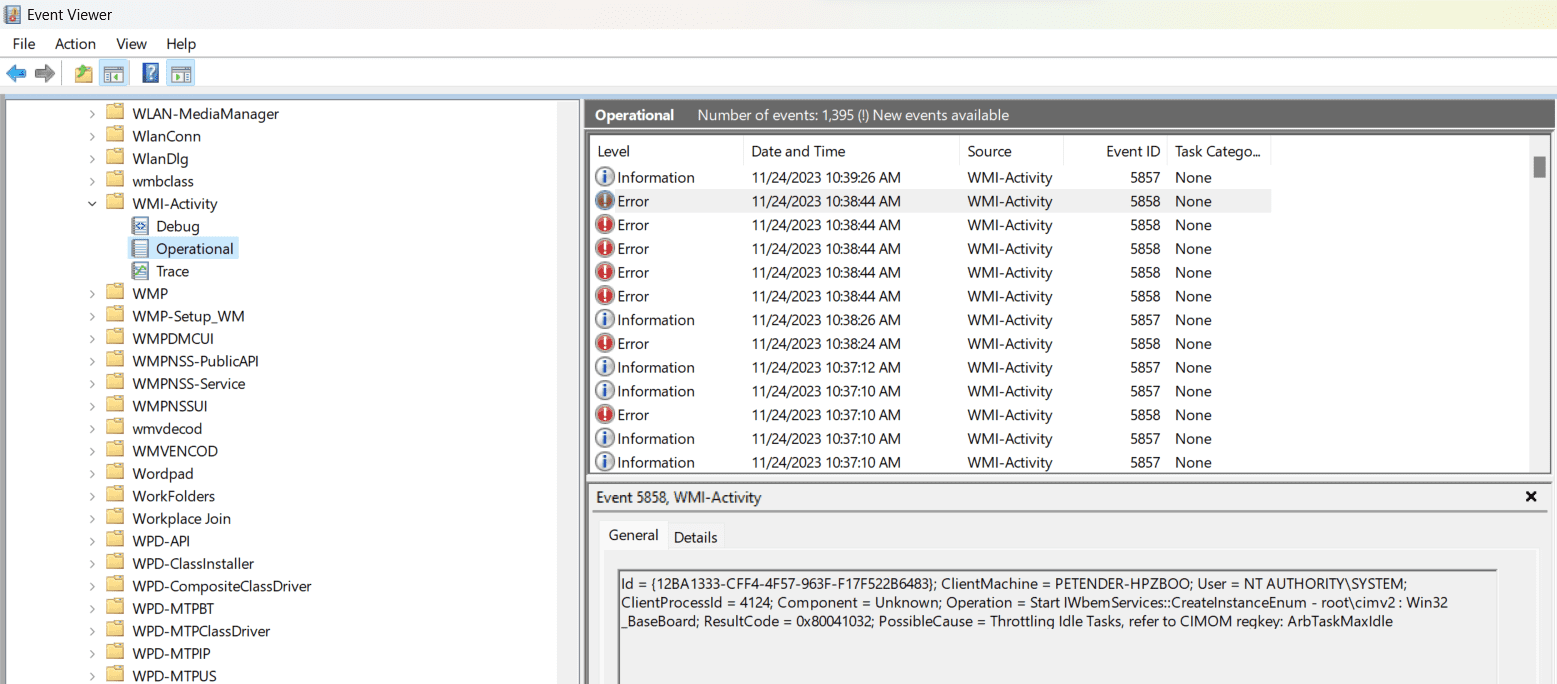 Fig. 18: WMI-Activity in Windows Event Viewer
Within the Operational section, look for any error-level items. You can inspect its details by opening the item.
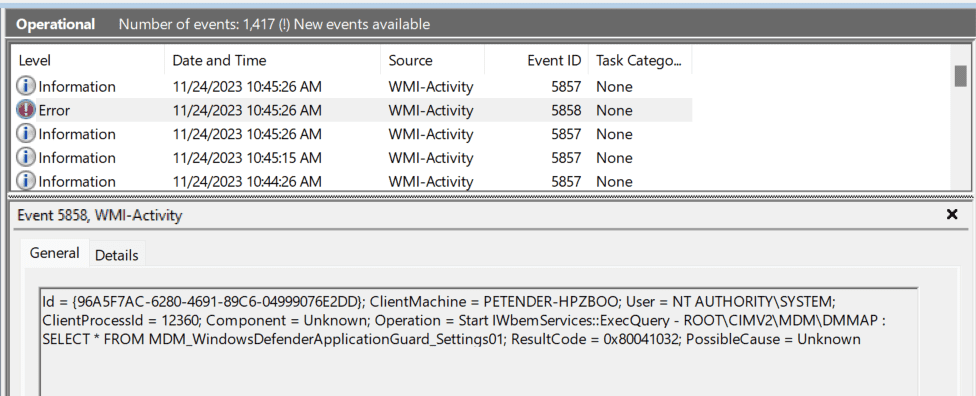 Fig. 19: Detailed error message related to WMI Provider Host process
In the above example, the WMI Process time of the error clarifies a Win32_DeviceGuard process occurred on the Windows machine, causing the CPU spikes you saw before.
Note: ClientProcessId=12360 in the log details reflects the PID discussed in the Task Manager view. You can use this to identify which of the multiple WmiPrvSE.exe processes relates to the error.
Although the above steps are straightforward, there are instances where following them isn’t ideal. Perhaps system administrators want to automate the processes, or you need to troubleshoot a remote machine since you don’t have the faulting device. That’s where PowerShell and PowerShell Remoting are beneficial.
Run the following command from a PowerShell window to retrieve the WMI-Activity logs from your local device:
Get-WinEvent -logname Microsoft-Windows-WMI-Activity/Operational
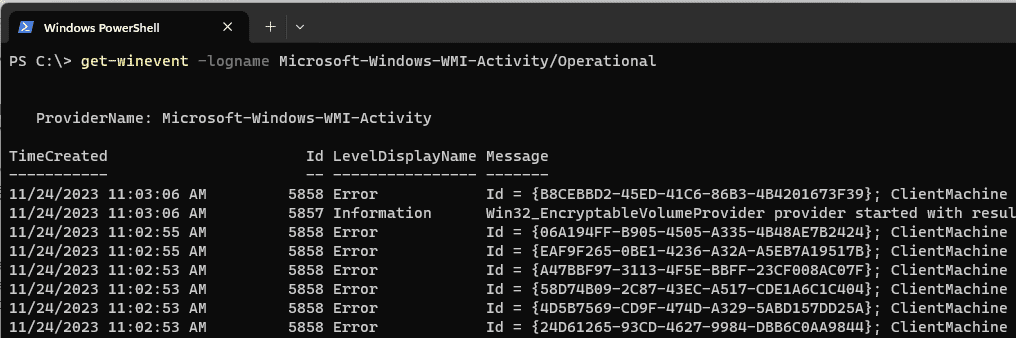 Fig. 20: Retrieving WMI-Activity logs from Event Viewer using PowerShell
Using the same PowerShell command, it’s also possible to include filters using the FilterHashtable parameter:
Get-WinEvent -FilterHashtable @{LogName='Microsoft-Windows-WMI-Activity/Operational';Id=5858;Level=2}
The command above provides Error (Level=2) for a specific Id (5858):
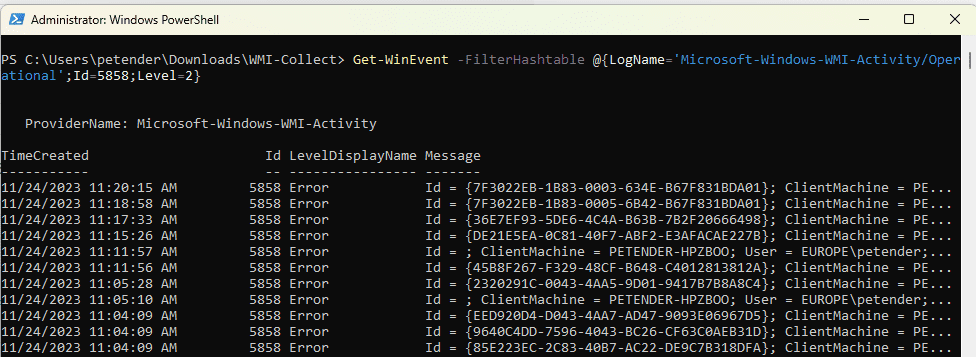 Fig. 21: Applying Filters using the FilterHashtable in PowerShell
Using Task Manager, Event Viewer, and Performance Monitor helped identify the troubled WMI Provider Host Process. But to get an even more detailed view of the process causing issues, you can turn on a Sysinternals tool: Process Explorer.
Once downloaded, extract the zip file and run the procexp.exe application. From the PID column, find the corresponding ClientProcessId from the Event Viewer Diagnostics earlier.
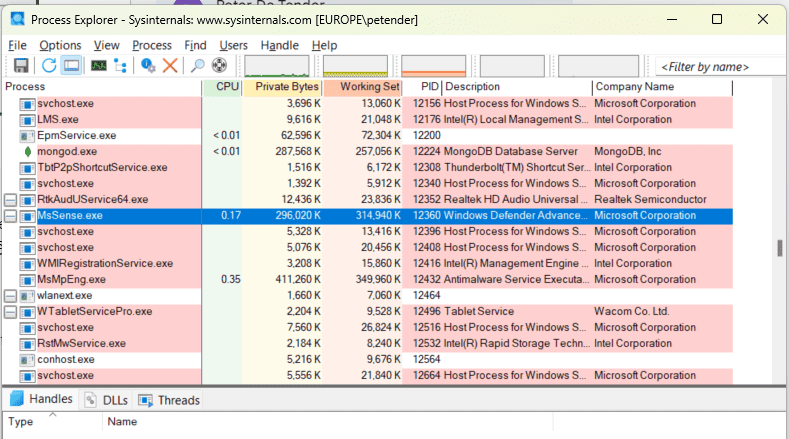 Fig. 22: Sysinternals Process Explorer
In the above example, you’re linking the WMI Host Process to an actual application—in this case, Windows Defender Advanced Threat Protection—based on the PID number.
What’s interesting here is that this process wasn’t exposed as a WMI-related process in Task Manager. However, thanks to correlating the WMI-Activity details from Event Viewer with Process Explorer, you pinpointed the actual process/service causing the WMI Host Provider errors.
Apart from using the graphical Process Explorer tool to identify WMI-specific (and other) processes running on your device, it can be beneficial to rely on PowerShell automation scripting to collect specific WMI process information.
Download the WMI-Collect Powershell script from the Microsoft website, extract the downloaded file, and then open PowerShell as the administrator.
Remove the script protection by running this command:
Set-ExecutionPolicy -ExecutionPolicy RemoteSigned
Change the directory to the extracted file using the cd command—for example, cd /path/WMI-Collect. You can then run the command below to capture the WMI activity logs:
WMI-Collect.ps1 -Logs -Trace -Activity -Kernel -wpr -perfmonwmiprvse
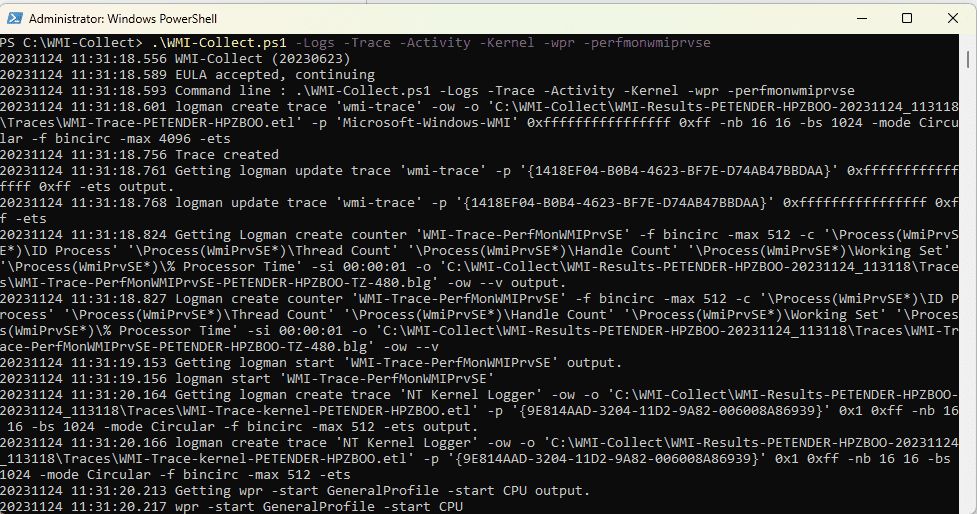 Fig. 23: Running the WMI-Collect PowerShell script
Note This script should only be used for actual troubleshooting, not as a long-running process.
Running the script creates a collection of diagnostics files in a folder named WMI-Results-XXX at the script location.
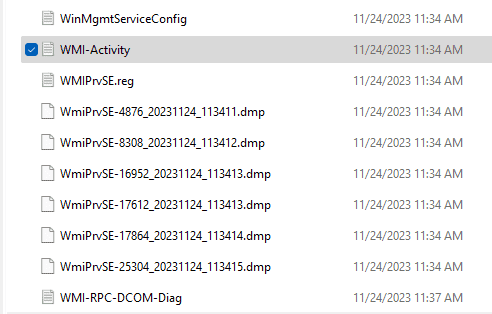 Fig. 24: WMI-Collect dump and other log files from running the WMI-Collect PS-script
In the previous section, you learned how to use Task Manager to pinpoint the troublesome WMI Process, stop it, and continue investigating and troubleshooting.
However, sometimes restarting the WMI Provider Host service is a possible fix. While it won’t be a fix in the long run, it might save the machine from crashing while you troubleshoot further.
To restart the WMI Provider Host, search for “Services” in the Start menu.
 Fig. 25: Open Services from the Start menu search
From the list of Services, look for “Windows Management Instrumentation.”
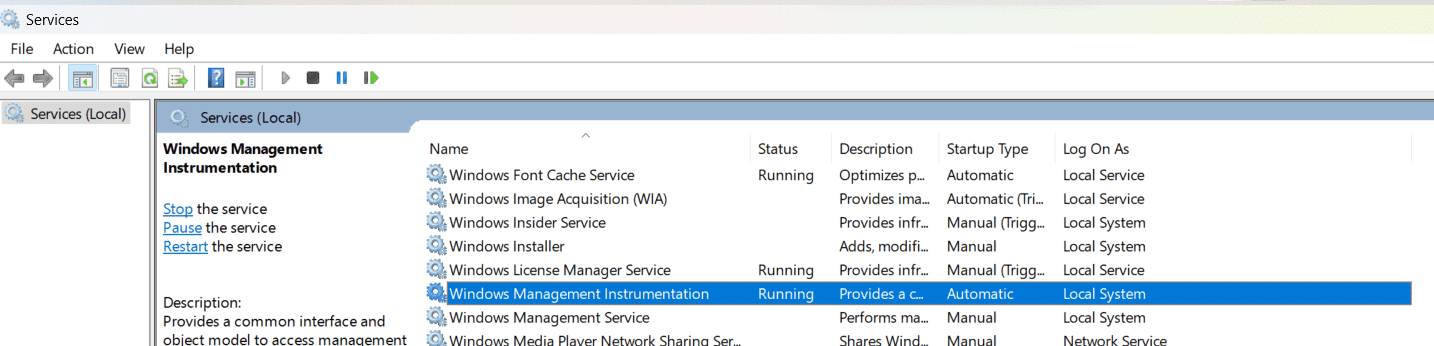 Fig. 26: Selecting the Windows Management Instrumentation service
Right-click the service and select Restart from the context menu.
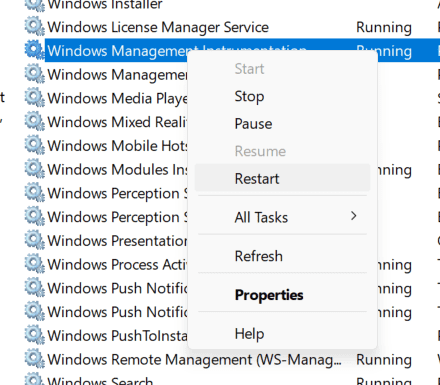 Fig. 27: Restarting the Windows Management Instrumentation service
Note: Your Windows machine might run multiple instances of the WMI Process. Restarting the Windows Management Instrumentation Service will stop and restart all instances at once.
When troubleshooting issues related to the Windows WMI Provider Host, it’s crucial to consider all possible factors causing disruptions or errors.
One highly effective step in this process is running a comprehensive virus scan on your system. This seemingly unrelated action can significantly enhance the stability and security of your Windows environment.
Malware or viruses can compromise the WMI Provider Host, leading to abnormal system and application behavior, system slowdowns, or even critical failures. The system may incorrectly flag these issues as WMI problems when the root cause is actually a security breach.
Running a virus scan as part of your troubleshooting process is essential for several reasons:
If the above options still don’t provide the information you need to pinpoint the root cause with the Windows machine running as-is, rebooting the machine in safe mode might be helpful. This allows you to start the machine in an isolated runtime mode, where no applications can start or run.
From within the safe boot environment, you can start PowerShell and run the Microsoft Support Diagnostic Toolkit from the command line (msdt.exe). This works for any Windows Version before Windows 11 22H2 (Windows 10, Windows 8.1, Windows 7, or even earlier).
If you’re running Windows 11, System Troubleshooters now replace the Microsoft Support Diagnostics Tool (MSDT). These are available by navigating to the following location:
From the Start menu, navigate to Settings > System > Troubleshoot > Other Troubleshooters.
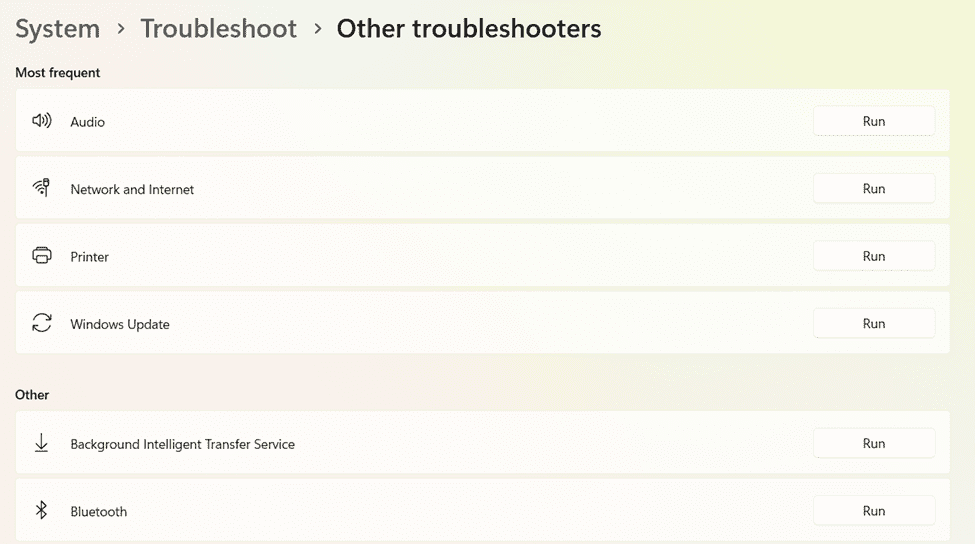 Fig. 28 System Troubleshooters in Windows 11
Notice there’s no specific troubleshooter for WMI Provider Host-related options. However, based on prior troubleshooting recommendations, it might point to a certain application or device. You can explore the list of other troubleshooters for help with resolving the issue.
This article explored the significance of WMI Provider Host, delving into its functions and its benefits to system administrators and network managers. It also addressed common issues, including high CPU usage and errors, and provided detailed troubleshooting recommendations for each problem.
Stopping the WMI Provider Host isn’t advisable, as it can disrupt system functionality and network management. Instead, follow the step-by-step troubleshooting instructions outlined here to diagnose and resolve issues promptly and optimize your Windows System experience.
Site24x7's Windows server monitoring uses WMI to collect performance metrics without causing high CPU overhead. The agent efficiently queries WMI for system metrics including CPU, memory, disk, and process data while minimizing resource consumption.
Yes, Site24x7's Windows server monitoring tracks process-level CPU and memory usage. You can configure threshold-based alerts to be notified when the WmiPrvSE.exe process consumes excessive resources, helping you take corrective action quickly.
No, Site24x7 uses a lightweight agent that collects metrics through multiple methods, including WMI and Windows Performance Counters. This ensures reliable data collection even if certain WMI providers encounter issues.