Improve the end-user experience by optimizing performance of your Tomcat servers.
Performance monitoring is crucial for the smooth functioning and availability of software applications. It enables engineers to gauge system health in real time, quickly establish the context of the underlying issue, and predict potential malfunctions.
Apache Tomcat is a top choice for deploying Java applications. In this article, we will share a complete guide on how to monitor its performance. We’ll look at its architecture and use cases and then talk about monitoring its most important performance metrics using different tools.
Apache Tomcat is an open-source web server and servlet container used to run Java-based HTTP applications. It implements the Jakarta Servlet, Jakarta Expression Language, and Jakarta Server Pages (JSP) technologies and provides developers with a highly scalable, ready-to-use environment to house and deploy Java applications.
 Fig. 1: Tomcat architecture
Catalina is the heart of the Tomcat server – its servlet container. It encapsulates the entire Tomcat architecture, including the connectors, the service elements, the request-processing engine, and the web applications.
A service element combines one or more connectors with a single engine. A Catalina server may have one or more service elements.
As the name indicates, the connectors link Tomcat to the outside world. They are responsible for receiving requests, forwarding them to the relevant application, and then relaying the results to the requesting clients.
There are two main types of connectors: HTTP connectors and AJP connectors. HTTP connectors are used to connect with browsers and other web clients over HTTP, while AJP connectors are based on the Apache JServ Protocol (AJP), which allows Tomcat to talk to Apache web servers.
The engine component processes all the incoming requests from one or more connectors, and generates the appropriate responses. A service element can only have one engine. Requests for static pages are served using the server cache, whereas dynamic pages require JSP and servlet processing.
The engine reads and compiles JSP files into Java servlet code, then displays HTML content to the clients.
The host element is a virtual host that assigns a network name to a web application. The engine element has one or more virtual hosts, each containing one web application. Clients use the hostname (e.g., www.samplewebapp.com) to identify the application they want to reach.
Context is used to represent a web application, which is typically packed as a web application archive (WAR) file. All the application assets, including the HTML, JSP, and servlets, are contained within the context. A service element may have several contexts.
A typical Tomcat server configuration file (conf/server.xml) looks like this:
<?xml version='1.0' encoding='utf-8'?>
<Server port="7002" shutdown="SHUTDOWN">
      <Listener className="org.apache.catalina.core.AprLifecycleListener" />
      <Listener className="org.apache.catalina.core.JreMemoryLeakPreventionListener" />
      <Listener className="org.apache.catalina.mbeans.GlobalResourcesLifecycleListener" />
      <Listener className="org.apache.catalina.core.ThreadLocalLeakPreventionListener" />
      <Listener className="org.apache.catalina.security.SecurityListener" />
      <Listener className="org.apache.catalina.startup.VersionLoggerListener" />
<Service name="Catalina">
     <Connector port="8080" protocol="HTTP/1.1"
                connectionTimeout="10000"
                redirectPort="8443" />
     <Connector port="8008" protocol="AJP/1.3" redirectPort="8443" />
     <Engine name="Catalina" defaultHost="www.samplewebapp.com">
       <Host name="www.samplewebapp.com"  appBase="sampleapps"
             unpackWARs="true" autoDeploy="true">
       </Host>
      </Engine>
   </Service>
</Server>
Tomcat uses one or more acceptor threads and a pool of worker threads to process requests efficiently. Whenever an acceptor thread receives a request, it assigns it to an idle worker thread from the pool, and resumes polling for new requests.
The worker thread forwards the request to the engine, which in turn relays it to the appropriate application, based on the HTTP headers. For example, suppose the engine receives the following request:
GET http://www.samplewebapp.com/firstpage/

Request Headers:
Connection: keep-alive
Host: www.samplewebapp.com
User-Agent: Mozilla/4.0 (compatible; MSIE5.01; Windows NT)
The engine will extract the hostname www.samplewebapp.com and compare it against the hostnames defined in the configuration file to identify the associated virtual host and web application. Once the engine generates the response, and sends it back to the connector, the worker thread becomes idle again.
Decoupling the acceptance, assignment, and processing of requests allows Tomcat to run highly transactional applications. Developers can tweak the number of threads through the configuration file.
maxConnections parameter represents the maximum number of allowed concurrent connections. minSpareThreads indicates the minimum number of threads that should always be running, including idle and occupied threads. acceptCount field indicates the maximum acceptable number of TCP requests that can be queued by the OS when all the worker threads are occupied. maxThreads sets the maximum number of threads Tomcat can spawn.Tomcat is a multipurpose web server that is used to build different kinds of Java-based applications and products.
Tomcat can be scaled as much as required based on the need and available system resources. This is why it powers several large-scale e-commerce applications with millions of users. With that said, it’s important to carefully benchmark an application with different parameters, in a testing environment, before increasing thread counts in a production instance.
In addition to using a worker thread pool for distributed load processing, Tomcat also comes with a built-in JDBC connection pool, significantly improving query execution performance. Features such as run-once queries, asynchronous connection retrieval, and automatic connection closure decrease the average response time and the load on the database server. All this makes Tomcat a top choice for database-intensive applications.
Tomcat can also be used to serve static content, such as HTML pages, stylesheets, and images. This allows you to build hybrid web applications, where static content is served directly from the server cache, and the engine processes only the dynamic content.
Tomcat is also readily used as the back end for feature-rich modern websites. Because it’s fast and scalable, it allows developers to implement efficient server-side processing, without compromising on page load time.
Java Management Extensions (JMX) is a framework that monitors and manages Java applications. Tomcat allows administrators to monitor several performance metrics using JMX-managed beans (i.e., MBeans).
Each MBean is registered with the JMX MBean server, representing a resource, application, or device to be monitored. It comprises a domain (java.lang or Catalina), a type, and a set of attributes.
Using MBeans, you can extract several kinds of performance attributes, including request throughput, memory usage, error counts, etc. To monitor these metrics, you can either keep an eye on the server logs, or use a monitoring tool such as Tomcat Manager or JavaMelody (more on this in a later section).
Tomcat exposes many performance metrics to users via the JMX MBeans. In the following sections, we’ll look at these metrics in more detail.
One of the most important indicators of Tomcat’s performance is its average request processing time. If the server takes too long to respond, it may cause page-rendering delays on the client side. Moreover, if there are too many active connections, it can lead to memory spikes and cause the entire server to slow down.
The GlobalRequestProcessor MBean (Catalina:type=GlobalRequestProcessor,name=“http-nio-8080”) provides the requestCount and processingTime metrics to monitor the number of incoming requests and the rate at which they are handled, respectively.
requestCount indicates the number of requests that your server receives over time. You can use this metric to get an idea of how many requests your server gets in an hour/day/week, and tweak the thread count and other configurations accordingly. processingTime attribute represents the total time Tomcat spent processing requests, accumulated over its entire running time. Monitoring this attribute gives you a clear idea of how well the server is performing, across peak and off-peak hours.By correlating requestCount and processingTime, you can get an idea of how your server adapts to changes in the rate of incoming requests. For example, if you notice a sharp decline in requestCount, but no change in processingTime, some bugs may be keeping your worker threads occupied even when they should be idle.
Similarly, suppose you notice a sudden rise in the processingTime, but no significant fluctuation in the requestCount. In that case, it may indicate that some component (e.g., the database) has slowed the entire system down, or that the number of configured threads is too low.
Sessions are another important performance metric. Too many active sessions can lead to spikes in memory and a decline in processing performance. An unexpectedly low number of sessions could indicate that some users cannot reach your application.
The Manager MBean (Catalina:type=Manager,context=[context name],host=[hostname]) has the activeSessions, maxActive, and expiredSessions attributes, which are really useful in performing session-level monitoring.
activeSessions attribute tells you the number of active sessions at any given point. maxActive attribute indicates the max number of concurrent sessions that Tomcat has encountered since start-up. expiredSessions counter reflects the sessions that were terminated due to time-outs or errors.The number of threads is directly proportional to the number of requests Tomcat can handle simultaneously. Thread pool utilization metrics enable you to accurately benchmark your deployment and find the optimal number of threads that enable your server to function at peak performance.
The ThreadPool MBean (Catalina:type=ThreadPool,name=“http-nio-8080”) exposes the currentThreadsBusy and maxThreads metrics, which offer great insight regarding thread utilization of each connector.
currentThreadsBusy indicates the number of worker threads that are currently handling requests. minSpareThreads value. If all worker threads have been assigned, but more requests keep coming in, Tomcat will continue to create more threads until it reaches the maxThreads value.Once maxThreads is reached, subsequent requests are queued. If the queue becomes full, no more requests are entertained until threads become free again. If your currentThreadsBusy number repeatedly approaches or reaches maxThreads, you should consider specifying a higher number of maximum threads.
Monitoring the correlation between currentThreadsBusy and maxThreads can help you fine-tune your thread pool configuration. E.g., if you notice that too many threads are staying idle, you may want to reduce the number of minimum threads.
JVM, or Java Virtual Machine, is the environment in which Tomcat and Java applications run. An important part of monitoring Tomcat performance is monitoring the memory usage of JVM. Having enough available memory is crucial, as it allows Tomcat to receive new requests, spawn new threads, execute database queries, and perform other necessary operations.
The Memory MBean (java.lang:type=Memory) has a HeapMemoryUsage attribute that can be used to retrieve the amount of heap memory used by Tomcat. The attribute lets you further drill down on the type of utilization:
Committed: The amount of memory that’s available to JVM for utilization.Used: The amount of memory that’s currently in use by JVM.Init: The amount of memory requested by JVM at server start-up.Max: The maximum amount of memory the user has allowed JVM to use.The most important metrics are the committed memory and used memory. Committed shows how much more processing power Tomcat has at its disposal. Ideally, committed memory should have a linear trend throughout the day, excluding some outliers during peak hours. Suppose you notice a sudden decline in the committed memory. In that case, it typically indicates either a sudden rise in incoming request rate, or a processing bottleneck (database hang-up, memory leak, etc.).
Used memory should stay as far away from the max memory limit as possible. If you see a sudden spike in used memory, and it is correlated with an increased number of incoming requests, you should consider increasing the maximum memory limit. However, if the request rate didn’t change too much, you should analyze the system for potential bugs or misconfigurations.
Garbage collection is a routine cleanup process that reclaims allocated memory after it’s no longer needed. Whenever garbage collectors are invoked, other JVM activities can get blocked, which, in turn, temporarily stops Tomcat from functioning. This is why it’s important to monitor garbage collection invocations, and strive to keep them to a minimum.
A helpful MBean to monitor garbage collection is the GarbageCollector bean (java.lang:type=GarbageCollector,name=(PS MarkSweep|PS Scavenge). It has an attribute named CollectionCount, which represents the total number of times JVM needed to perform garbage collections since the server started.
A linear increase in CollectionCount is natural and acceptable. However, if you notice a sudden spike, it should be cause for concern. Too many garbage collection invocations typically mean that there are memory leaks in your program. Resolving these leaks should be a priority, as they can significantly increase the memory footprint and slow down the server.
Database operations, such as CONNECT, READ, and WRITE, are resource-intensive. Tomcat allows developers to use connection pools to mitigate database connection overhead, and promote connection reuse. However, it’s important to keep a close eye on database connection metrics, such as number of idle and active connections.
The DataSource MBean (Catalina:type=DataSource, context=[context name], host=[hostname], class=javax.sql.DataSource, name="[JNDI name]") exposes the numActive and numIdle attributes, which can be used to track the number of active and idle connections, respectively.
Errors indicate that something went wrong in the application logic, the servlet, or any other Tomcat server component . Some examples are: requested resource not available, database unresponsive, Tomcat memory exhausted, or a syntax error in the servlet code.
A pivotal part of gauging Tomcat’s health is keeping tabs on the number of generated errors. The previously mentioned GlobalRequestProcessor MBean (Catalina:type=GlobalRequestProcessor,name=“http-bio-8888”) also contains the errorCount attribute, which depicts the cumulative number of errors encountered against incoming requests.
Even though the count gives a high-level idea of the server’s ability to successfully respond to user requests, it doesn’t detail the nature or severity of the generated errors. It’s possible that at least some of these errors arose because of the user sending bad or incomplete requests.
Fortunately, we can look for specific error types by querying Tomcat logs. For example, out-of-memory errors typically show up in the logs as follows:
org.apache.catalina.core.StandardWrapperValve invoke
SEVERE: Servlet.service() for servlet [jsp] in context with path [/sample]
threw exception [javax.servlet.ServletException: java.lang.OutOfMemoryError:
Java heap space] with root cause
java.lang.OutOfMemoryError: Java heap space
Similarly, you can monitor logs for common exceptions as well, such as
java.lang.NullPointerException, java.lang.IllegalArgumentException, or java.lang.IllegalStateException.
Until now, we have covered some of the most important performance metrics that JMX exposes via MBeans. Now we’ll look at aggregating and monitoring these metrics through two easy-to-use tools.
JavaMelody is an open-source performance monitoring tool for Java applications. If you are using Maven to build your application, you can enable JavaMelody by adding the following dependency to your pom.xml:
<dependency>
    <groupId>net.bull.javamelody</groupId>
    <artifactId>javamelody-core</artifactId>
    <version>1.91.0</version>
</dependency>
Once enabled, JavaMelody aggregates data from server and access logs to create charts for different metrics, including memory usage over time, number of Java Database Connectivity (JDBC) connections, and request throughput. JavaMelody graphs persist across restarts, and you can access the web interface at http://>tomcat-IP>:<port>/<application-name >/monitoring.
Arguably the most important section on the monitoring portal is the “statistics of http system errors”. It contains a list of the most frequently occurring system and HTTP errors, and Java exceptions. A similar section, “statistics system error logs”, contains a list of the logs produced by Tomcat for frequently occurring errors and warnings.
You can also read the values of JMX MBeans via JavaMelody. To access the page for any loaded MBean, you can use the following URL:/monitoring?part=mbeans-URL.
Tomcat Manager is Tomcat’s native performance monitoring tool, which lets administrators monitor hosts and applications through a web interface. To access the manager interface and other components, you need to define certain roles in the user configuration file.
Tomcat ships with different predefined roles to delegate access to the manager, but the most commonly used ones are the manager-gui and manager-jmx roles. The former provides access to the web-based manager interface, whereas the latter grants permissions to use the JMX proxy interface and the “Server Status” page. To create a new user with both the roles, add the following lines to the
conf/tomcat-users.xml file:
<role rolename="manager-gui"/>
<role rolename="manager-jmx"/>
<user username="admin" password="thisisaS3cret" roles="manager-gui, manager-jmx"/>
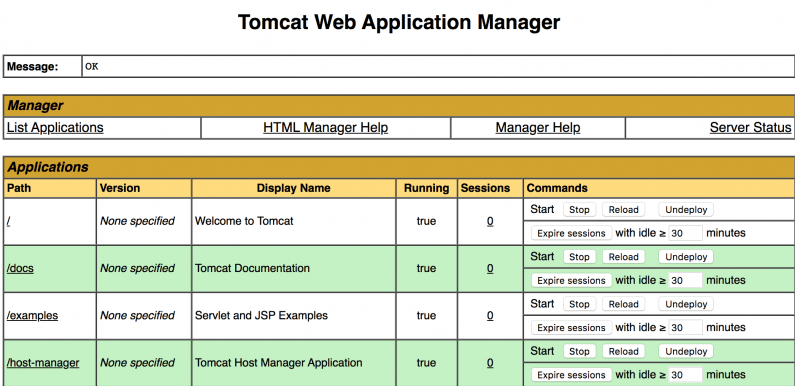 Fig. 2: The Tomcat Manager web interface
The manager web interface is accessible at localhost:8080/manager/html.You’ll see some basic information there, including server status and a list of deployed applications. To view the status of all your applications, visit the detailed status page at http://localhost:8080/manager/status/all.
A single request URI (http://localhost:8080/manager/text/{command}?{parameters}) can be used to execute all the commands/operations available on the management interface. For example, to remotely deploy a new WAR file, you can use http://localhost:8080/manager/text/deploy?path=/my/file/is/here. As you can see, you replace {command} with deploy and then specify the query parameter that the command accepts.
Some other useful manager commands are as follows:
http://localhost:8080/manager/text/sessions?path=/examples. To forcefully expire all sessions that have been idle for longer than X minutes, use this URI: http://localhost:8080/manager/text/expire?path=/examples&idle=X.http://localhost:8080/manager/text/serverinfo http://localhost:8080/manager/text/reload?path=/my-app
http://localhost:8080/manager/text/stop?path=/my-appYou can find the entire list of commands here.
Like JavaMelody, Tomcat Manager also enables you to query JMX metrics through the JMX proxy servlet, available at http://localhost:8080/manager/jmxproxy to users with the manager-jmx role. The landing page will show you a list of all the available MBeans. To retrieve data regarding an attribute exposed by a particular MBean, you can format your URI as follows:
http://localhost:8080/manager/jmxproxy/?get=Catalina:type=GlobalRequestProcessor,name="http-nio-8080"&att=processingTime
The above URI will retrieve the processingTime attribute from the GlobalRequestProcessor MBean.
Monitoring the performance of Tomcat enables you to keep memory and CPU utilization in check, assess server status in real time, detect potential issues before they occur, and prevent downtime. The goal of this article was to introduce you to different monitoring technologies, such as JMX MBeans, JavaMelody, and Tomcat Manager. To learn more, you can visit the official Tomcat monitoring documentation.
You can easily install the Site24x7 Java agent or Tomcat plugin to start collecting performance metrics from your Tomcat server.
Yes, Site24x7 provides deep visibility into JVM performance, including heap memory usage, garbage collection frequency, and thread details.
Yes, you can configure alerts to notify you when the active thread count approaches the maximum limit, preventing request queuing and timeouts.
