Memory optimization in the .NET Framework 4.5 refers to using best practices and techniques to minimize memory usage, prevent memory leaks, optimize garbage collection, and maximize memory efficiency in a .NET application. By managing application memory efficiently, developers can enhance performance and ensure optimal resource utilization in their .NET 4.5 applications.
However, understanding memory management issues can be challenging, even in a managed framework like .NET. This article discusses some .NET 4.5 memory basics, examines some common causes of memory issues in .NET 4.5, and explains how you can detect and resolve memory issues using the .NET memory profile.
Efficient memory management ensures optimal performance and stability of your .NET applications.To achieve this, you need to understand some of the basic concepts of .Net memory management. The following sections explore some of these concepts and how they contribute to better memory optimization.
Managed memory is automatically allocated and managed by the Common Language Runtime (CLR), which handles memory allocation and deallocation for objects created in a .NET application. The CLR organizes memory using managed heaps and automatic garbage collection to reclaim the memory of unreferenced objects. Managed memory eliminates the need to allocate and deallocate memory manually, mitigating the risk of memory leaks and simplifying memory management for developers while improving application performance.
Unmanaged memory in .NET 4.5 is often used when interacting with native resources. Unmanaged memory is not subject to garbage collection and must be manually allocated and deallocated using platform invoke (P/Invoke) or the `Marshal` class. To maintain a stable and efficient application, it's crucial to explicitly free unmanaged memory when it is no longer required. Neglecting to do this can lead to problems like excessive memory usage, memory leaks, and instability within the application.
The .NET Framework 4.5 uses heap memory to dynamically allocate memory at runtime. It is divided into the small object heap (SOH) and the large object heap (LOH). Heap fragmentation occurs when the free memory becomes scattered into small, noncontiguous blocks, making it difficult to allocate objects to contiguous memory regions. Increased fragmentation can decrease application performance and limit scalability.
Threads allow an application to execute multiple tasks concurrently to improve its responsiveness and performance. Each thread has a separate program counter and stack for method calls, local variables, and function parameters, enabling it to execute code independently.
All threads share the same managed heap, which can lead to synchronization and memory consistency issues if more than one thread attempts to access and modify the same data. To ensure thread safety and coordinate access to shared resources, you must utilize synchronization mechanisms like locks, mutexes, and semaphores.
Several common conditions can lead to memory issues in the .NET Framework 4.5 if not handled properly.
Events enable communication and coordination between components or objects in a .NET application, allowing an object to notify other objects when a specific action or change in state occurs. They use the publish-subscribe pattern, where the object that raises (sends) the event is called the "publisher," and the objects that receive and handle the event are called "subscribers."
Failing to unsubscribe from events when they are no longer needed can cause memory leaks. As long as the subscriber remains in memory, it will keep a reference to the publisher, which will not be garbage collected.
Anonymous methods allow you to create inline delegate functions without explicitly declaring a named method. However, they can capture variables from their surrounding context, creating hidden references. As long as the anonymous method is alive, the garbage collector will not reclaim those variables. This can lead to memory leaks if the anonymous method continues to reference large or long-lived objects, keeping them alive for longer than necessary.
Static variables are shared across all instances of a class and exist for the entire lifetime of the application. They are convenient for storing shared data and are often used for caching data or accumulating results. Accumulating data in static variables without proper cleanup or reset causes the data to grow indefinitely, leading to excessive memory consumption throughout the application's entire life span.
Caching is often used to store frequently accessed data in memory and serve subsequent requests more efficiently to improve the performance of applications. Memory leaks in caching can occur when objects are stored in the cache indefinitely without being cleared or removed when they are no longer needed. These objects continue to consume memory resources, leading to increased memory usage.
Failure to correctly dispose of unmanaged resources can cause resource and memory leaks. Managed objects can also lead to memory leaks if they hold references to other objects that are not properly released. If you're implementing custom memory management in your application using unsafe code or interop, careful attention must be paid to properly deallocating memory and releasing associated resources.
Using profiling and debugging tools,such as the Visual Studio Performance Profiler and WinDbg, can give you insights into memory consumption patterns and aid in optimizing memory usage.
The following sections demonstrate how to use both tools to detect memory leaks in .NET.
Visual Studio Performance Profiler is an integrated feature of Microsoft Visual Studio that gives developers detailed information about the execution of application code, including memory allocations.
This article uses the following code sample to demonstrate how it works:
using System;
using System.Collections.Generic;

namespace MemoryLeakExampleDemo
{
    public class EventPublisher
    {
        public event EventHandler? SomeEvent;

        public void DoSomething()
        {
            Console.WriteLine("EventPublisher: Doing something...");
            SomeEvent?.Invoke(this, EventArgs.Empty);
        }
    }

    public class EventSubscriber
    {
       public void HandleEvent(object? sender, EventArgs e)
        {
            Console.WriteLine("EventSubscriber: Event handled.");
        }
    }

    public static class MemoryLeakExample
    {
        private static EventPublisher? _publisher;
        private static List<string>? _cache;

        public static void Run()
        {
            // Create an instance of EventPublisher
        _publisher = new EventPublisher();

         // Create an instance of EventSubscriber
           for (int i = 0; i < 50; i++)
            {
                EventSubscriber subscriber = new EventSubscriber();
                _publisher.SomeEvent += subscriber.HandleEvent;
            }

            // Create a static variable
            _cache = new List<string>();

            // Perform some actions with the publisher
            _publisher.DoSomething();

            // Simulate bad memory allocation
            for (int i = 0; i < 10000; i++)
            {
                string data = new string('A', 10000);
                _cache.Add(data);
            }

            Console.WriteLine("MemoryLeakExample: Program completed.");
        }
    }
}
In this example, the EventPublisher class has an event called SomeEvent that the EventSubscriber class subscribes to. The event handler is not unsubscribed, which can cause a memory leak. The _cache variable is declared as a static List<string> object, but it is not cleared or set to null, preventing the garbage collector from reclaiming its memory. Objects are continuously added to the cache without proper cleanup, causing it to consume memory indefinitely. The application also creates large strings continuously and adds them to the cache, which can lead to memory fragmentation and excessive memory usage.
You'll run this code under the Performance Profiler in Visual Studio with the Memory Usage option checked. This option allows you to analyze specific methods, objects, or types to track objects that are being kept longer than necessary or that are not being garbage collected properly. It also provides valuable metrics such as the size of managed heaps, the number of allocated objects, and the amount of memory consumed by specific components to help you prioritize your optimization efforts.
To run the code, go to the Debug menu and select Profiler, then select the Memory Usage checkbox in the Available Tools section:
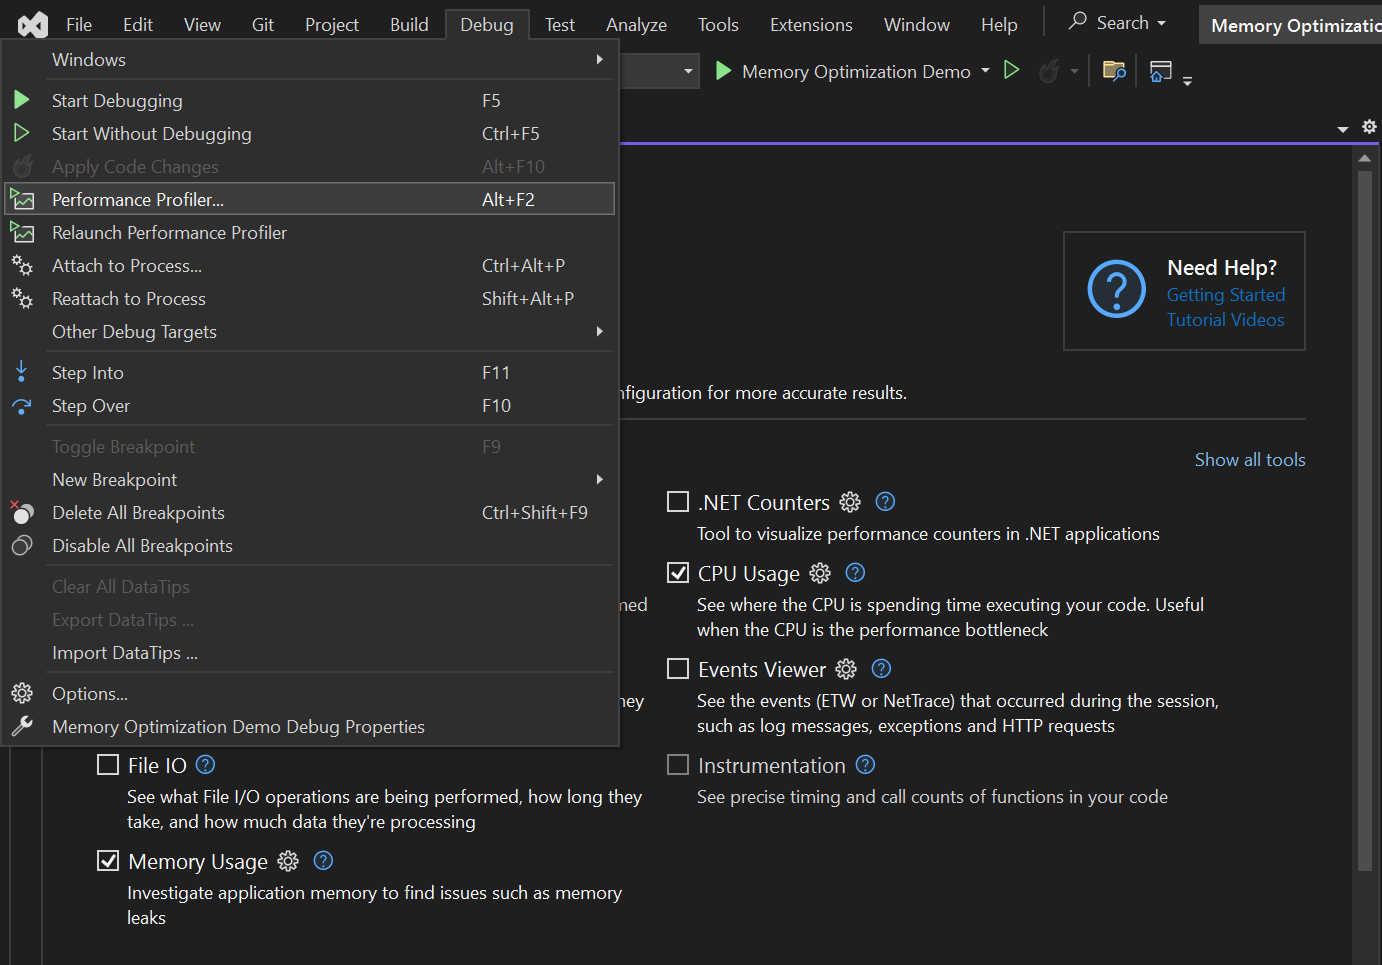 Fig. 1: Visual Studio Debug menu showing Performance Profiler
Note that you can run the Performance Profiler with your solution configuration set to Debug, but the Release setting will give more accurate results.
Now, place a breakpoint at the first line of code in the for loops for creating the subscriber events and simulating memory allocation to debug the code:
for (int i = 0; i < 50; i++)
{
    EventSubscriber subscriber = new EventSubscriber();
    _publisher.SomeEvent += subscriber.HandleEvent;
}
The following code will then simulate bad memory allocation:
for (int i = 0; i < 10000; i++)
{
    string data = new string('A', 10000);
    _cache.Add(data);
}
When you debug the application, you'll see memory usage information in the Diagnostic Tools window on the right side of your project. Debug through the for loop, then go to the Summary tab and take a snapshot:
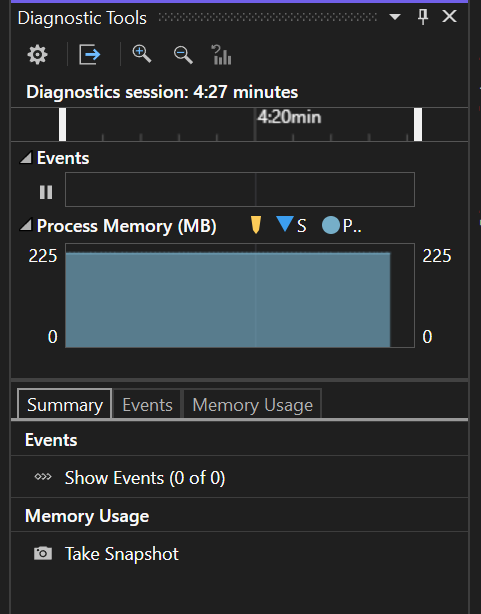 Fig. 2: Visual Studio Diagnostic Tools window showing Summary tab
If you run through the loops a few more times, taking memory snapshots, you'll see that memory usage has increased:
 Fig. 3: Memory Usage snapshot using the VS Performance Profiler
If you click the heap value in the Heap Size (Diff) column, you can see the allocated objects in a heap. The following screenshot shows the instances of EventHandler that are in memory:
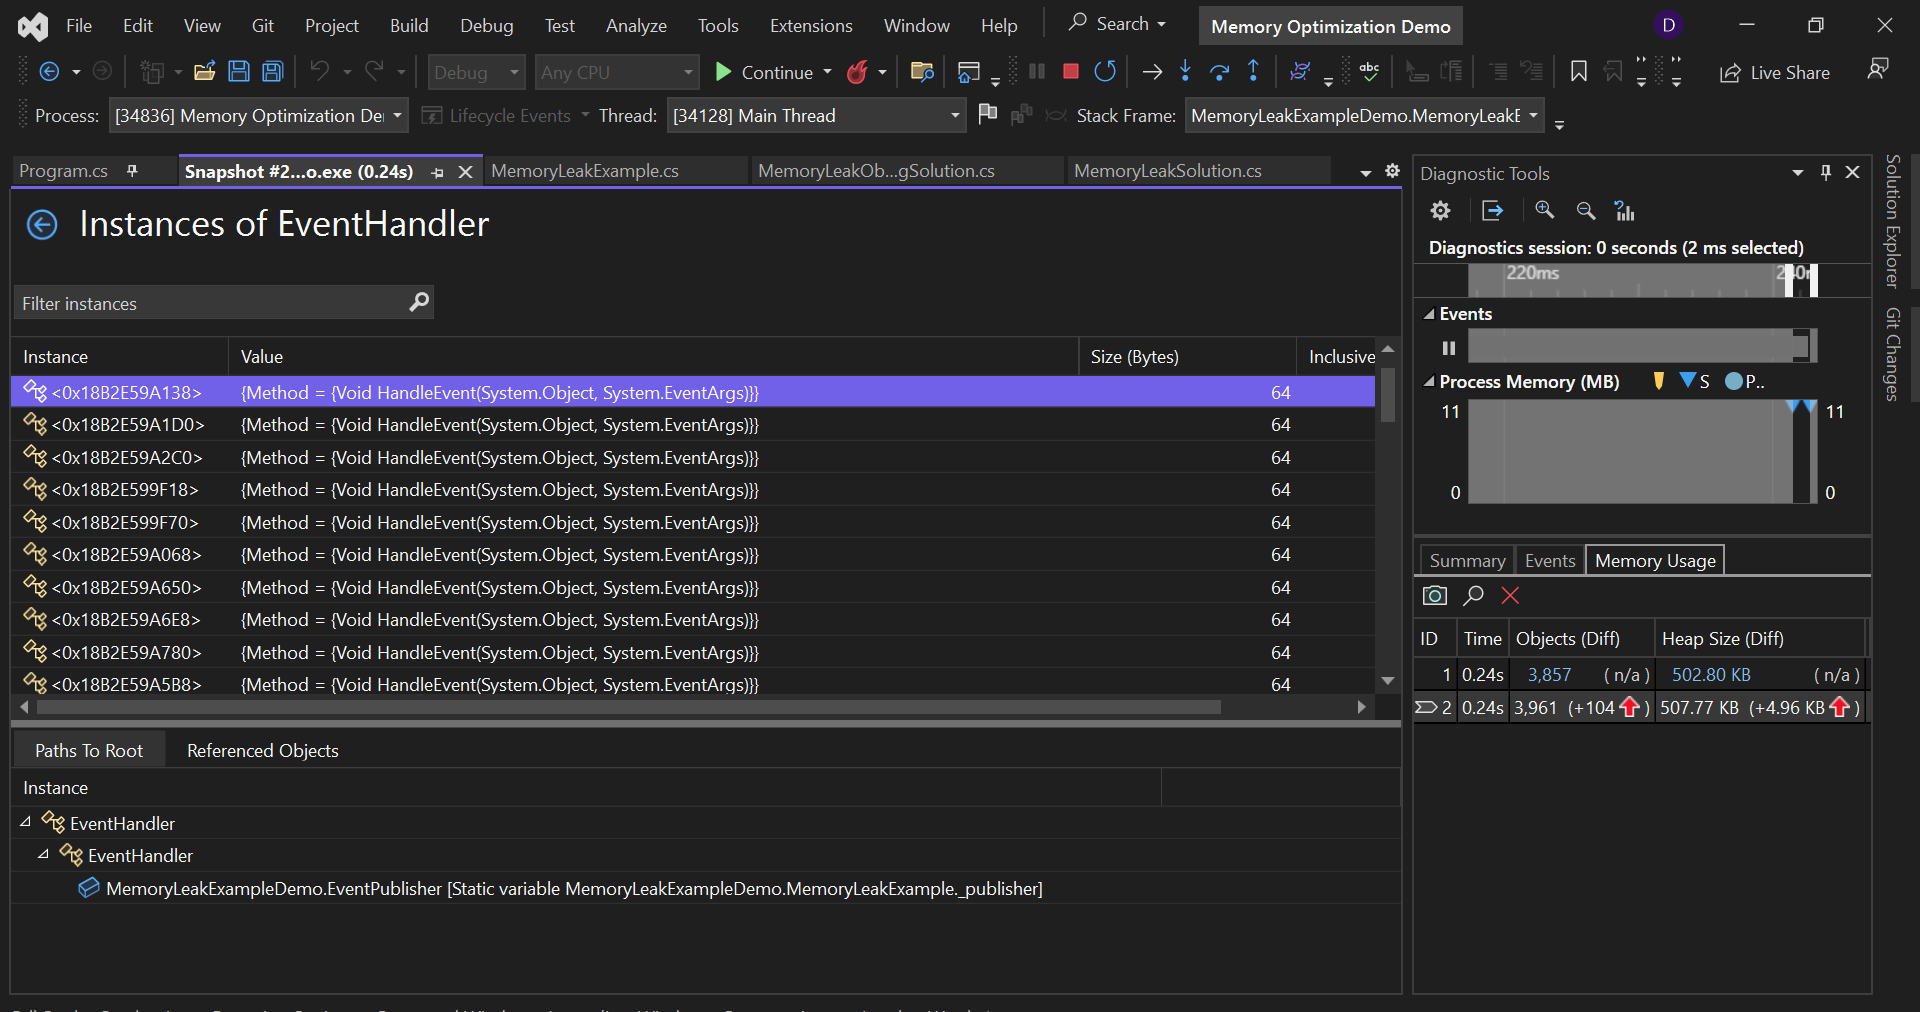 Fig. 4: Instances of EventHandler in the VS Performance Profiler
The image below shows the number of string objects in the cache list:
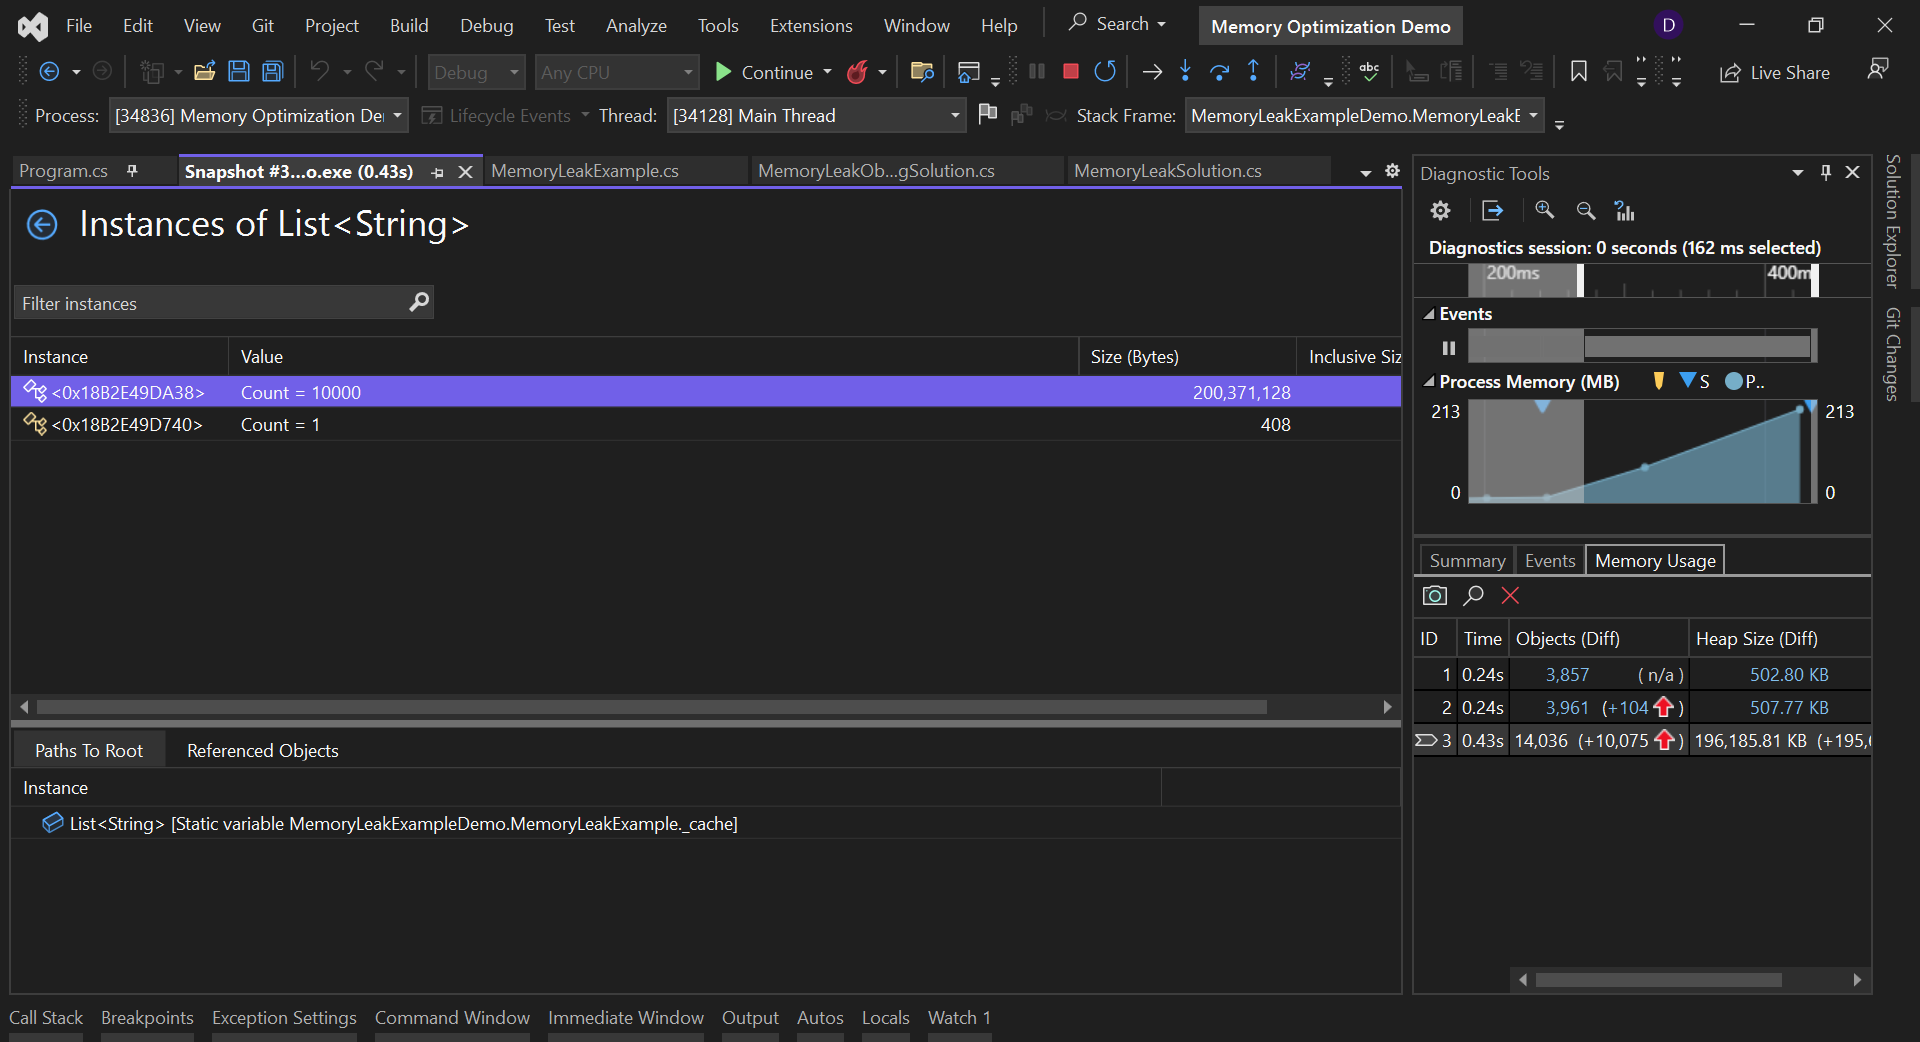 Fig. 5: Instances of List<String> in the VS Performance Profiler
Using WinDbg with the SOS Debugging Extension (.loadby sos clr for .NET 4.0 or later) allows you to inspect the managed heap for instances of reference types using the !dumpheap -stat command. Run your application, then start WinDbg and attach it to the application process using File > Attach to a Process.
WinDbg provides a complete list of objects in the heap, which you can review to identify objects with a large TotalSize value:
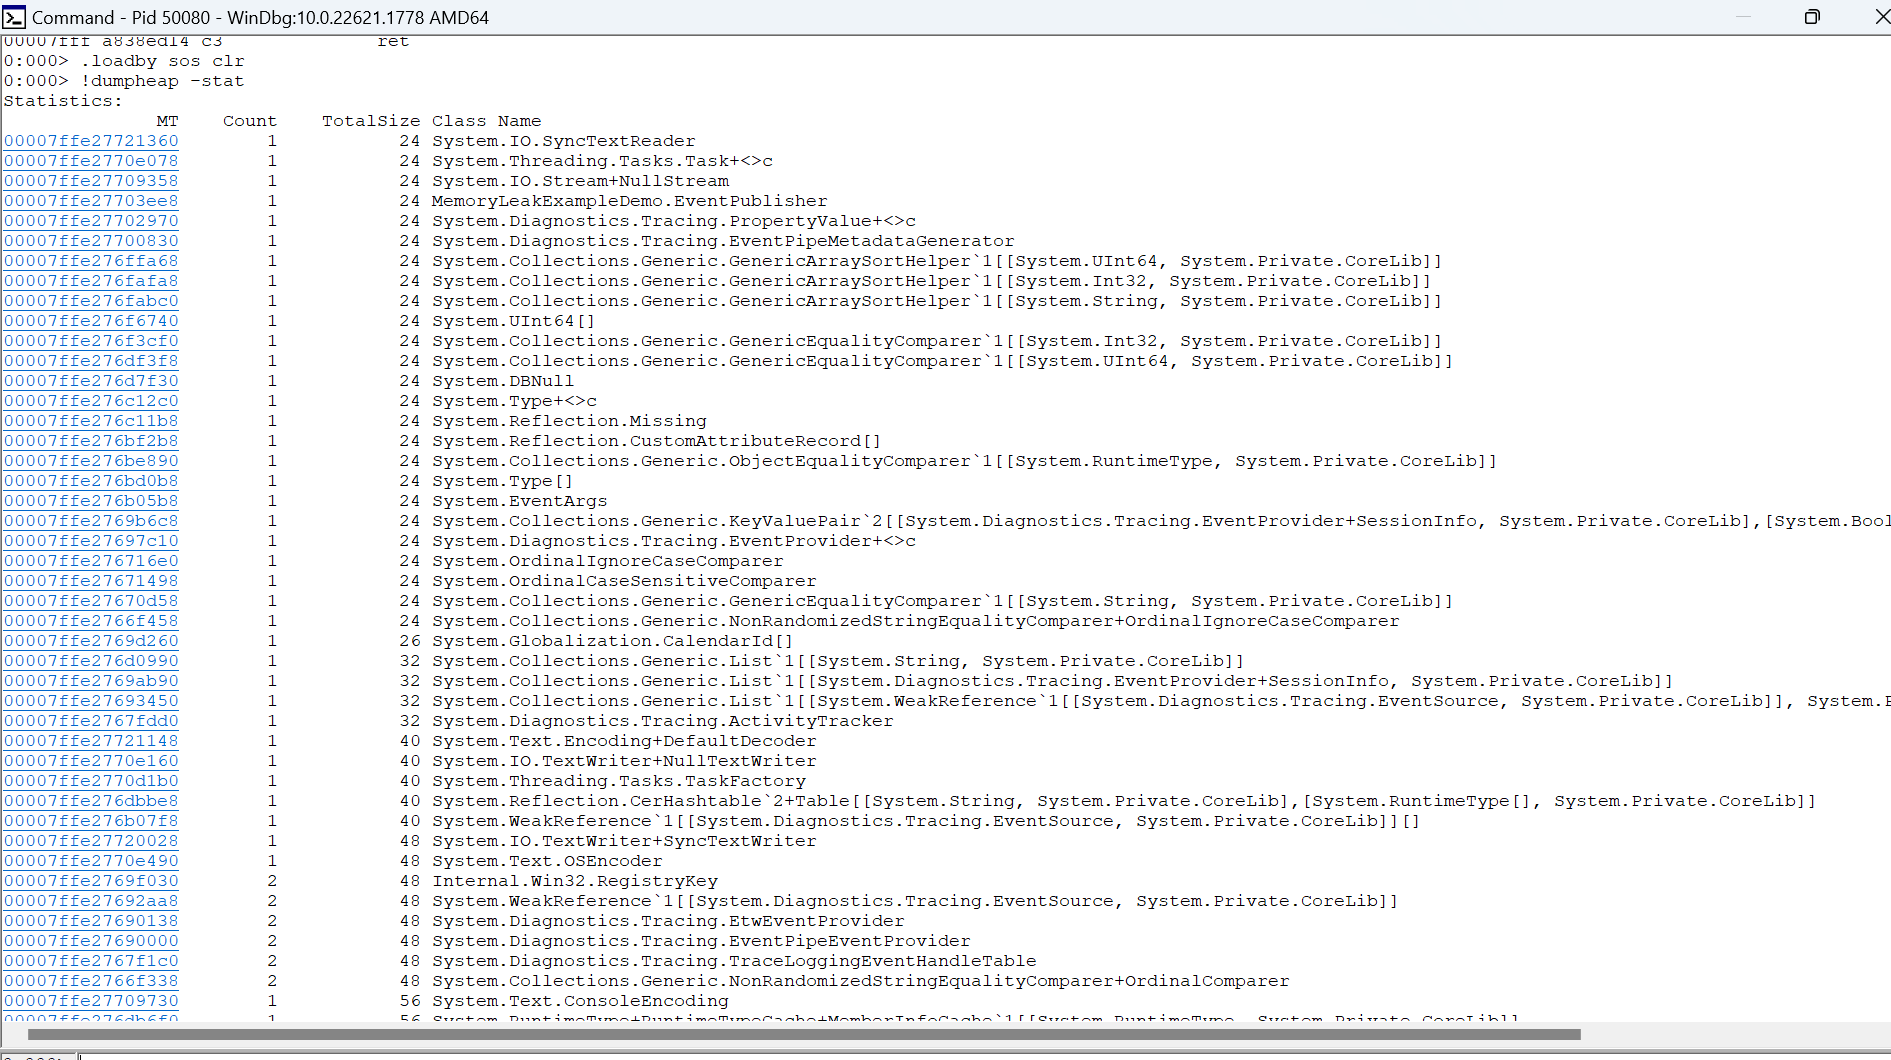 Fig. 6: WinDbg dump heap
If you filter using the command !dumpheap -type, you can then find all the objects of type EventSubscriber:
!dumpheap -type EventSubscriber
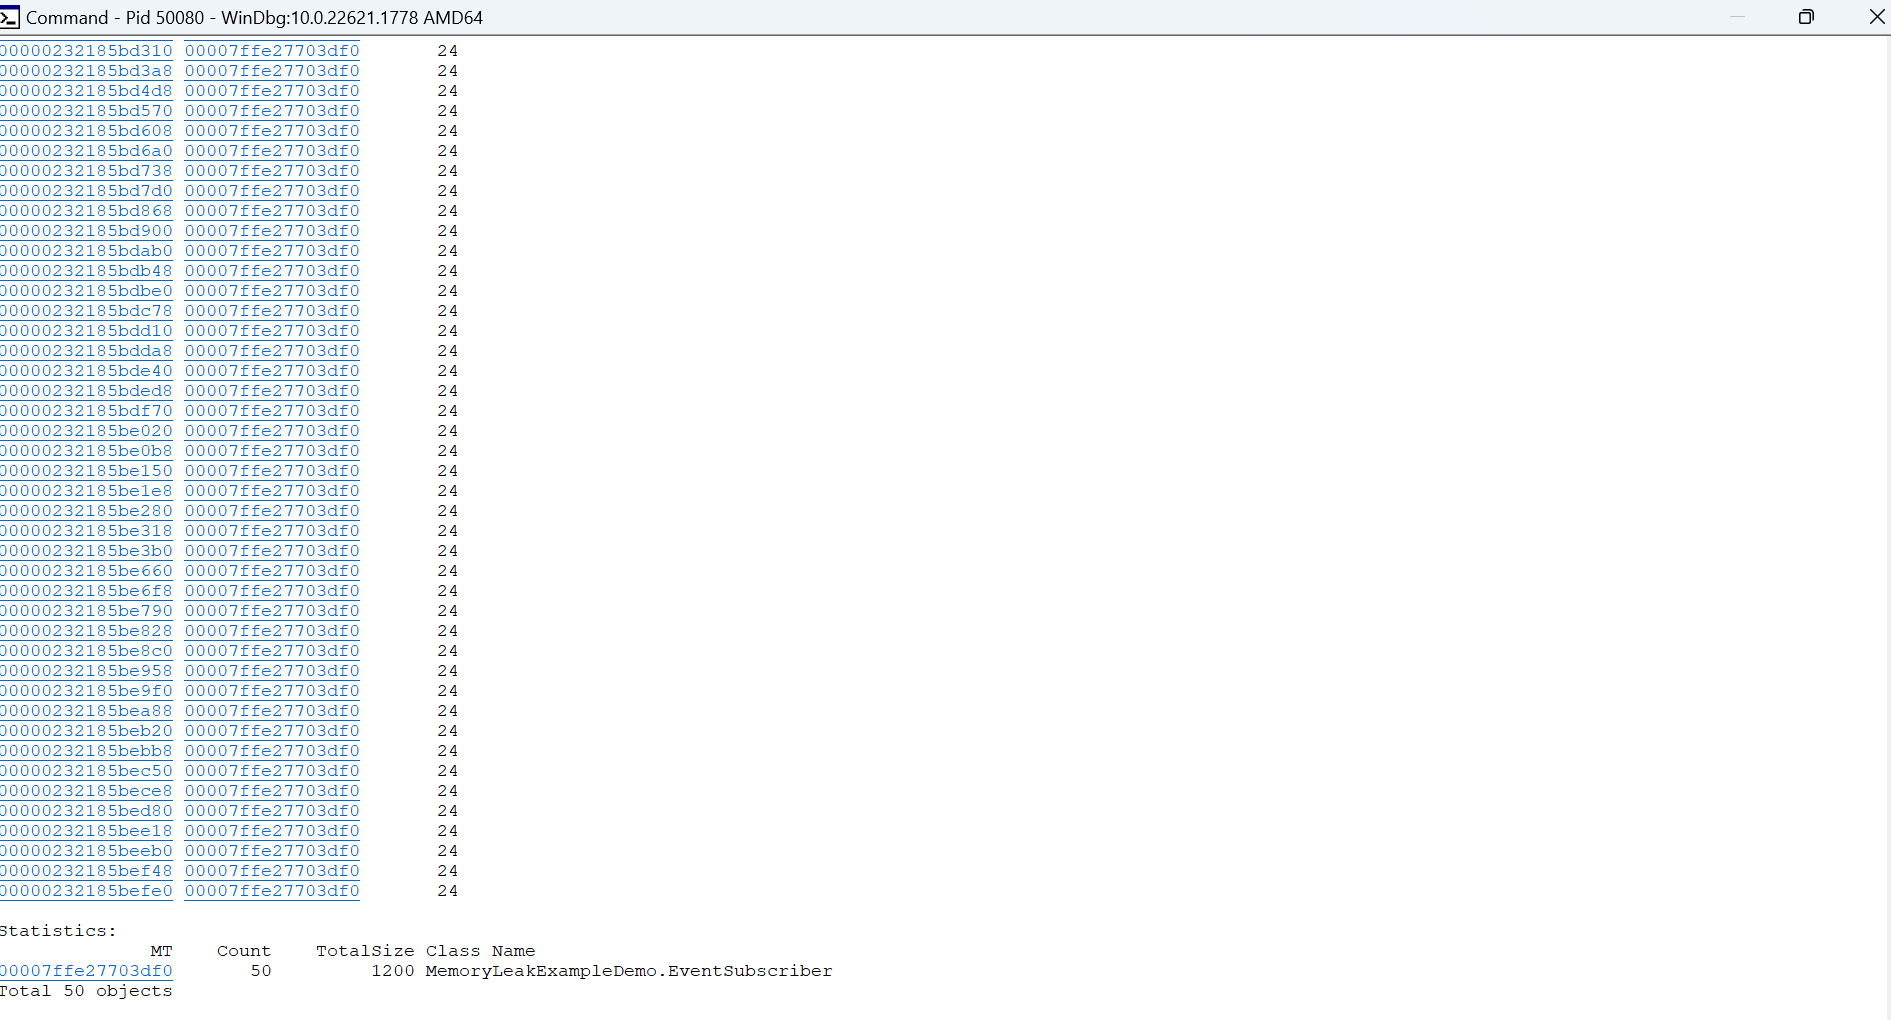 Fig. 7: WinDbg dump heap filtered by EventSubscriber
To further investigate the relationships and trace the path to the root object, you can employ the !gcroot command along with the address of one of the objects from the filtered list. This command lets you traverse the object graph and determine the root object in the hierarchy:
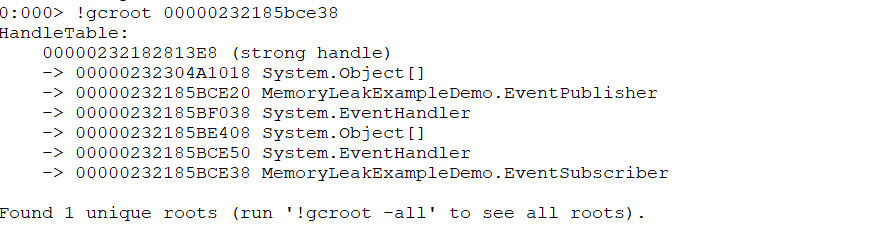 Fig. 8: WinDbg GCRoot command to see path to root object
Site24x7 is a leading provider of comprehensive monitoring solutions. Our AI-powered APM tool is a comprehensive solution that allows you to track critical performance metrics in real-time to enhance reliability, increase security and improve overall application performance.
There are various techniques in the .NET Framework 4.5 for resolving memory issues.
IDisposable InterfacesClasses that implement the IDisposable interface can specify a Dispose() method, enabling explicit disposal of objects that encapsulate unmanaged resources. You have the option to explicitly invoke Dispose() to release file handles or database connections, unsubscribe from events, and perform necessary cleanup operations. Moreover, IDisposable also offers the Finalize() method, used for cleanup before garbage collection. However, it's important to note that Finalize() is nondeterministic and can delay resource release. Use Finalize() only when needed, such as to perform explicit cleanup for file handles or network connections.
In the code block below, the EventPublisher class implements the IDisposable interface and disposes of the event by setting SomeEvent to null in the Dispose() method:
public class EventPublisher : IDisposable
    {
        public event EventHandler SomeEvent;

        public void DoSomething()
        {
            Console.WriteLine("EventPublisher: Doing something...");
            SomeEvent?.Invoke(this, EventArgs.Empty);
        }

        public void Dispose()
        {
            SomeEvent = null;
        }
    }
using Blocksusing blocks provide a convenient way to ensure the proper disposal of resources that implement the IDisposable interface. When you enclose code within a using block, all resources declared within that block are automatically disposed of when the code goes out of scope. The key advantage of a using block is that it guarantees the invocation of the Dispose() method even if an exception is thrown during the execution of the code. This ensures that resources are appropriately released and cleaned up, promoting efficient and reliable resource management.
In contrast to the original code sample, this code places the instantiation of EventSubscriber and the subscription to the SomeEvent event inside a using block to ensure that the event subscriptions are properly removed:
using (_publisher = new EventPublisher())
{
    // Create an instance of EventSubscriber
    for (int i = 0; i < 50; i++)
    {
        using (EventSubscriber subscriber = new EventSubscriber();)
        {
            _publisher.SomeEvent += subscriber.HandleEvent;
        }
    }
}
GC.Collect()The GC.Collect() method allows developers to manually trigger an immediate garbage collection cycle. Although the garbage collector automatically manages memory, there are scenarios where explicitly invoking GC.Collect() can be beneficial (for instance, when working with unmanaged resources or situations that require immediate memory reclamation).
Excessive or unnecessary use of GC.Collect() can degrade performance, so it should only be used where it resolves memory issues or increases application performance.
Making calls to GC.Collect() and GC.WaitForPendingFinalizers() explicitly triggers garbage collection and waits for any pending finalizers to complete so that the memory occupied by the disposed objects can be reclaimed. You can do this with the following code:
GC.Collect();
GC.WaitForPendingFinalizers();
Object pooling is a memory optimization technique that uses a pool of reusable objects instead of creating new objects. It helps prevent memory issues by reusing objects instead of repeatedly creating and disposing of them. When a new object is needed, the pool manager allocates one from the pool of existing objects. This minimizes the overhead associated with creating and destroying objects, especially for frequently used or short-lived objects.
To solve the memory issues in the example using object pooling, add the ObjectPool<T> class to pool EventSubscriber objects:
public class ObjectPool<T> : IEnumerable<T> where T : class, IDisposable, new()
{
private readonly Stack<T> _objects = new Stack<T>();
public T GetObject()
{
if (_objects.Count > 0)
return _objects.Pop();
return new T();
}
public void ReturnObject(T obj)
{
obj.Dispose();
_objects.Push(obj);
}
public IEnumeratorGetEnumerator()
{
return _objects.GetEnumerator();
}
IEnumerator IEnumerable.GetEnumerator()
{
return GetEnumerator();
}
}
Inside the Run() method, the object pool for EventSubscriber is created using the ObjectPool<T> class:
_subscriberPool = new ObjectPool<EventSubscriber>();
Instances of EventSubscriber are created from the object pool using the GetObject() method:
for (int i = 0; i < 50; i++)
{
    EventSubscriber subscriber = _subscriberPool.GetObject();
    subscriber.HandleEvent += HandleEvent;
    _publisher.SomeEvent += subscriber.OnHandleEvent;
}
Using the ReturnObject() method, EventSubscriber instances are returned to the object pool when they are no longer needed:
foreach (EventSubscriber subscriber in _subscriberPool)
{
    subscriber.HandleEvent -= HandleEvent;
    _subscriberPool.ReturnObject(subscriber);
}
This guide explored the fundamentals of memory optimization in the .NET Framework 4.5 and discussed some common causes of memory issues. You also considered several techniques and tools available that allow you to identify and resolve memory leaks.
Site24x7 is an AI-powered, full-stack monitoring platform that provides comprehensive monitoring capabilities, including application performance monitoring. By applying the discussed techniques and leveraging Site24x7's .NET application monitoring services, your organization can gain visibility into memory consumption, detect memory leaks, and identify areas of high memory utilization to ensure optimal .NET application performance.
Site24x7 APM tracks memory usage, garbage collection (GC) stats, and object allocation rates in real-time, helping you pinpoint memory leaks and inefficient memory usage in your .NET applications.
Yes, Site24x7 provides detailed metrics on Gen 0, Gen 1, and Gen 2 garbage collections, as well as Large Object Heap (LOH) size, helping you optimize GC performance and reduce application pauses.
Site24x7 APM provides production-safe monitoring that captures method-level performance data, memory usage trends, and GC behavior with minimal overhead, allowing you to diagnose memory issues without impacting end-users.