Dashboard
The Digital Risk Analyzer dashboard provides a centralized view of your organization’s digital risk posture. It consolidates key insights across domains and presents them through intuitive charts and widgets, making it easier to track security scores, identify trends, spot recurring risks, and understand how your domains perform over time.
Use cases
You can use the Digital Risk Analyzer dashboard to:
- Gain a quick snapshot of your overall digital risk posture without reviewing individual domain reports.
- Track improvements or regressions in security scores over time.
- Identify high-risk or frequently recurring issues impacting multiple domains.
- Compare best- and worst-performing domains to prioritize remediation efforts.
- Monitor how the number of domains or risks changes over a specific period.
Accessing Dashboard in Digital Risk Analyzer
Follow these steps to access the dashboard:
- Log in to your Digital Risk Analyzer account.
- Navigate to the left panel and select Dashboard.
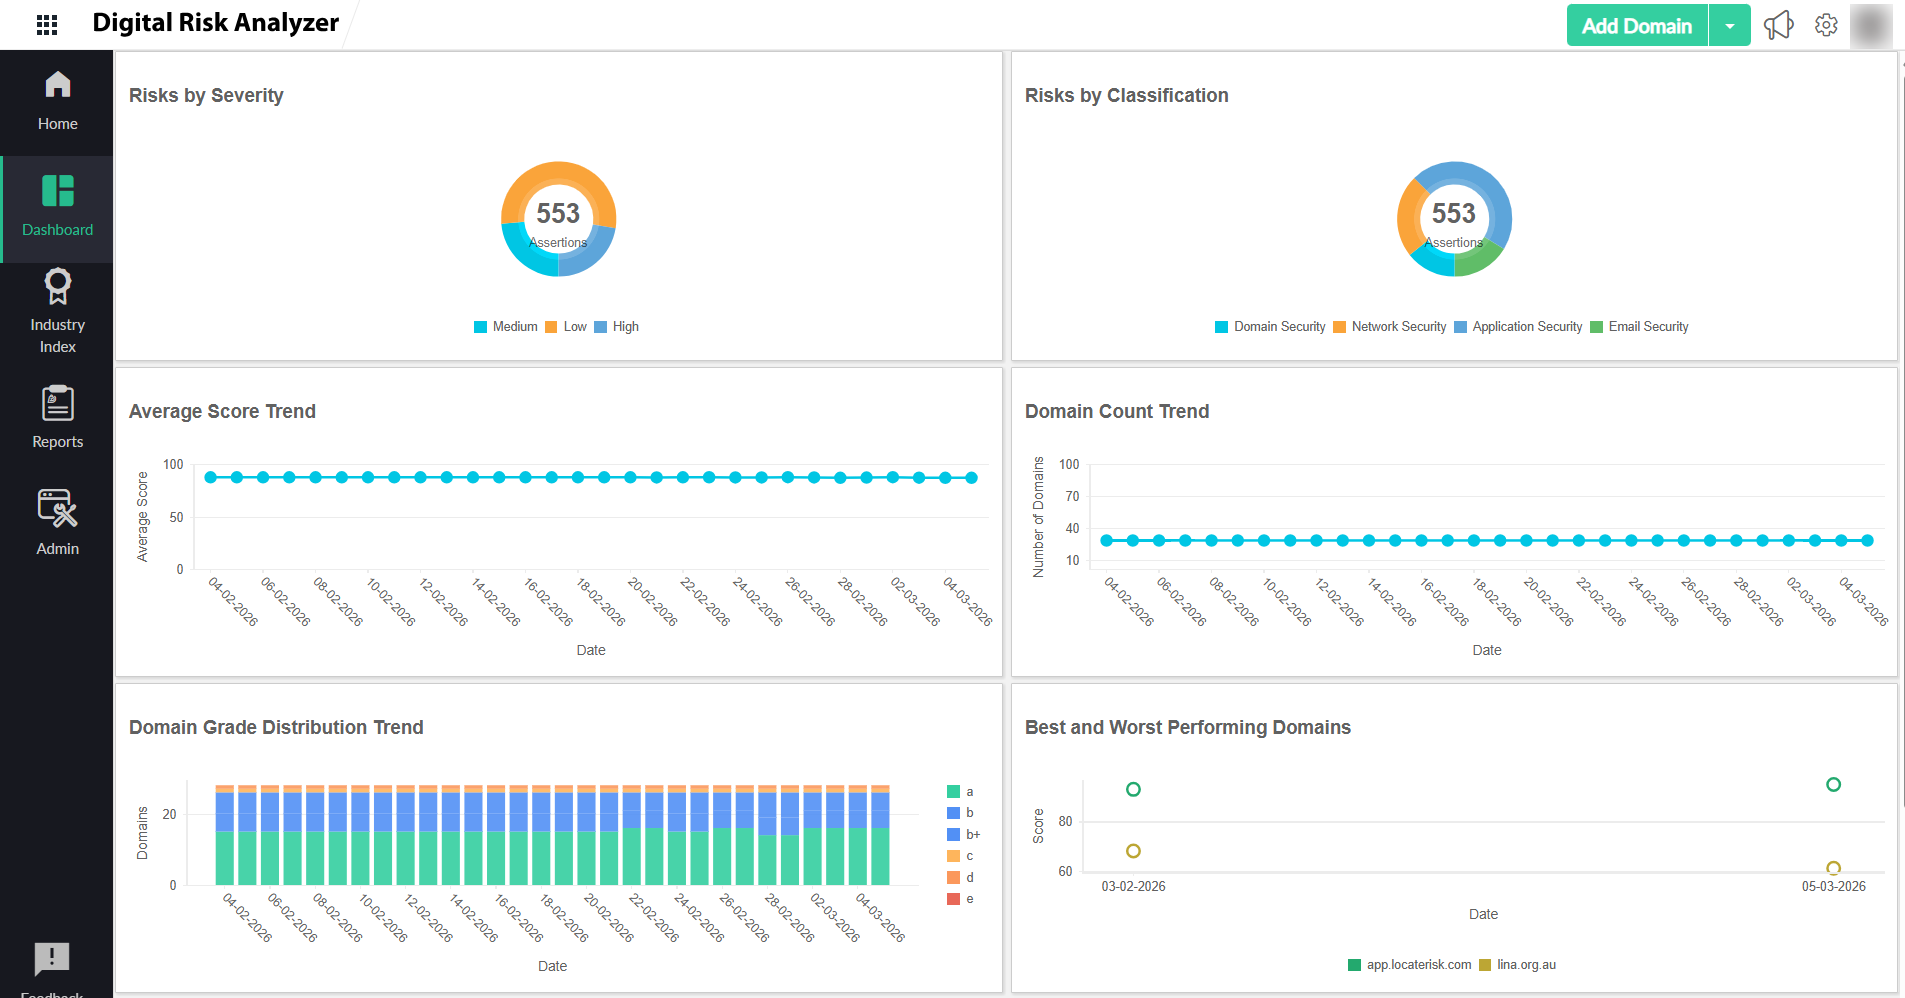
Dashboard widgets
The dashboard in Digital Risk Analyzer includes the following widgets:
- Risks by Severity
This widget displays all identified risks grouped by severity levels such as Low , Medium , and High , helping you understand the overall risk distribution. The total number of risks is shown at the center of the doughnut chart. By clicking on any severity segment, you can navigate to the Risks page, where you can view all risks under that severity level.
- Risks by Classification
This widget categorizes risks based on their security classification, such as Domain Security, Network Security, Application Security, and Email Security . The total number of risks is shown at the center of the doughnut chart. By clicking on any category segment, you can navigate to the Risks page, where you can view all risks under that category.
- Average Score Trend
This widget shows a graph to track the average security score across all monitored domains over time, helping you understand overall improvement or decline. You can hover over each data point in the graph to know the exact score on that specific date.
- Domain Count Trend
This widget shows a graph to track the total number of monitored domains over time, giving visibility into onboarding or removal trends. You can hover over each data point in the graph to know the exact number of domains on that specific date.
- Domain Grade Distribution Trend
This widget illustrates how your domains are distributed across different security grades over a period of time, making it easy to spot shifts in overall security posture. Each data bar is segmented by the grade distribution. You can hover over each segment in a data bar to know the domains distributed in different grades on the specific date.
- Best and Worst Performing Domains
This widget highlights domains with the most significant improvement and the greatest decline in security grades, helping you prioritize remediation efforts effectively. Score changes are calculated by comparing the current security score with the previous score. Hover over a data point to view the date, score, and domain name.
- Most Common Risks
This widget lists the most commonly occurring risks across all your monitored domains. And by clicking on the count of any risk, you can navigate to the Risks page, where you can view the number of affected domains and detailed risk information.
- Domain Risk Distribution Trend
This widget visualizes how the total number of identified risks changes over time along with their severity, helping you understand whether risk exposure is increasing or decreasing. Each data bar is segmented by the severity level of the risk. You can hover over each segment in a data bar to know the number of risks and their severity on that specific date.
The Digital Risk Analyzer dashboard is designed to provide high-level insights. For detailed analysis, you can drill down into individual domains and associated risk details.
Understanding the Risks page
The Risks page provides a consolidated view of all identified security and configuration risks across your monitored domains. Each risk entry includes details such as the affected domain, severity level, classification type, and the date it was first detected. This helps you quickly assess, prioritize, and track issues.
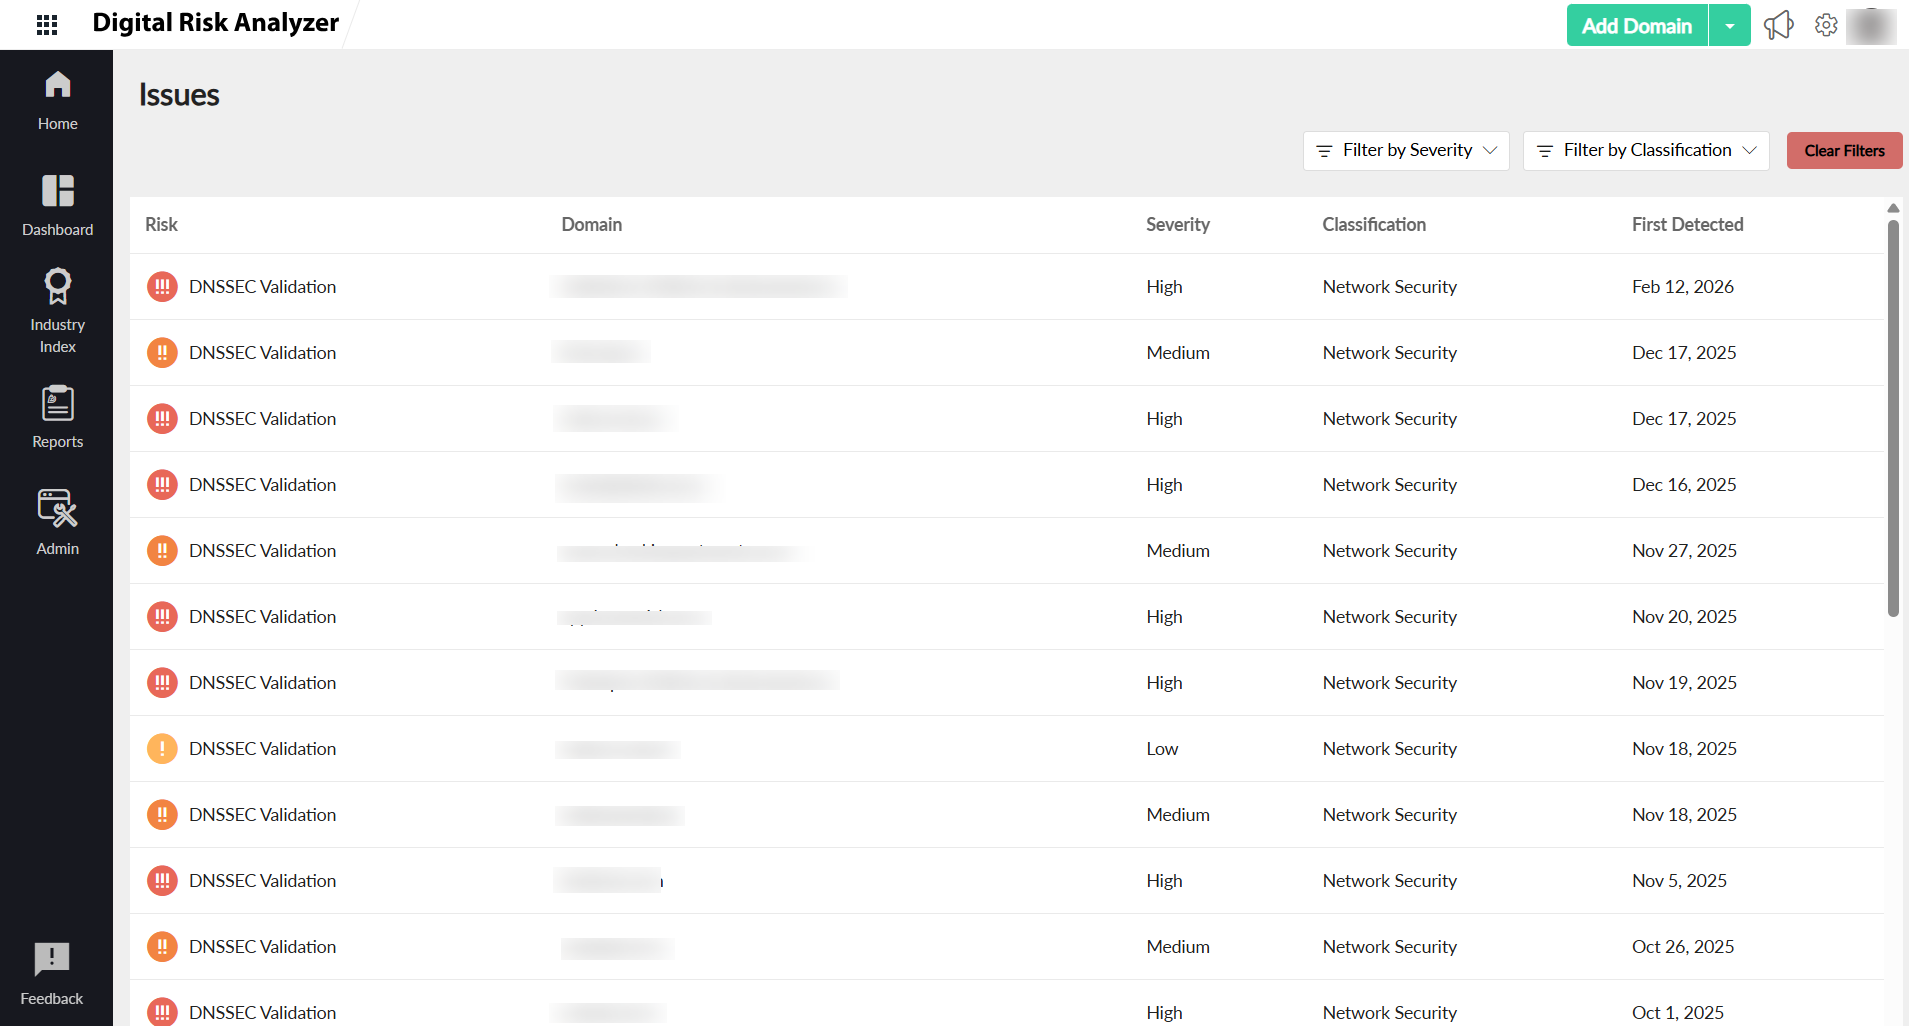
This page helps you isolate relevant risks and streamline investigation and remediation with the following options:
- Filter by Severity: Allows you to narrow down risks based on severity levels such as Low, Medium, and High to focus on critical issues first.
- Filter by Classification: Allows you to view risks by classification type such as Domain Security, Network Security, Application Security, and Email Security to analyze issues within a specific security area.
- Clear Filters: Resets all applied filters to return to the complete list of risks.