
Microsoft SQL Server monitoring
Effortlessly track, analyze, and optimize Microsoft SQL Server performance to maximize uptime and performance with Site24x7’s unified SQL monitoring solution.
 AI insights for faster resolution
 Improved queries with fewer bottlenecks
 Proactive alerts & auto-remediation
 Visibility into storage, memory & resources


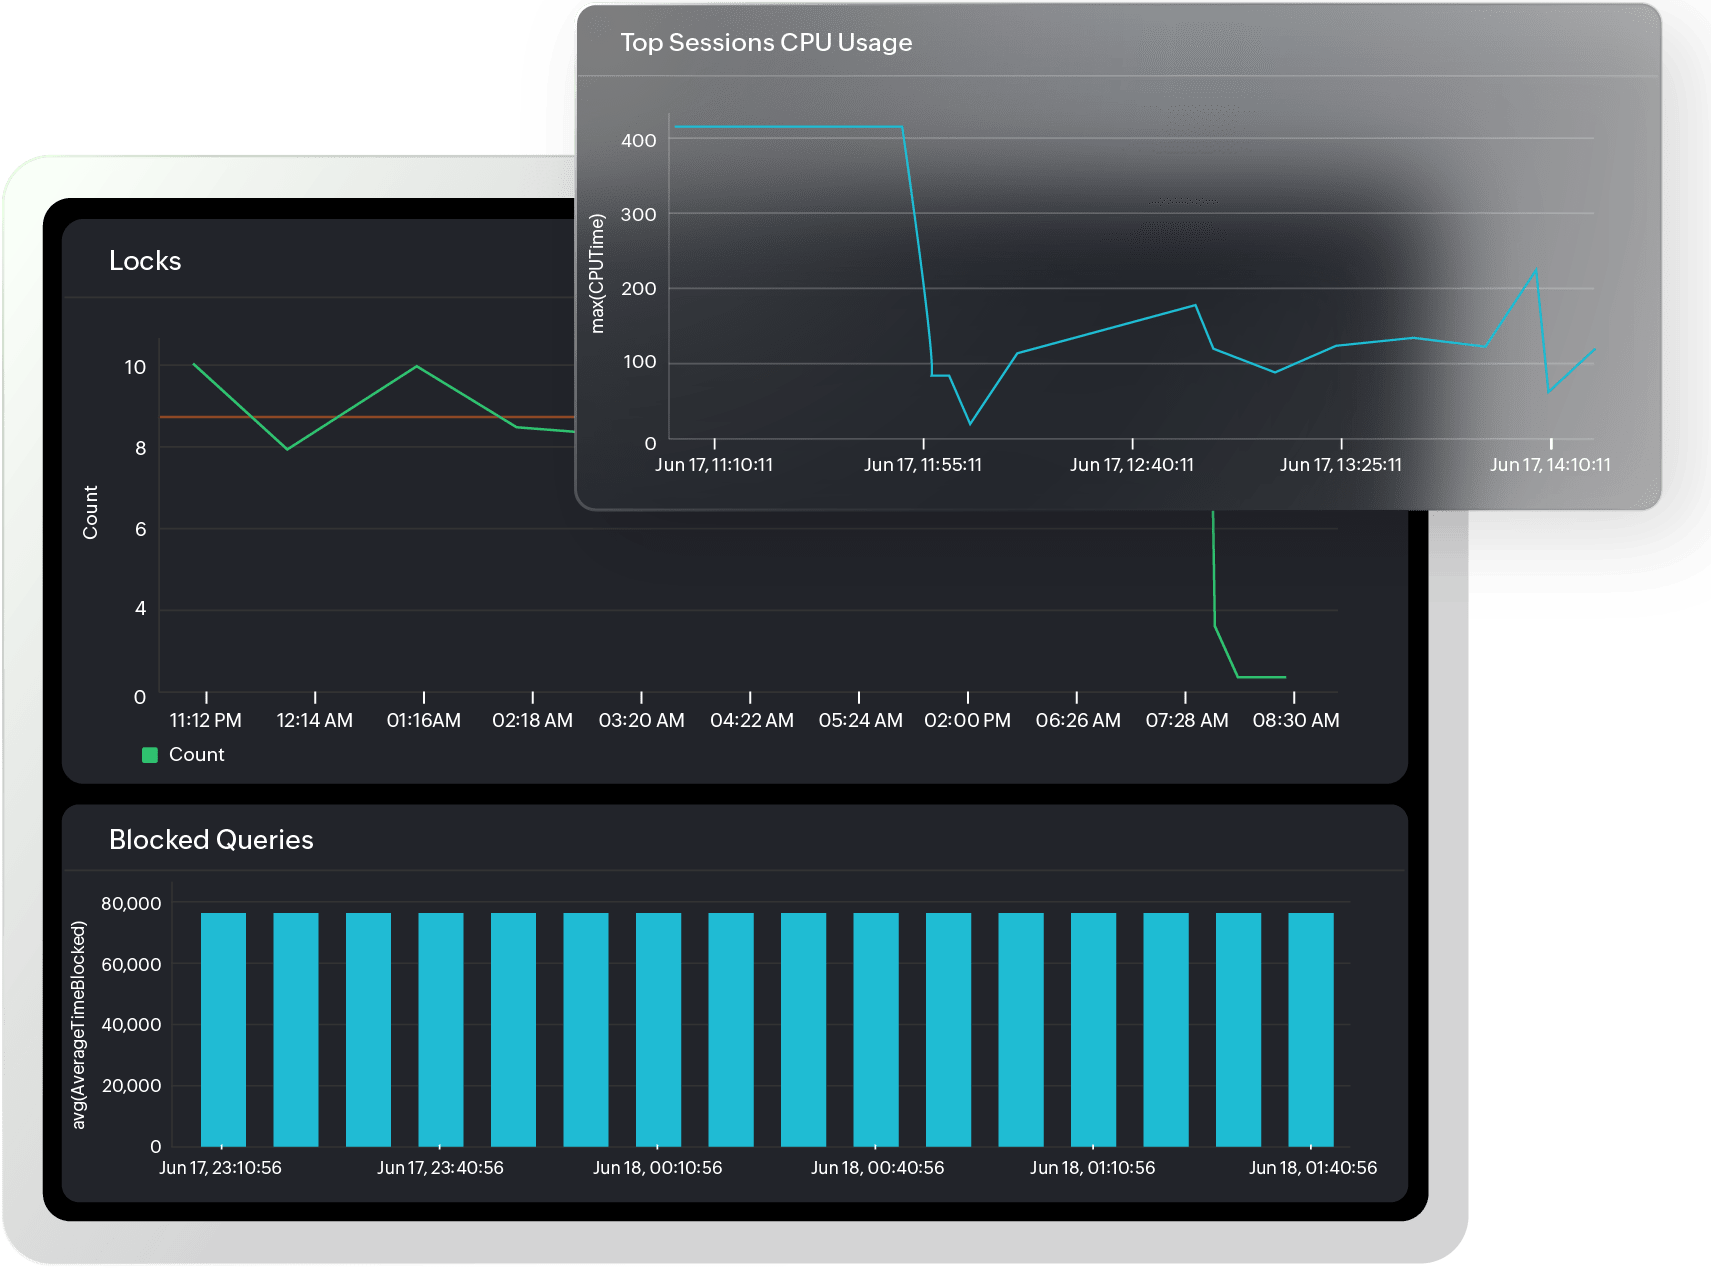
Boost SQL Server performance with comprehensive Wait-Time Analysis
Connect SQL bottlenecks directly to user-facing performance issues. Gain instant visibility into database resource contention to ensure responsive, optimized SQL Server workloads.
- Wait-Time Analysis to pinpoint the exact cause of database delays.
- SQL execution times and slow-running queries.
- Query response times and execution bottlenecks impacting end users.
- Resource contention monitoring across the database environment.
- Comprehensive SQL Server job monitoring.
Insightful query monitoring for maximum efficiency
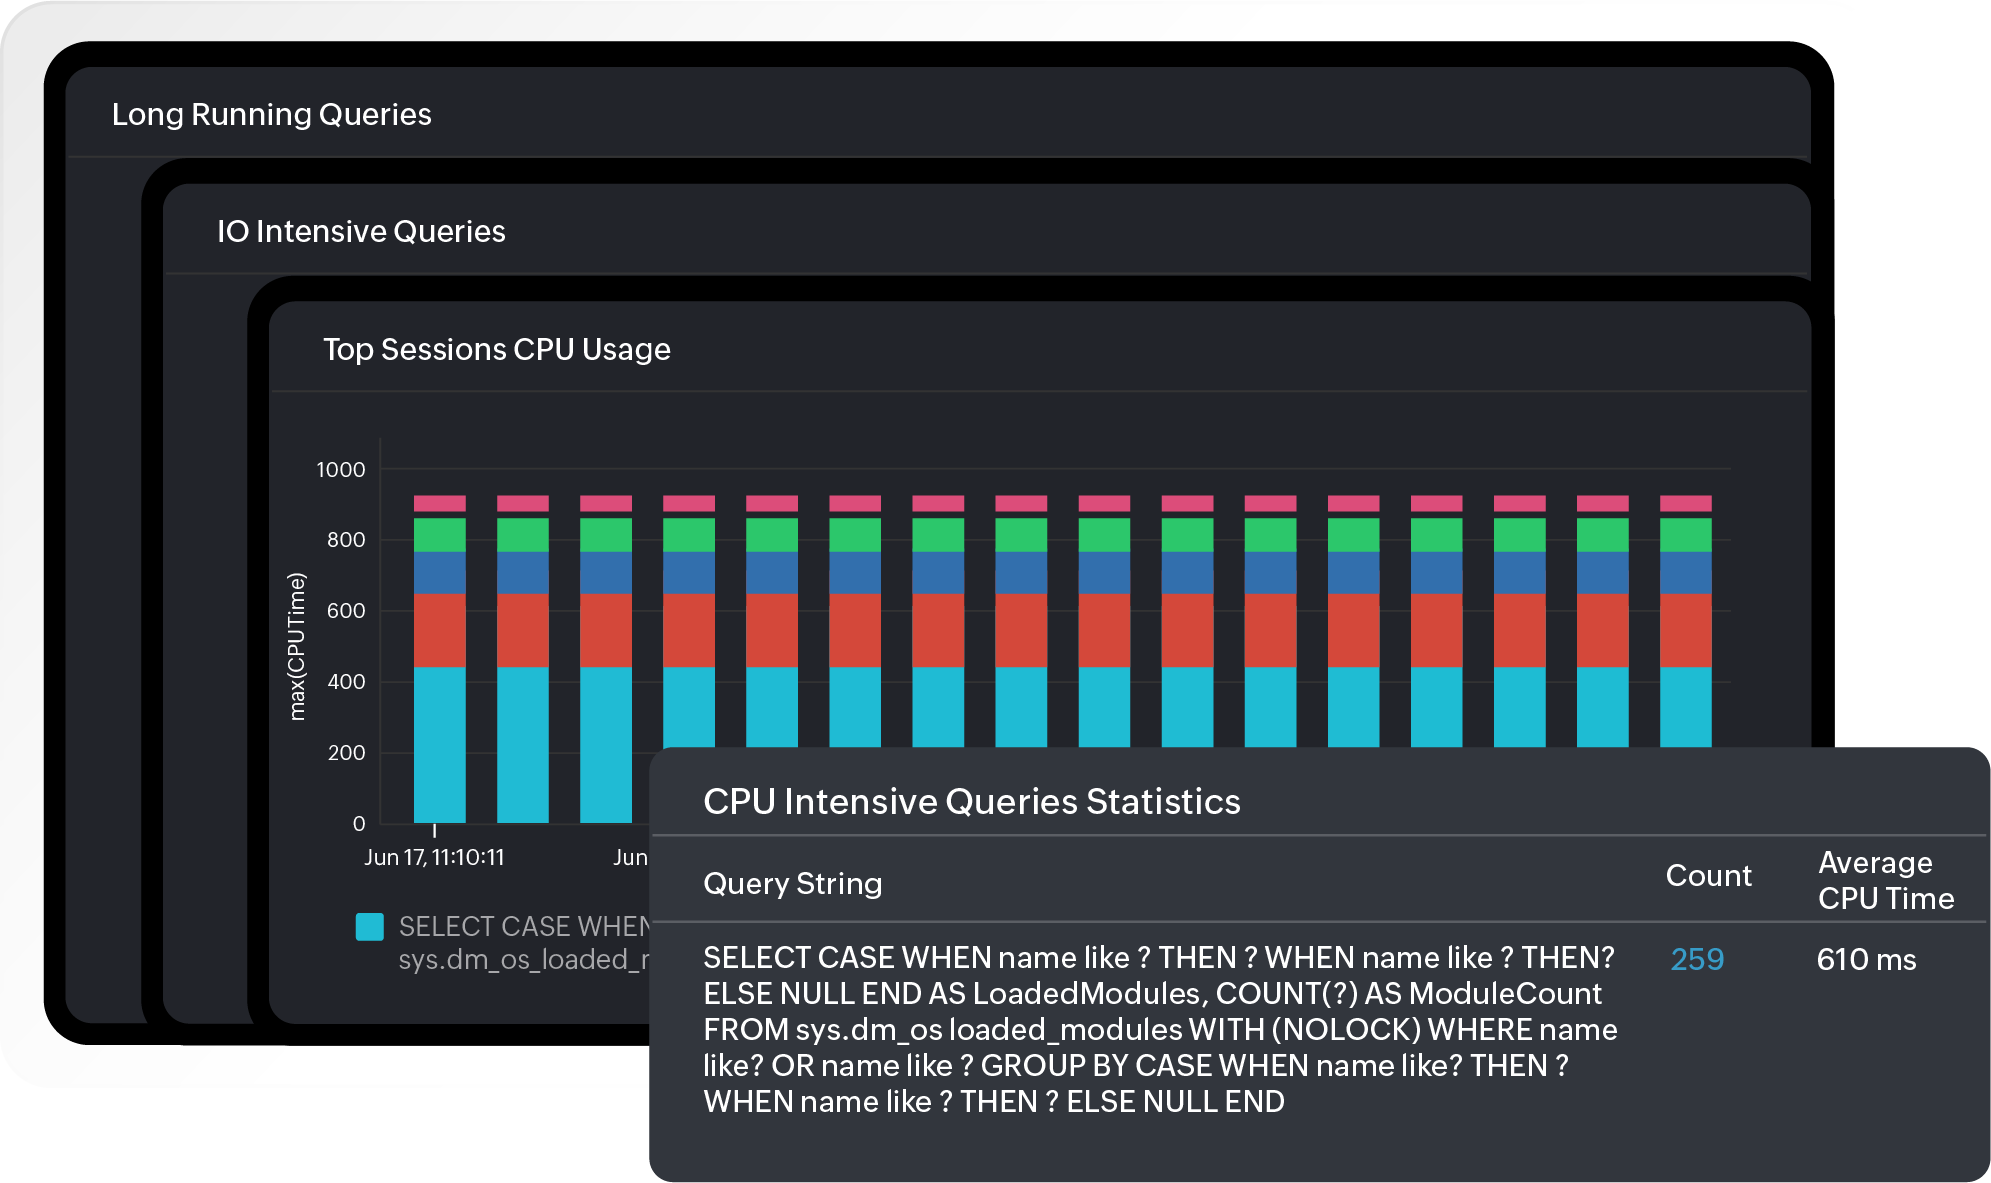
Track the execution of every query and index, identify slow-running queries, and improve overall performance with detailed, actionable insights.
Benefits:
- Track deadlocks and map blocking chains to rapidly resolve contention.
- Visualize query execution paths for deeper optimization and tuning.
- Identify expensive queries consuming excessive CPU or I/O resources.
- Prioritize query optimizations to reduce load and improve response time.
Unified database monitoring across hybrid deployments
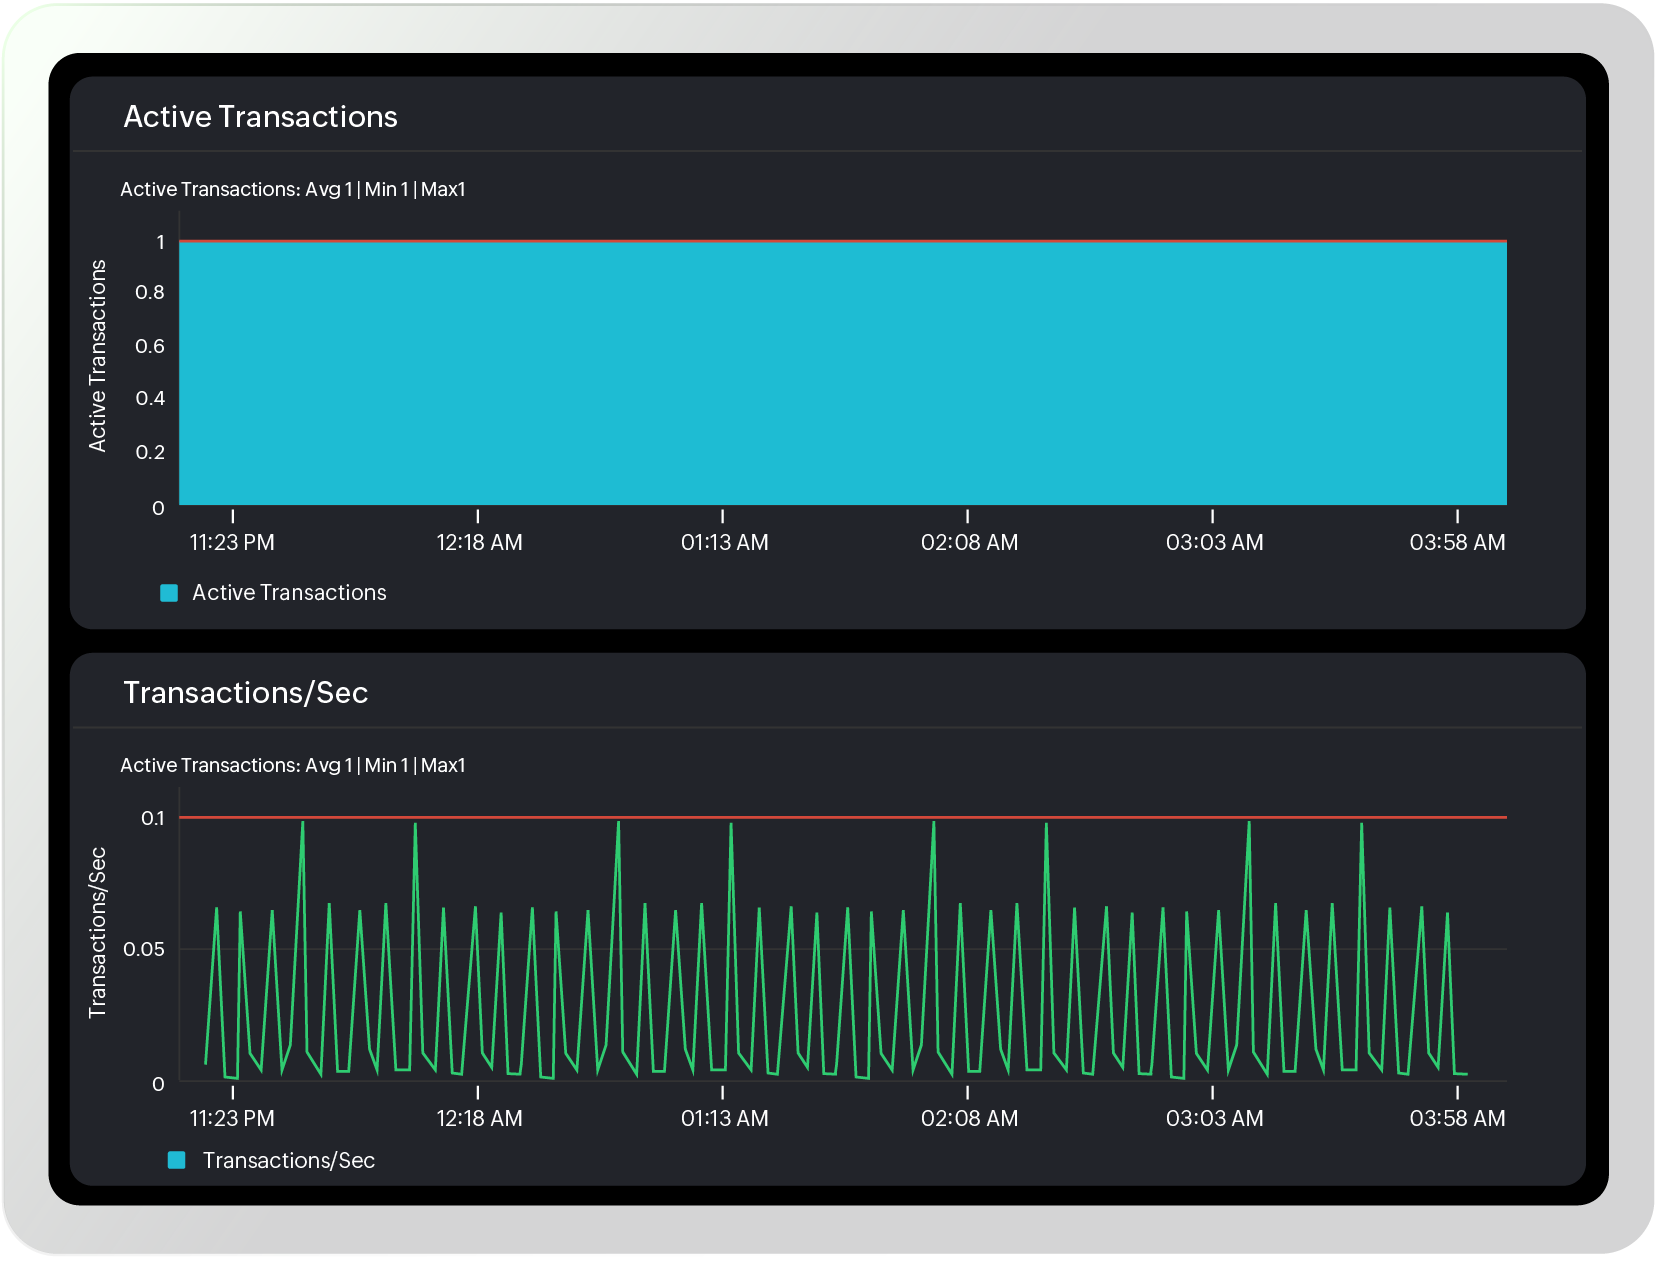
Dive deeper into the operational health of your databases. Monitor on-premises deployments seamlessly and cloud-hosted instances like Azure SQL and Amazon RDS to ensure optimal functioning everywhere.
Monitor and analyze:
- Database state, size, and transaction throughput for cloud and on-prem instances.
- Active connections and SQL Server agent job execution.
- Buffer manager statistics, like page reads, page writes, and buffer cache hit ratio.
- Compilation and recompilation rates and query batch requests.
- TempDB usage.
- Log flushes, I/O stats, and backup operations.
Plan ahead with storage and growth forecasting
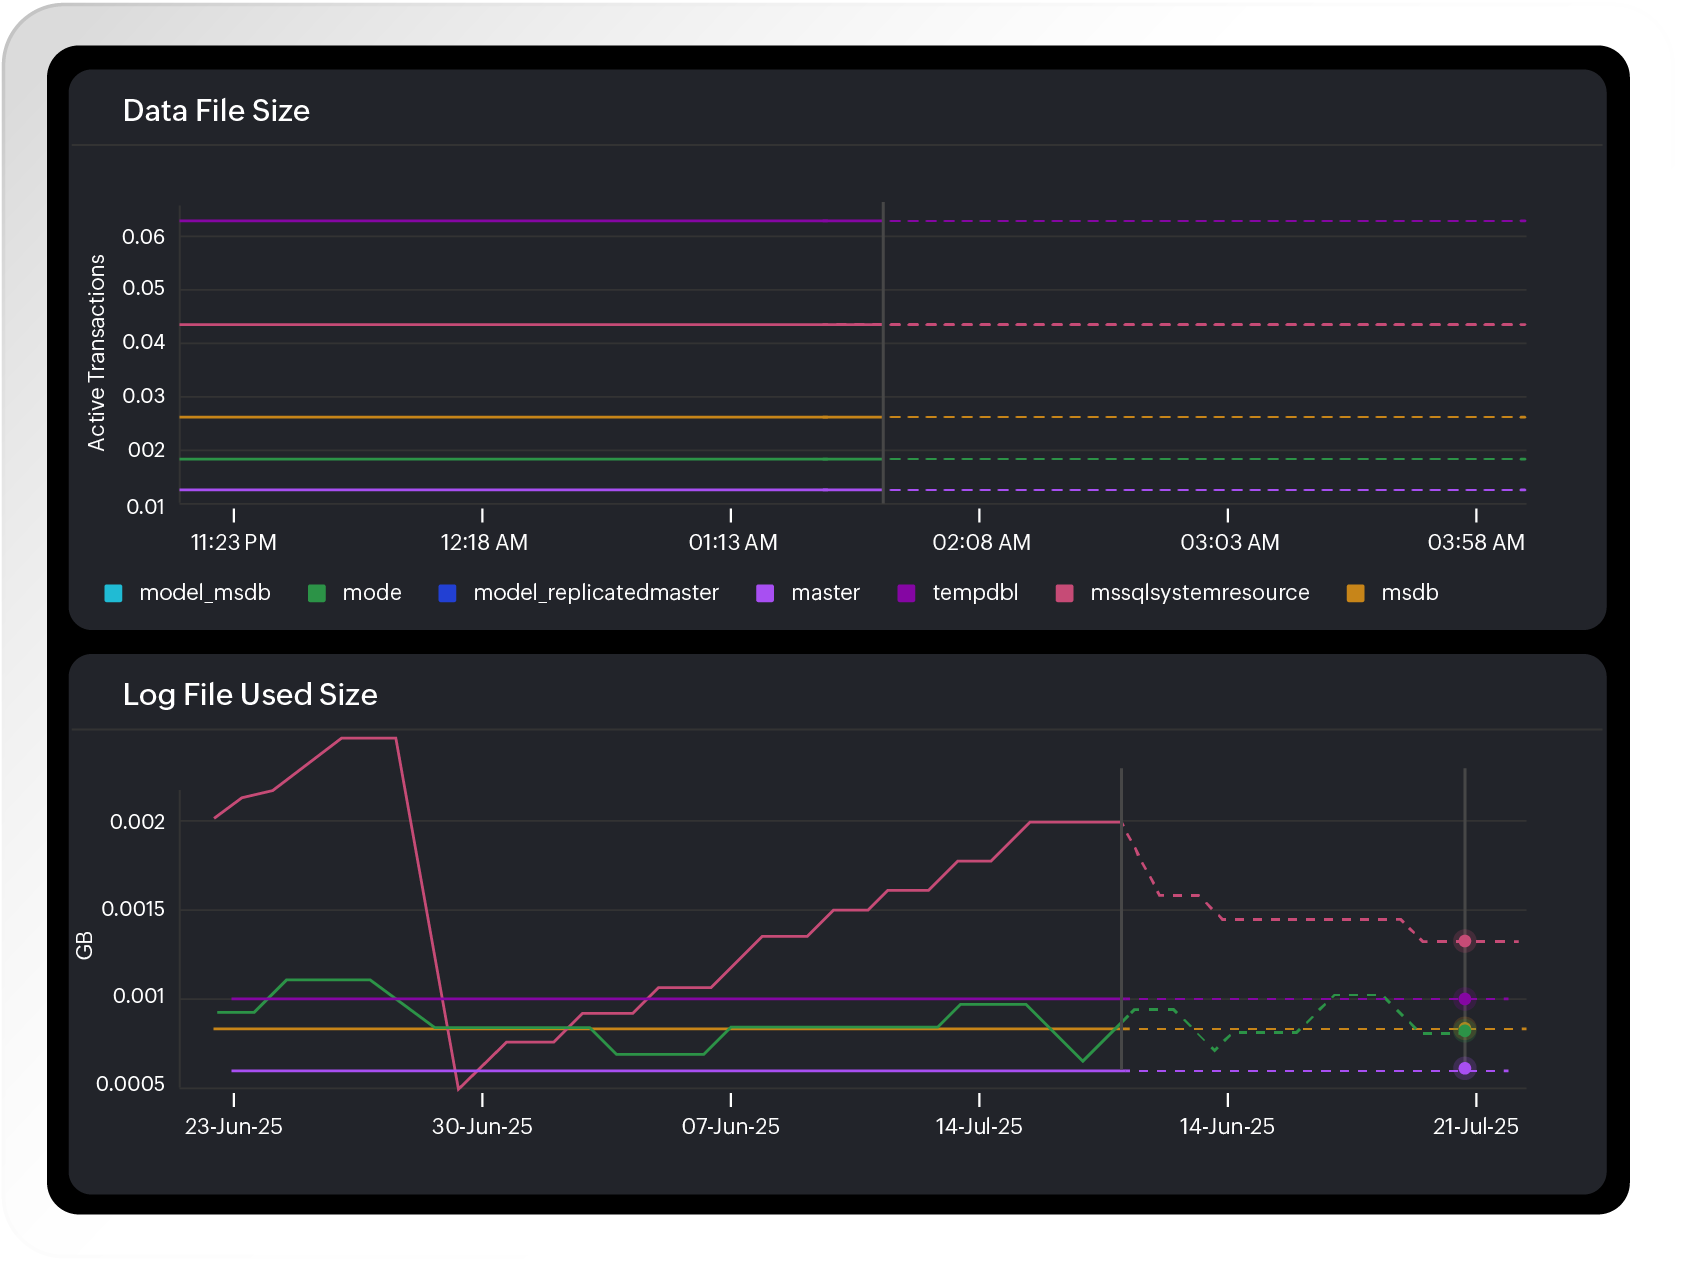
Monitor TempDB, file usage, and transaction log sizes with predictive analytics to avoid outages and scale smartly.
Key capabilities:
- Monitor database file and log sizes.
- Detect sudden data growth and file contention.
- Visualize space usage and trends over time.
- Forecast storage consumption and avoid capacity issues.
Prescriptive, AI-powered alerting for proactive tuning
Go beyond simple alerting. Use intelligent analytics to receive prescriptive tuning advice, showing you exactly how to fix performance dips before users are impacted.
Key features:
- AI-based dynamic thresholds for proactive anomaly detection.
- Prescriptive analysis that suggests actionable tuning recommendations for bottlenecks.
- Auto-remediation workflows to restart services, reallocate resources, or run diagnostics.
- Minimize false positives and reduce alert fatigue.
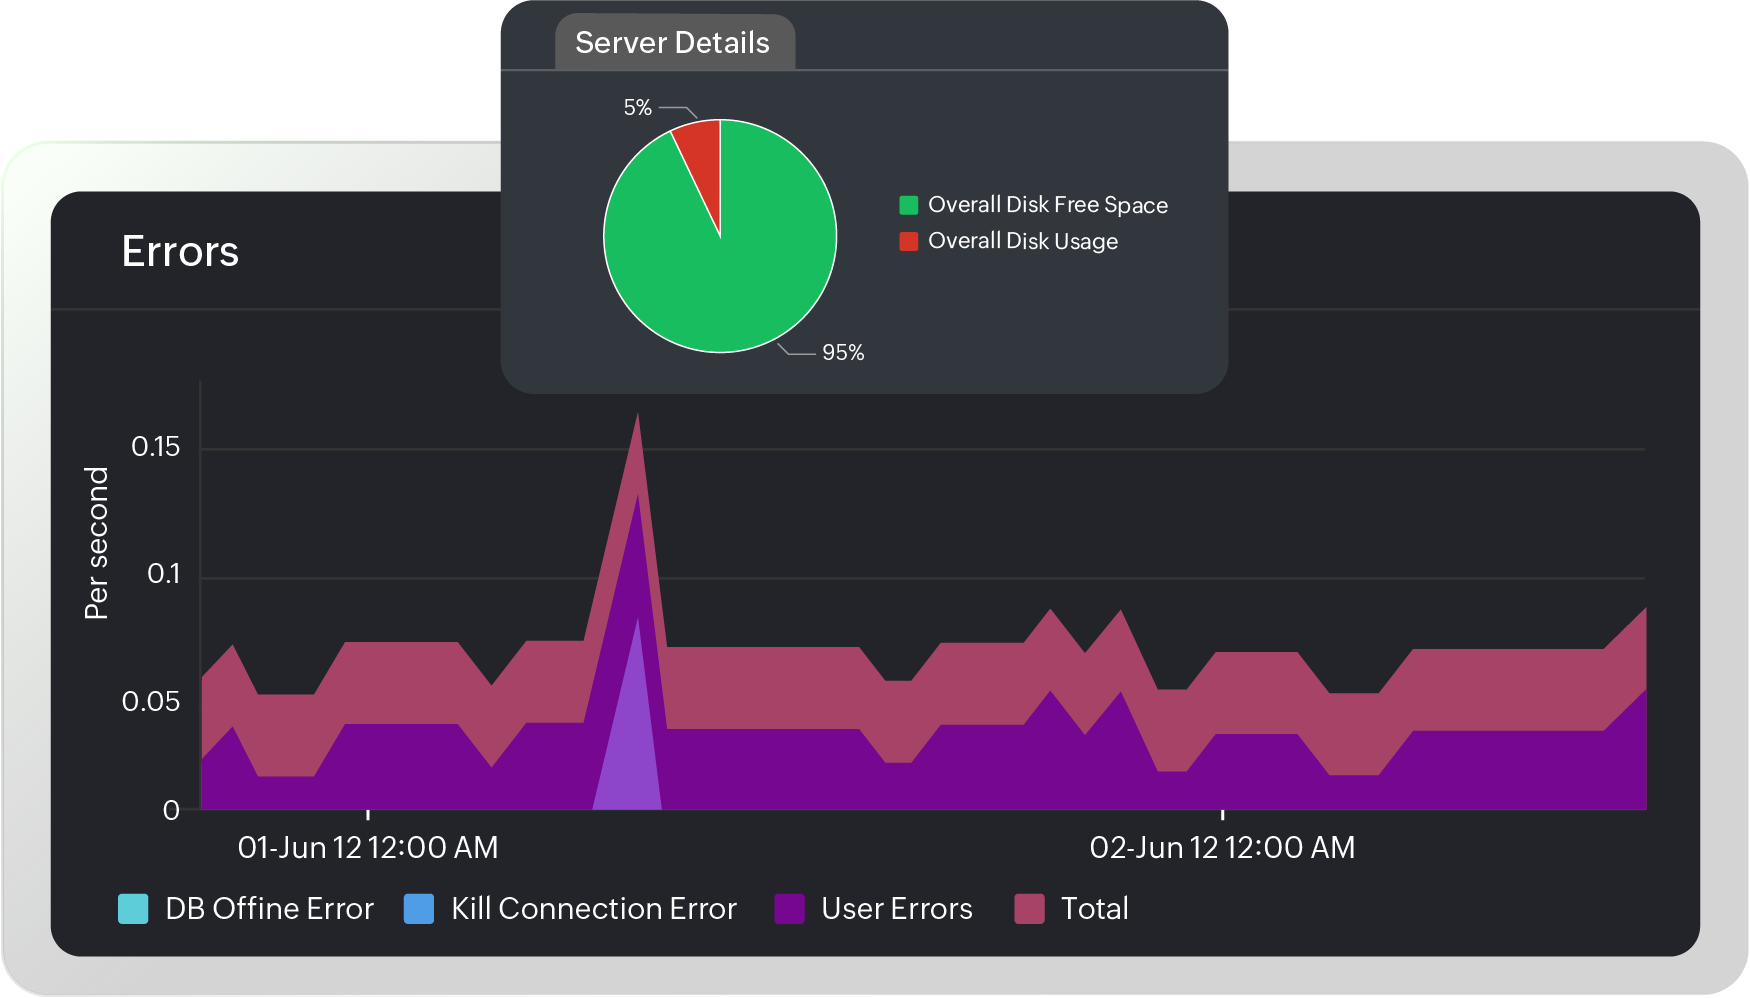
Make smarter decisions with visual dashboards
Track trends, monitor SLAs, and uncover optimization opportunities with prebuilt and customizable visual tools.
Track:
- SQL Server query performance and execution trends.
- Database availability and resource consumption.
- Customizable widgets for detailed monitoring.
- Exportable reports for audits, capacity planning, and performance reviews.
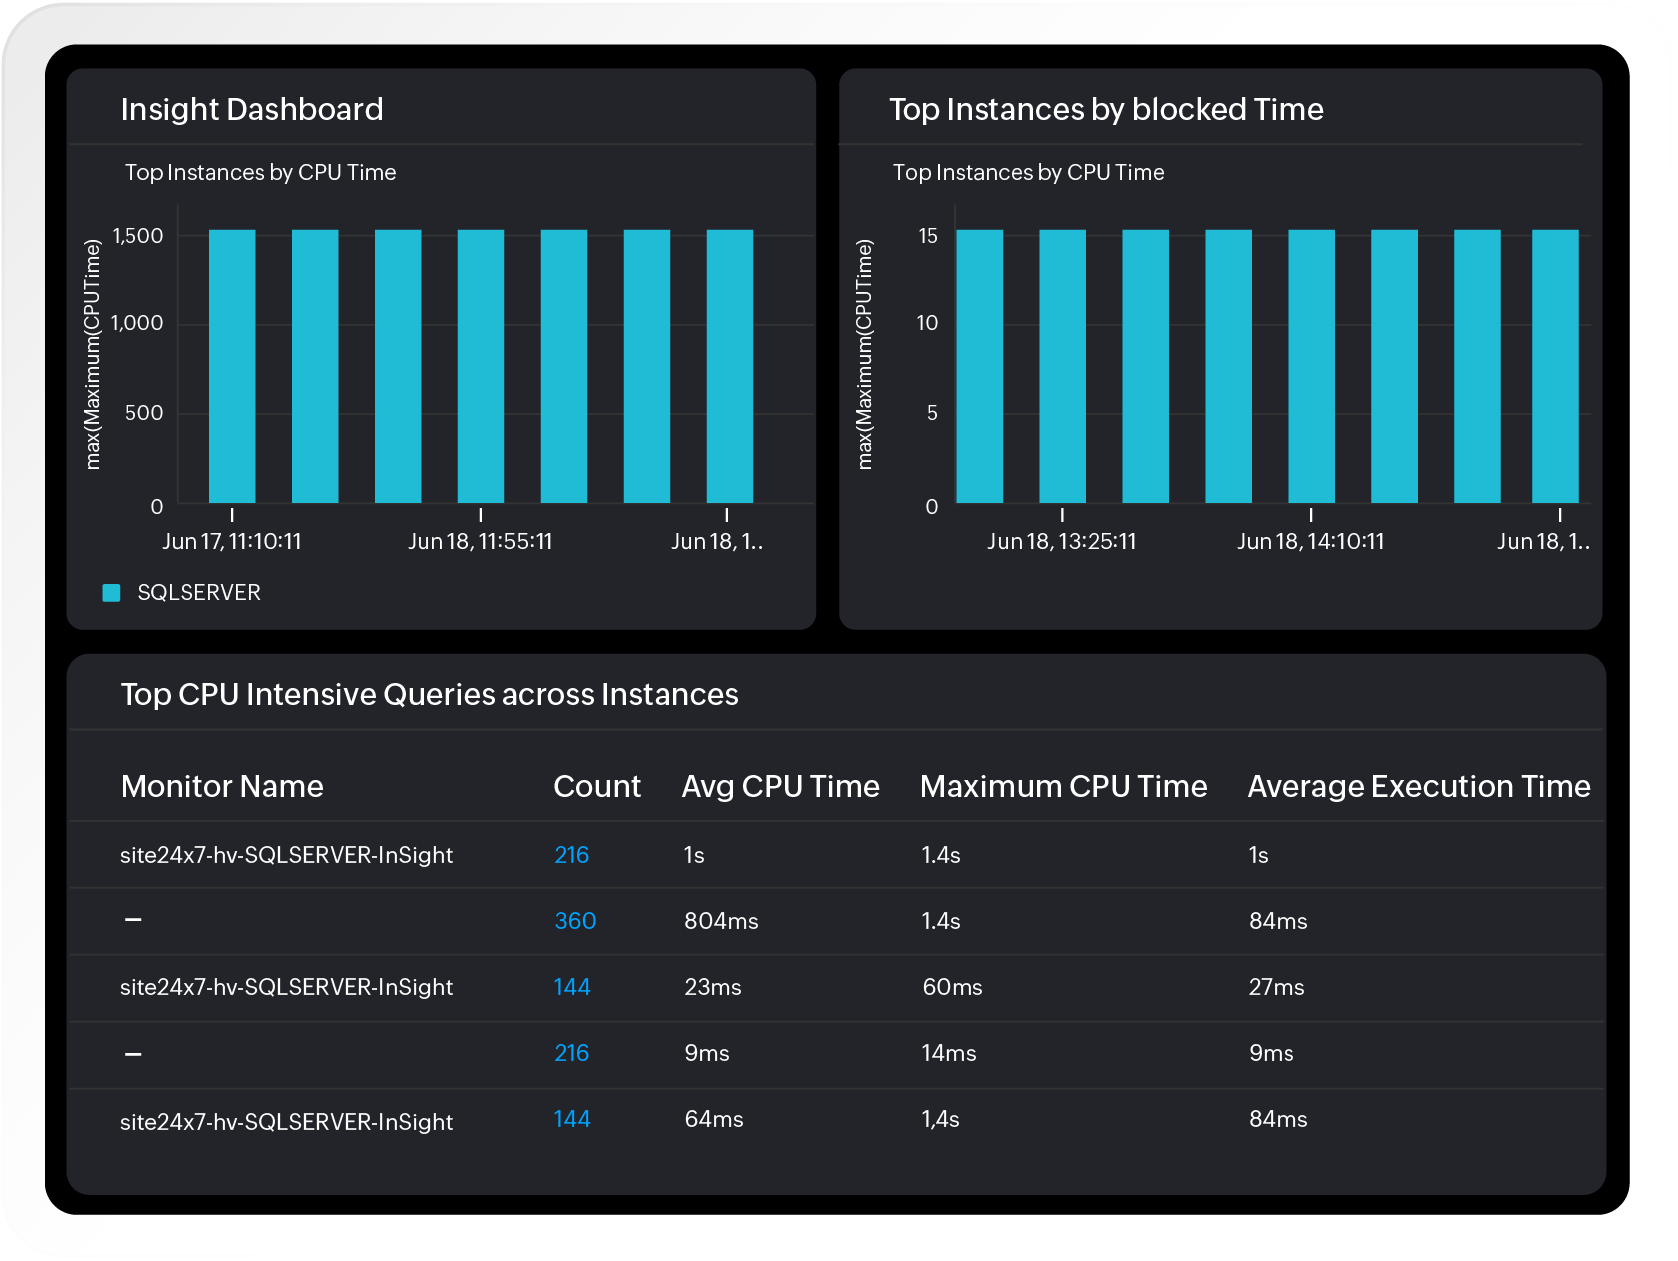
Simplify Microsoft SQL Server monitoring across environments
Monitor every instance and database from one console.
Visualize key metrics beyond built-in tools.
Scale across hybrid infrastructures with ease.
Ensure compliance and audit readiness with reports.
Start monitoring in minutes
Quick to deploy. Easy to use. Powerful enough to monitor complex SQL Server environments without scripts or manual configuration.
Start 30-day free trial Try now, sign up in 30 seconds