
When users abandon a conversion funnel midway, organizations often misattribute the root cause. Product teams may review the user interface, assess component placement, or revise microcopy. However, the underlying issue frequently resides in application performance: a payment gateway timing out, a JavaScript exception failing silently, or a third-party script blocking rendering. Users with clear purchase intent may fail to complete transactions due to underlying application instability rather than confusing design.
User journey monitoring differs significantly from user journey mapping. While journey mapping is a UX design exercise used to plan touchpoints and hypothesize potential friction, journey monitoring provides empirical data. It tracks how users progress through a sequence of application events toward a defined business objective, measures conversion and abandonment rates at each step, and correlates this progression with application telemetry—such as response times, error rates, and session data. While mapping produces a planning artifact, monitoring yields operational metrics necessary for targeted remediation.
Behavioral analysis without system context provides an incomplete picture. Effective journey analysis requires tools that interface directly with the systems responsible for application performance.
The limitation of product analytics in identifying application failures
Product analytics tools effectively track interactions, pageviews, and funnel conversions. For instance, they can quantify a 30% abandonment rate at a specific stage. However, they lack visibility into the application layer during those specific user sessions. They cannot ascertain whether a page experienced latency, an API call failed, or a script error prevented critical UI components from rendering, primarily because they do not collect underlying performance telemetry.
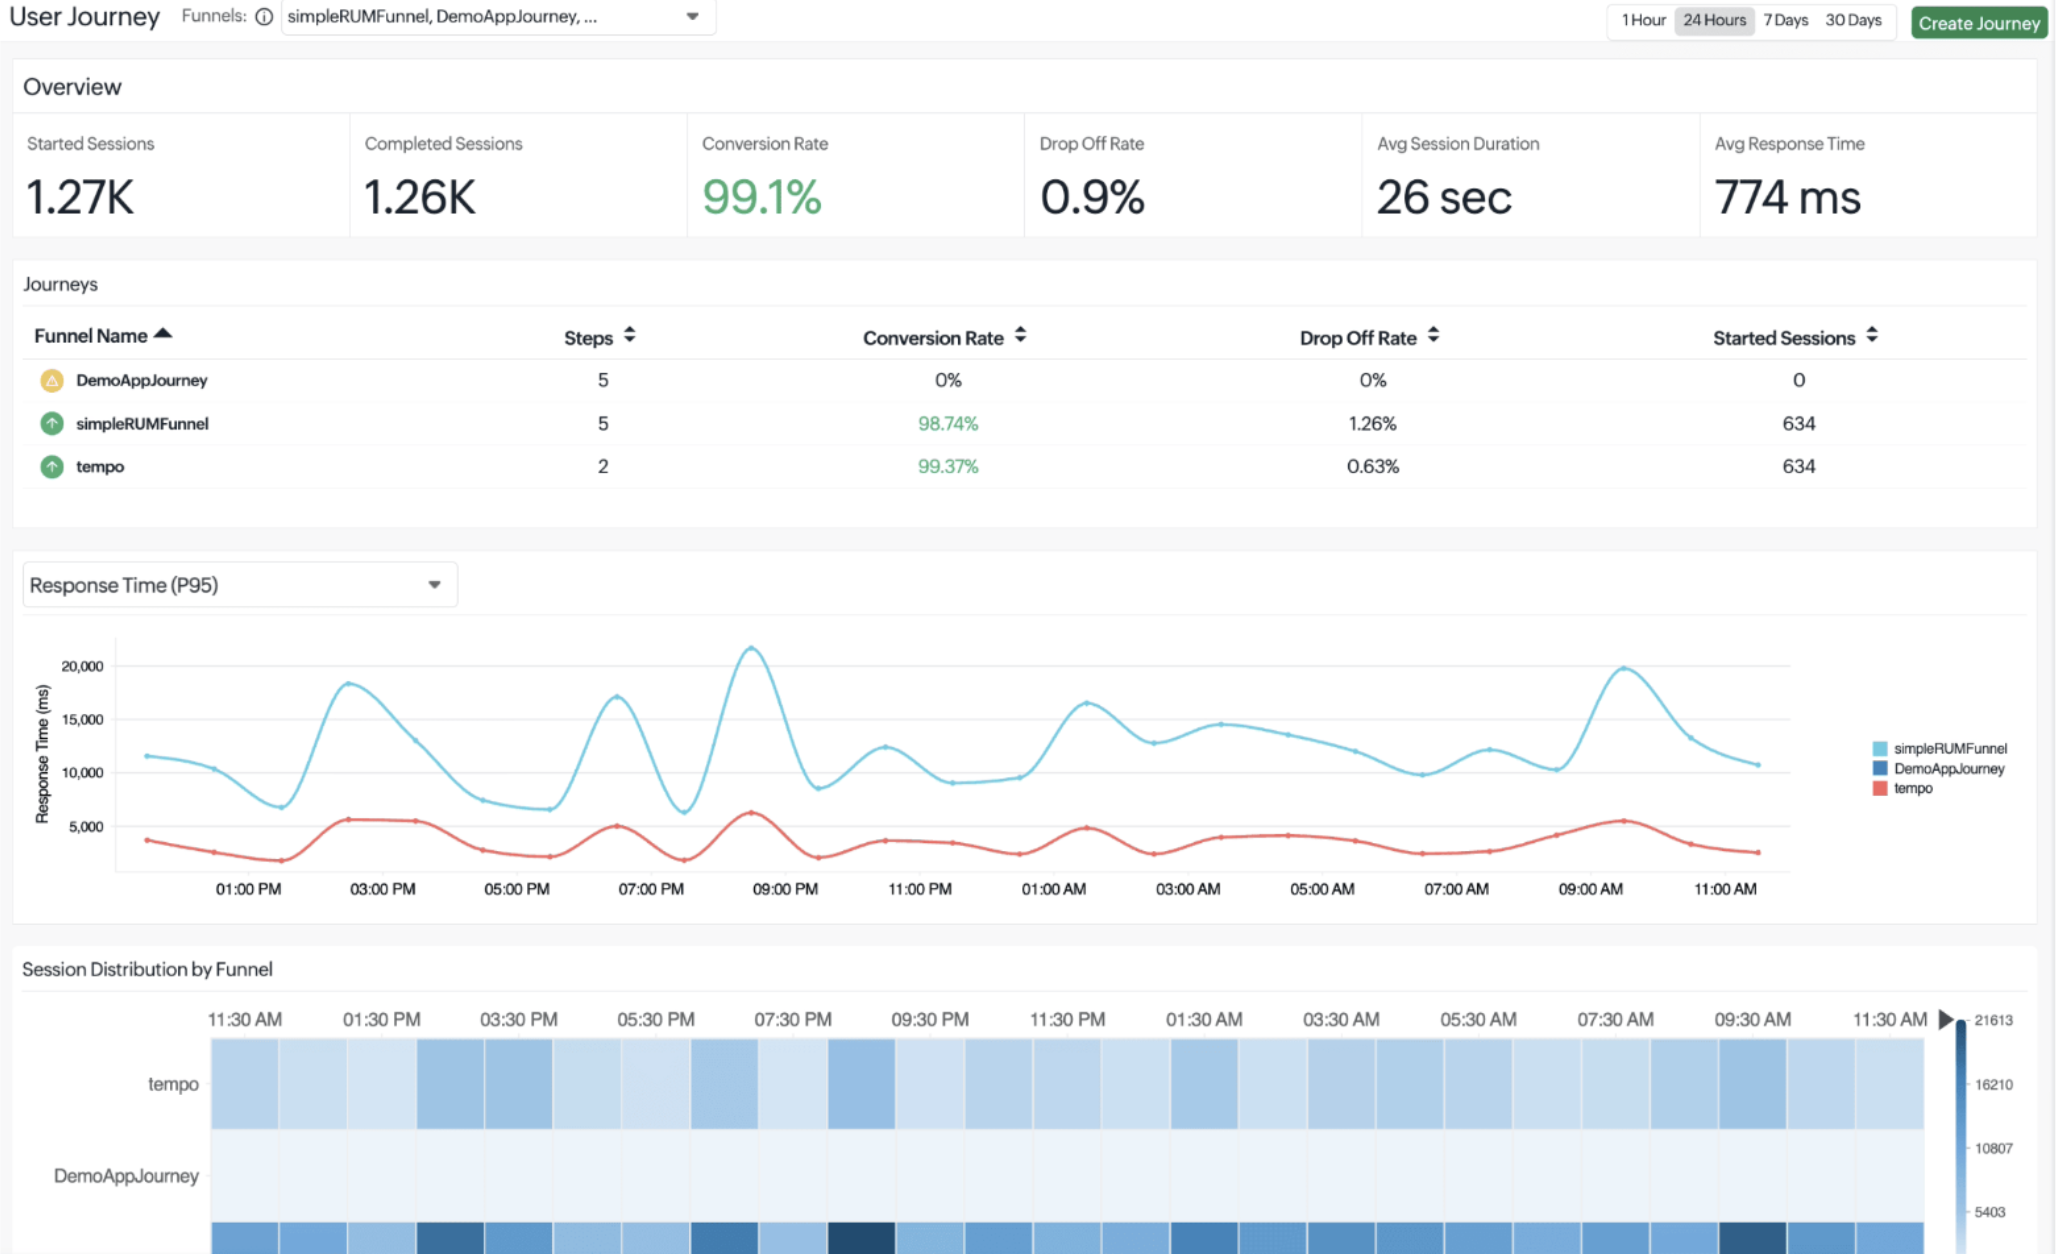
Business Analysis within Site24x7 maps each step of a user journey to corresponding performance events: page load times, API response latency, error rates, and distributed traces. When abandonment spikes at a specific step, teams can examine correlated data—such as a payment gateway response time increasing from 800 milliseconds to 4.2 seconds—rather than relying on UI hypotheses.
Remediation requires accurate root-cause identification. UX issues necessitate redesigns, while latency requires infrastructure or code optimization. Correlating user journeys with application performance establishes a foundation for comprehensive digital experience monitoring, yielding actionable observability based on actual application interactions.
The necessity of a correlation layer in journey monitoring
Without a correlation layer, journey monitoring treats sessions as isolated, aggregated statistics. Standard analytics tools may report cohort completion rates—for example, that 70% of users completed the first step and 45% completed the second. Yet, they cannot trace a specific user's experience between those steps to determine if a session encountered a critical error or excessive latency.
Business Analysis defines journeys using three parameters: ordered steps, a correlation key, and an evaluation window. Ordered steps define the expected sequence of actions, such as viewing a product, updating a cart, submitting payment, and receiving confirmation. The correlation key (e.g., a session ID, cart ID, or user ID) binds all events from a single journey instance. Finally, the evaluation window establishes a maximum time limit for completion; instances exceeding this threshold are categorized as abandoned.
By integrating these elements, Business Analysis tracks individual user progression across Web RUM, Mobile APM, and APM Insight events, pinpointing the exact phase where a session degraded.
Identifying performance disparities through segment-level analysis
Aggregate conversion metrics often obscure specific segments experiencing performance degradation.
For example, mobile web environments frequently face challenges in meeting Core Web Vitals thresholds compared to desktop clients. This introduces systematic performance disparities that directly impact journey completion rates. An aggregate conversion rate might appear acceptable, but segment-level analysis might reveal substantial discrepancies—such as a high conversion rate on desktop in one region versus a severely degraded rate on mobile devices in another. Identifying these variances is critical for operational optimization.
Business Analysis facilitates the comparison of conversion and abandonment rates across geographic regions, browsers, device types, ISPs, and network connection types. If users on specific network connections abandon a process at significantly higher rates than those on high-speed connections, engineers can trace this anomaly directly to the application layer.
Optimizing underperforming segments frequently yields substantial improvements in overall conversion. Addressing API latency for specific client demographics requires precise data correlation rather than generalized design modifications.
The limitations of behavioral-layer optimization
A common limitation in conversion optimization is evaluating journeys exclusively at the behavioral layer. Organizations frequently assume that funnel drop-offs indicate user confusion, leading to iterative design changes such as form simplification or the addition of progress indicators.
However, a significant portion of user abandonment stems from application errors and latency.
Furthermore, optimizing isolated, page-level performance metrics does not guarantee improved conversion rates. Confounding variables—including demographics, product categories, and seasonal traffic fluctuations—can dilute the correlation between single metrics and overall success. Performance must be evaluated in context. While latency on a product listing page may reduce page views, identical latency during a payment submission directly impacts revenue. Journey-step-level monitoring distinguishes between these scenarios, whereas global page-level metrics cannot.
This structural limitation explains why standalone journey analytics often fail to deliver operational improvements. Without a performance correlation layer linking journey progression to system telemetry, analysis identifies the point of abandonment but fails to identify the underlying application failure.
Transitioning from funnel analysis to operational remediation
Integrating journey progression with application performance fundamentally shifts triage workflows. A journey step exhibiting high abandonment alongside nominal performance metrics indicates a likely UX or design issue. Conversely, a step with high abandonment and elevated error rates or latency signals an application-level defect. This correlation ensures incidents are routed to the appropriate engineering or product teams efficiently.
Root cause analysis also becomes highly specific. Business Analysis correlates journey events with distributed traces, allowing engineers to transition directly from a high-level journey view to the underlying technical failure—such as a slow database query, a degraded microservice, or a timed-out third-party API. Teams can definitively identify when a specific service endpoint returns 503 errors for a given percentage of requests, directly causing the observed abandonment.
With Business Analysis, conversion metrics, drop-off rates, and completion times are unified within the same platform used for application health monitoring.
While product analytics provides visibility into user behavior, journey monitoring provides critical context regarding how the application performed during those interactions.
Start monitoring your user journeys in Site24x7. Business Analysis is available for applications monitored with Web RUM, Mobile APM, and APM Insight. Define your first journey, establish a correlation key, and accurately measure how application performance impacts user conversions.