Database workloads rarely fail outright; they degrade first. A query that takes milliseconds today may take seconds tomorrow, and if left unchecked, it can lead to blocking chains or deadlocks.Monitoring slow queries and deadlocks isn't just about identifying problematic SQL statements; it's about understanding how query performance, resource contention, and concurrency control intersect.
Site24x7's database monitoring bridges query performance and lock diagnostics, enabling teams to detect slowdowns and deadlocks before they escalate into outages.
Why queries become slow
Slow queries typically arise from:
- Poorly optimized SQL statements or missing indexes.
- Inefficient executions and a high number of I/O operations.
- Lock contention or blocking sessions.
- Resource saturation (CPU, memory, or IOPS bottlenecks).
Without proper monitoring, identifying which query is responsible for the slowdown becomes guesswork. Site24x7 eliminates this uncertainty by continuously tracking and correlating query execution metrics with resource utilization trends.
What to monitor
A well-instrumented database should surface the following metrics:
- The query execution time: This is the total duration from the query start to completion, including waits.
- The CPU time per query: This denotes the computational intensity, which helps distinguish CPU-bound workloads from I/O waits.
- Memory usage per query: The amount of memory consumed during query execution can indicate inefficiencies in query design or high-resource workloads. Monitoring memory helps you identify queries that trigger excessive tempdb or buffer pool consumption, which may degrade the overall database performance.
- The wait time: The wait time is the period when queries are stalled due to locks, I/O latency, or resource contention.
- Logical reads and writes: Excessive reads suggest inefficient scans or missing indexes.
- The query count above the threshold: This quantifies how many queries exceed a defined performance baseline.
Site24x7 captures these metrics at the query level, enabling correlation across instances and time periods. This helps you detect when execution times spike, whether due to parameter sniffing, data growth, or concurrent workload pressure.
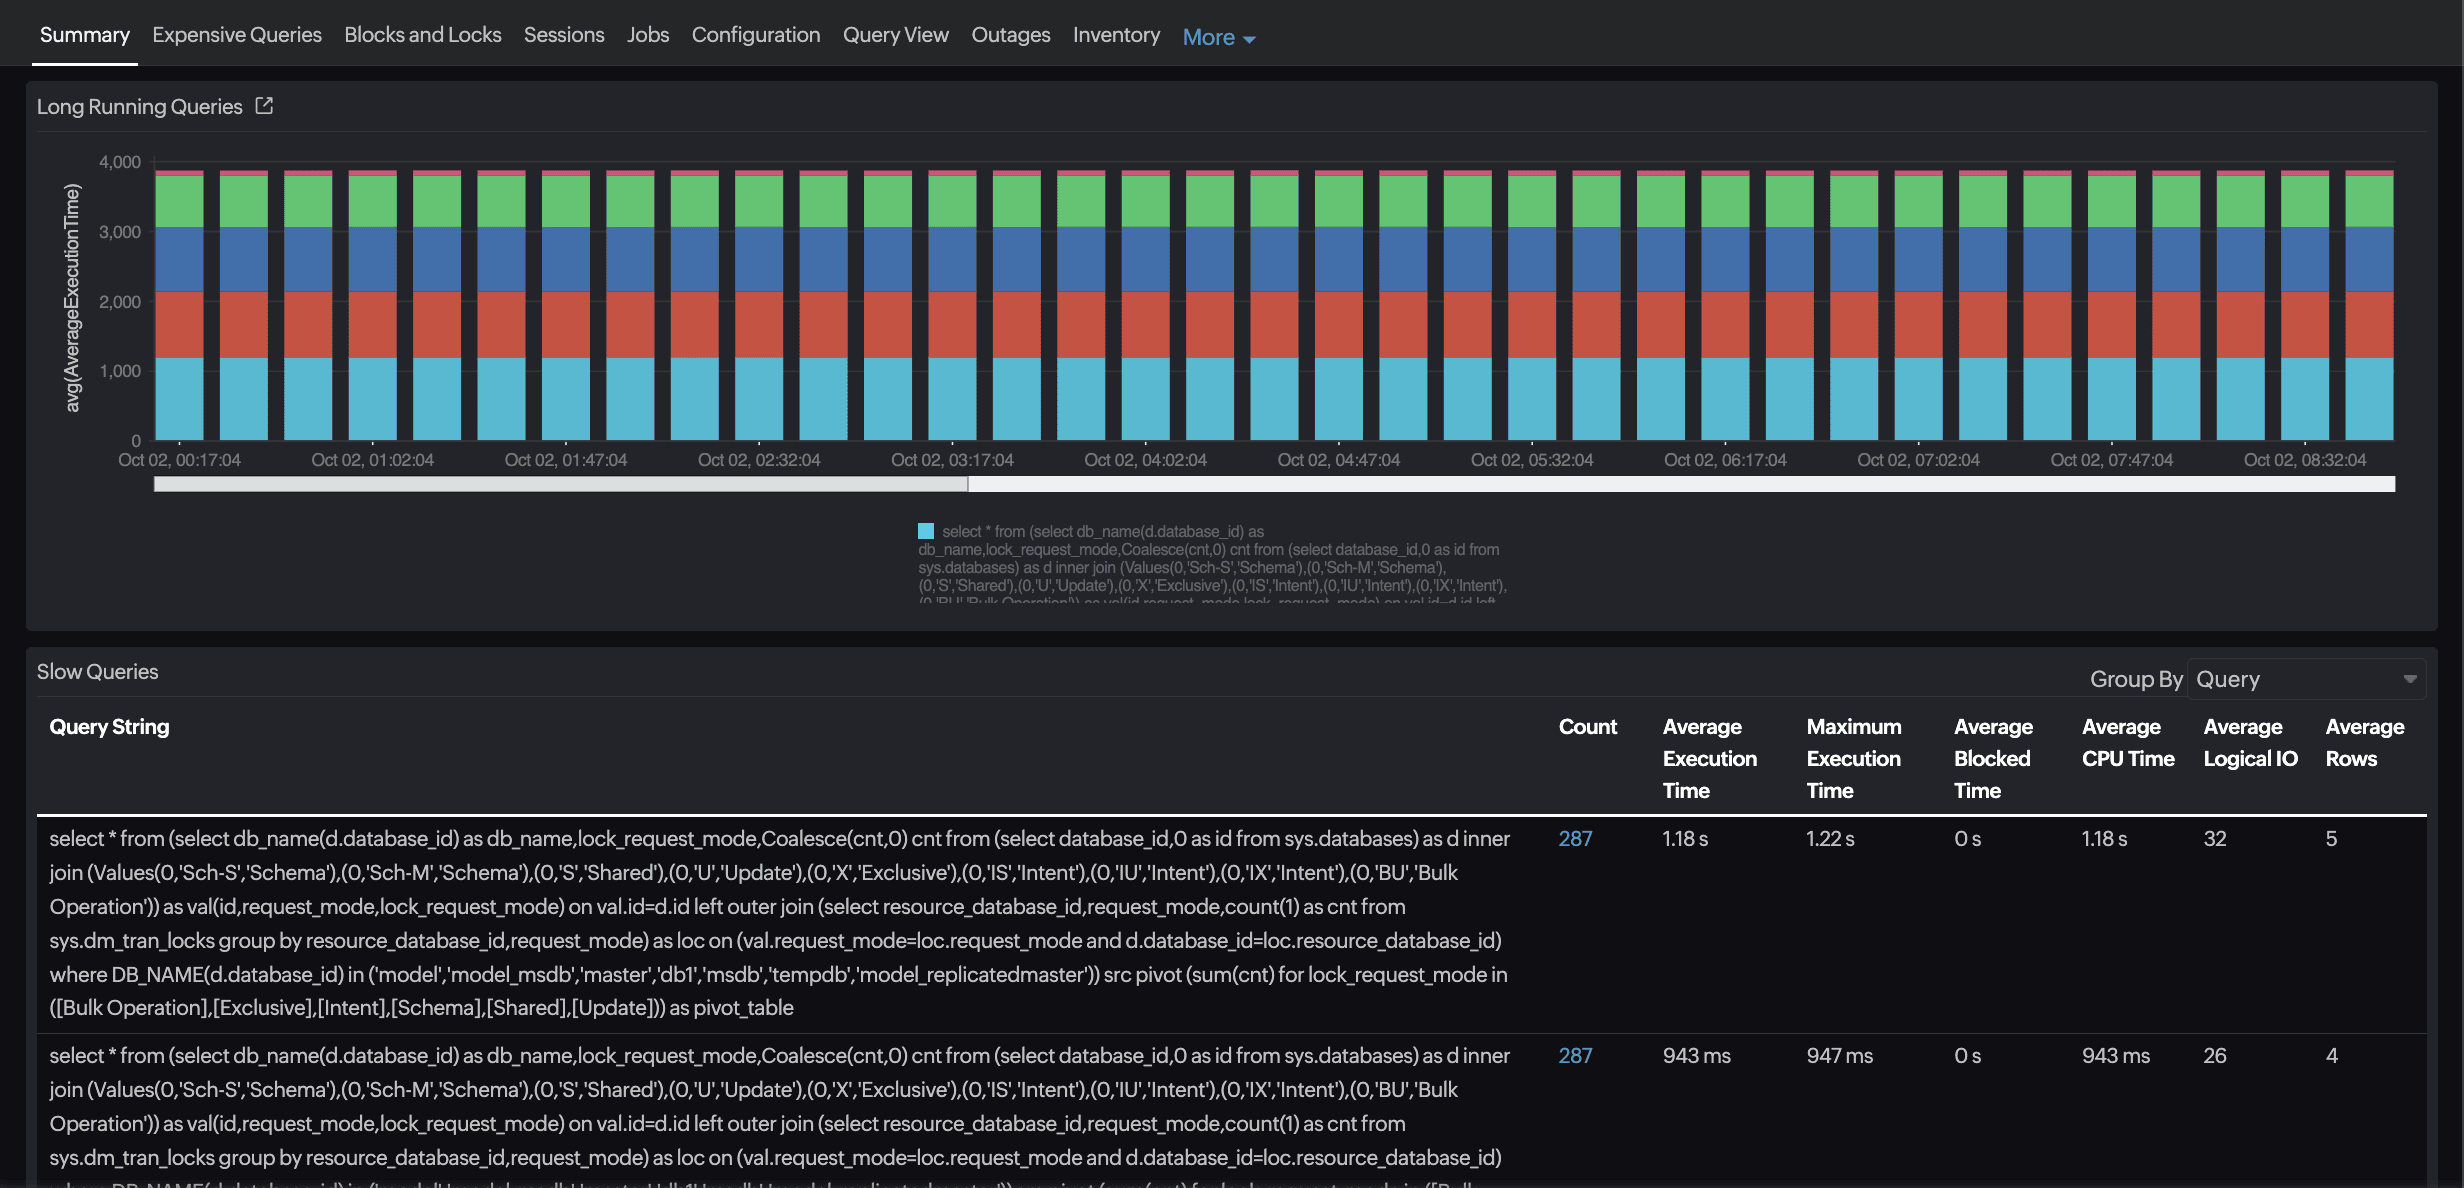
Identifying slow-running queries
Through continuous query profiling, Site24x7 surfaces the slowest queries based on the execution time, CPU usage, and memory utilization. By aggregating metrics such as the average elapsed time, standard deviation, CPU time, and peak memory usage, it distinguishes transient anomalies from consistent performance regressions.
Database admins can focus on:
- Queries consuming a disproportionate amount of the CPU, memory, or I/O.
- Queries showing sudden increases in the elapsed time or memory footprint.
- Workloads with a high wait time relative to CPU and memory usage, often
indicating blocking, I/O bottlenecks, or insufficient buffer pool allocation.

Correlation and context
Slow queries don’t occur in isolation. Site24x7 correlates query metrics with infrastructure telemetry—the CPU load, memory pressure, and disk latency—to identify whether performance issues stem from query design or system constraints.
For example:
- A spike in query wait times concurrent with rising memory usage and disk I/O latency may indicate that the database is spilling to tempdb or exceeding the buffer pool capacity.
- Queries consuming an excessive amount of memory alongside high CPU usage may be candidates for optimization, such as rewriting joins, adding indexes, or adjusting caching strategies.
By linking query execution, memory consumption, CPU usage, and I/O metrics, Site24x7 provides a holistic view of performance, helping engineers pinpoint root causes rather than treat symptoms in isolation.
Detecting deadlocks
Deadlocks arise when two or more transactions acquire locks in a conflicting order, creating a circular wait. The database engine resolves the conflict by terminating one transaction, but frequent deadlocks indicate underlying concurrency design issues.
What to track
Site24x7 helps engineers detect and diagnose deadlocks by:
- Monitoring blocked and blocking session counts.
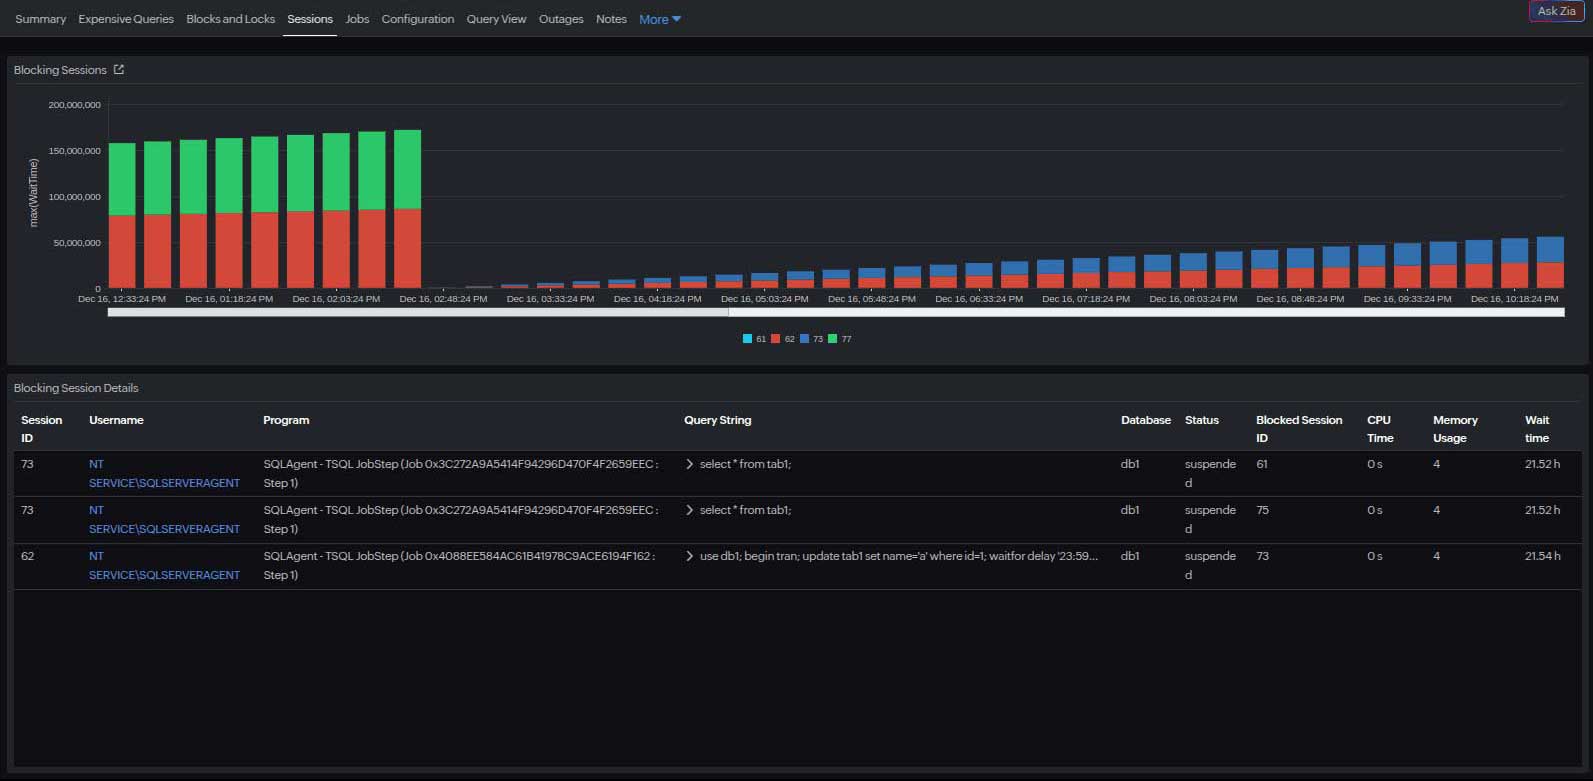
- Identifying blocking session root causes.
- Tracking the lock wait duration.
- Capturing deadlock event counts in supported databases.
- Correlating these events with query execution analysis.

This enables engineers to trace deadlocks to specific workloads or application components, identifying recurring access patterns that need to be redesigned.

The typical deadlock causes sequence
- Query wait times increasing
- CPU utilization rising
- The concurrent transaction count peaking
- The deadlock detected and the victim rolled back
This temporal relationship helps you pinpoint the root cause—whether it's an uncommitted transaction, poor lock ordering, or a lack of indexing. Apart from these, other factors may also contribute to the poor performance of your query.
From detection to prevention
Typical SQL deadlock troubleshooting is seen as complex. However, beyond alerting on the deadlock frequency, Site24x7's analytics layer enables pattern recognition. By aggregating deadlock occurrences over time, it identifies hotspots: specific queries, tables, or procedures that repeatedly participate in deadlocks.This insight supports preventive tuning, such as:
- Enforcing a consistent lock acquisition order across transactions.
- Narrowing the transaction scope to reduce the lock duration.
- Adding indexes to minimize the lock granularity.
- Evaluating isolation levels (e.g., READ COMMITTED SNAPSHOT in SQL Server).

Bringing them together: Slow queries and deadlocks
Slow queries and deadlocks are tightly coupled; long-running queries increase lock hold times, elevating the risk of deadlocks.Site24x7 bridges these events through unified observability, linking query performance, resource metrics, and concurrency behavior across instances.
Combined analysis can answer critical questions:
- Are deadlocks correlated with spikes in slow queries?
- Do specific query patterns frequently appear in both slow query and deadlock reports?
- Is the issue workload-driven (e.g., batch updates) or systemic (e.g., storage latency)?
Treating slow queries and deadlocks as interconnected symptoms enables teams to correlate, analyze, and optimize holistically.
Use case: Resolving latency in a multi-tenant application
A SaaS provider running a multi-tenant application on SQL Server noticed periodic transaction delays affecting certain customer accounts. Site24x7's database query monitor revealed that:
- A handful of tenant-specific queries were consistently taking 20–60 seconds longer than average.
- The affected queries were waiting onPAGEIOLATCH_SHand LCK_M_Xwait types, indicating I/O contention and locking.
- Simultaneously, the wait stats showed an abnormality.
By analyzing the query text directly from Site24x7, the database team identified overlapping transaction scopes. After optimization, the average query time dropped by 68%, and the number of deadlocks was reduced.Technical term clarifications
| Term | What it means | Impact |
|---|---|---|
| PAGEIOLATCH_SH | I/O latch wait (shared) | The query is waiting for SQL Server to read data from the disk into memory. High wait times here often indicate disk or storage bottlenecks. |
| LCK_M_X | Exclusive lock wait | The query is waiting to acquire an exclusive lock on a resource, usually because another transaction already holds a lock. High wait times for this type can indicate blocking, which may lead to deadlocks. |
How Site24x7 simplifies query troubleshooting
- Unified visibility: Correlate query metrics with database CPU, memory, and disk I/O usage on a single dashboard.
- Proactive alerting: Receive instant alerts when the query execution time or lock wait duration exceeds thresholds.
- Historical trend analysis: Compare query performance over time to identify regressions after schema or index changes.
- Cross-engine support: View your SQL Server, MySQL, Oracle Database, and PostgreSQL environment KPIs from a unified interface.
Once performance visibility is established, the next step is proactive optimization, which involves setting thresholds, correlating metrics, and automating responses.
Best practices for proactive monitoring
- Correlate query and infrastructure metrics: Cross-reference query latency with CPU, I/O, and memory utilization.
- Track blocking events: Look for high wait times preceding deadlocks, which are early indicators of contention.
- Analyze trends, not snapshots: Evaluate week-over-week changes in slow query ratios and the deadlock frequency.
- Integrate with alert workflows: Route critical deadlock and slow query alerts to incident management tools for faster triage.
In short
Detecting slow queries and deadlocks requires visibility beyond individual query statistics. It demands end-to-end observability across database, workload, and infrastructure layers.
With Site24x7's database monitoring, teams gain:
- Query-level telemetry with CPU, wait, and I/O insights.
- Unified dashboards linking performance degradation to underlying causes.
By integrating slow query analysis and deadlock monitoring within a single platform, Site24x7 enables database teams to transition from reactive troubleshooting to proactive optimization, ensuring consistent performance and operational resilience.