Kubernetes has offered scalability and flexibility over time. However, its nature is complex and arbitrary, which makes monitoring essential for stability. As clusters scale, maintaining visibility across workloads, nodes, and control-plane components becomes increasingly complex.
Effective and sustained monitoring bridges this gap. From tracking control plane health and resource utilization to ensuring compliance and cost optimization, each use case plays a critical role in keeping your Kubernetes ecosystem healthy and efficient.
Below, we explore key Kubernetes monitoring use cases, what to monitor, and how these insights translate into actionable solutions.
Key use cases for Kubernetes monitoring
Each use case highlights a specific operational challenge and how monitoring can solve it.
| Use case | What to monitor | How monitoring helps |
|---|---|---|
| Control plane and cluster health | API server latency, request rates, error counts, etcd leader election and write latency, scheduler queue length, controller manager reconciliation rate, node readiness, unexpected node drains, failed scheduling events | Detect control-plane anomalies early to prevent workload disruption. Monitoring latency and errors enables fast root cause analysis, such as pinpointing an etcd bottleneck or failing control loop. Early detection supports proactive scaling and remediation before users are impacted. |
| Node performance and availability | Node CPU, memory, disk, and network utilization; kubelet status; disk pressure and file system inodes; node conditions (Ready, MemoryPressure, DiskPressure, PIDPressure); system pod performance (kube-proxy, kubelet logs) | Node-level monitoring helps detect infrastructure bottlenecks before they cascade into pod failures. For example, observing rising disk I/O wait times or frequent DiskPressure conditions can reveal underlying hardware issues or unbalanced scheduling. Continuous visibility ensures that workloads are evenly distributed and nodes remain healthy, preventing resource starvation and cluster instability. |
| Namespace-level insights and governance | Namespace-level CPU, memory, and storage usage; active pods and deployments; applied ResourceQuotas and LimitRanges; network policies; cost allocation by namespace | Namespaces often map to teams or environments. Monitoring resource consumption and quota adherence at the namespace level enables capacity planning and cost accountability. Detecting when a namespace consistently hits its CPU quota or violates network policies helps enforce governance and prevents noisy-neighbor effects. |
| Pod and container health | Pod status, container restarts, crash loops, probe failures, eviction events, application logs | By tracking pod restarts and probe failures, teams can catch misconfigured readiness probes or resource starvation early, reducing downtime from crash loops. |
| Resource utilization and capacity planning | CPU, memory, disk, and network usage at node, pod, and namespace levels; requests vs. limits; usage vs. allocatable resources | Analyze namespace-level consumption to identify teams overallocating CPU requests. Right-sizing workloads improves efficiency and avoids cloud cost overruns. |
| Autoscaling behavior | Metrics from Horizontal/Vertical Pod Autoscalers, desired vs. actual replicas, scheduling latency | Monitoring replica counts and scaling latency validates whether autoscaling responds quickly enough to demand spikes, reducing customer-facing lag. |
| Network and service performance | Service and ingress latency, inter-pod network RTT, DNS resolution times and failures, ingress/egress bandwidth, dropped packets, retransmits, service error codes | Comprehensive monitoring of network paths and DNS health quickly exposes misconfigured load balancers, sluggish pod-to-pod communications, or intermittent DNS failures. This enables meeting SLAs by minimizing latency and ensuring high availability for services. |
| Failure detection and troubleshooting | HTTP and application error rates, failed requests, Kubernetes event spikes (OOMKills, pod evictions, backoffs), cluster auto-heal actions, anomaly detection in logs and metrics | Correlating app errors with Kubernetes events and logs enables teams to pinpoint systemic failures—such as transient node pressure or recurring pod evictions—dramatically accelerating root cause analysis and reducing MTTR. Outlier and anomaly detection promote early alerts and better incident response. |
| Security and compliance | Audit logs, RBAC activity, network policies, secrets access, configuration drift | Monitoring unauthorized access attempts or privilege escalations ensures compliance with industry regulations like the PCI DSS or HIPAA. |
| Cost optimization | Resource usage per namespace/pod, idle workloads, unused capacity, billing data | Analyze resource usage per namespace, spot inefficient workloads and unused nodes, and estimate savings potential using cost visibility dashboards. |
| Deployment observability | Deployment logs, rollout success/failure, canary metrics, rollback events, performance post-deployment | Tracking error rates during canary rollouts lets teams roll back faulty releases quickly, minimizing the impact on users. |
| Multi-cluster visibility | Cross-cluster metrics, synchronization health, regional performance comparisons | Multi-region clusters can be compared to detect if latency issues are global or localized, enabling faster triage in hybrid or cloud-native deployments. |
Case examples
1. E-commerce latency spike during a sale
Problem: An e-commerce platform noticed checkout latency climbing during a flash sale. Customer abandonment rates began to rise.
Monitoring insight: Metrics revealed a sudden CPU saturation in payment-processing pods, while traces showed cascading latency in dependent microservices.
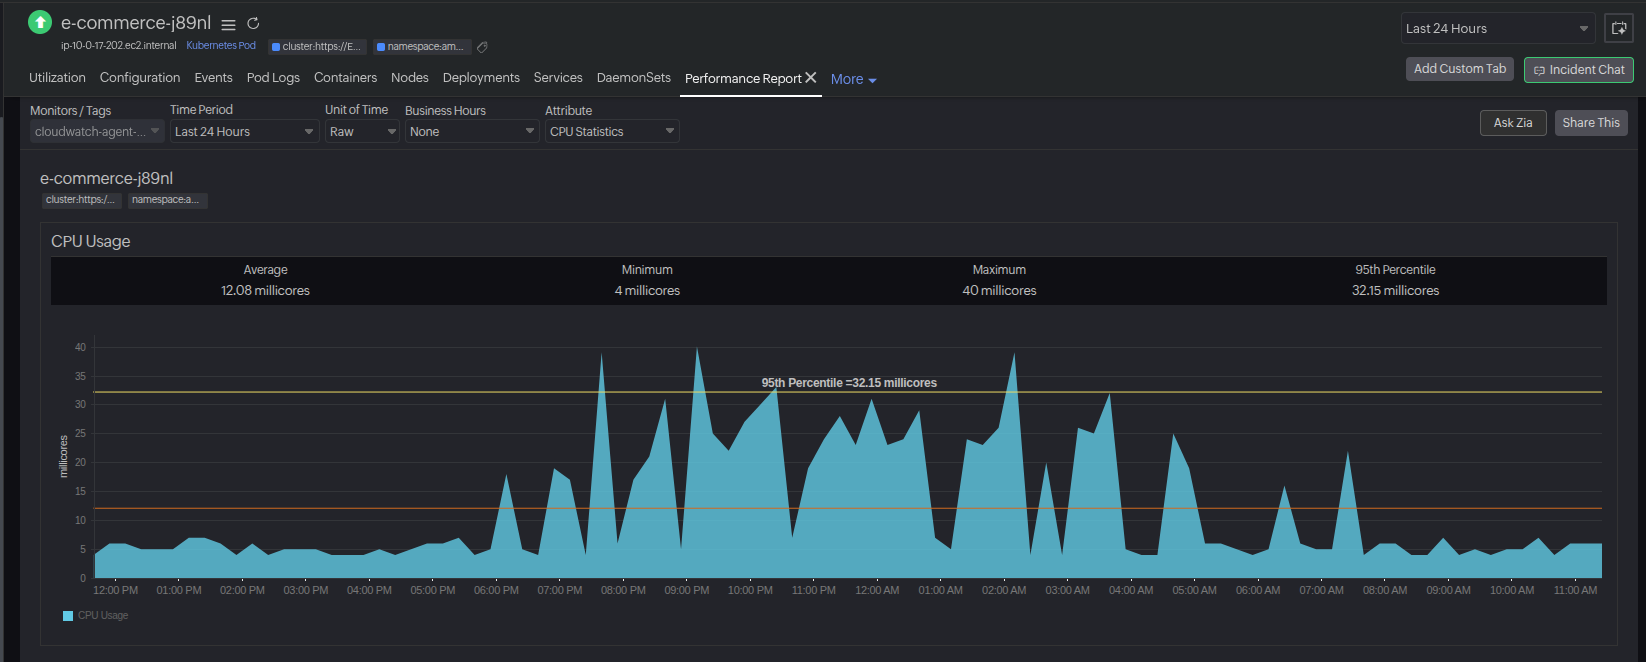
Resolution: Engineers adjusted resource requests, scaled replicas, and applied a HorizontalPodAutoscaler policy to handle peak demand.
Outcome: Checkout latency dropped by 60%, abandoned carts fell by 35%, and the sale revenue target was achieved without downtime.
2. Compliance breach in financial services
Problem: A financial services provider faced potential non-compliance when audit logs showed frequent unauthorized access attempts.
Monitoring insight: Kubernetes audit logs, combined with Site24x7's Kubernetes Change Tracker, revealed that a misconfigured RBAC policy had been recently modified—granting developers broader access than intended. The change tracker provided clear visibility into who made the change and when, helping the team pinpoint the root cause quickly.
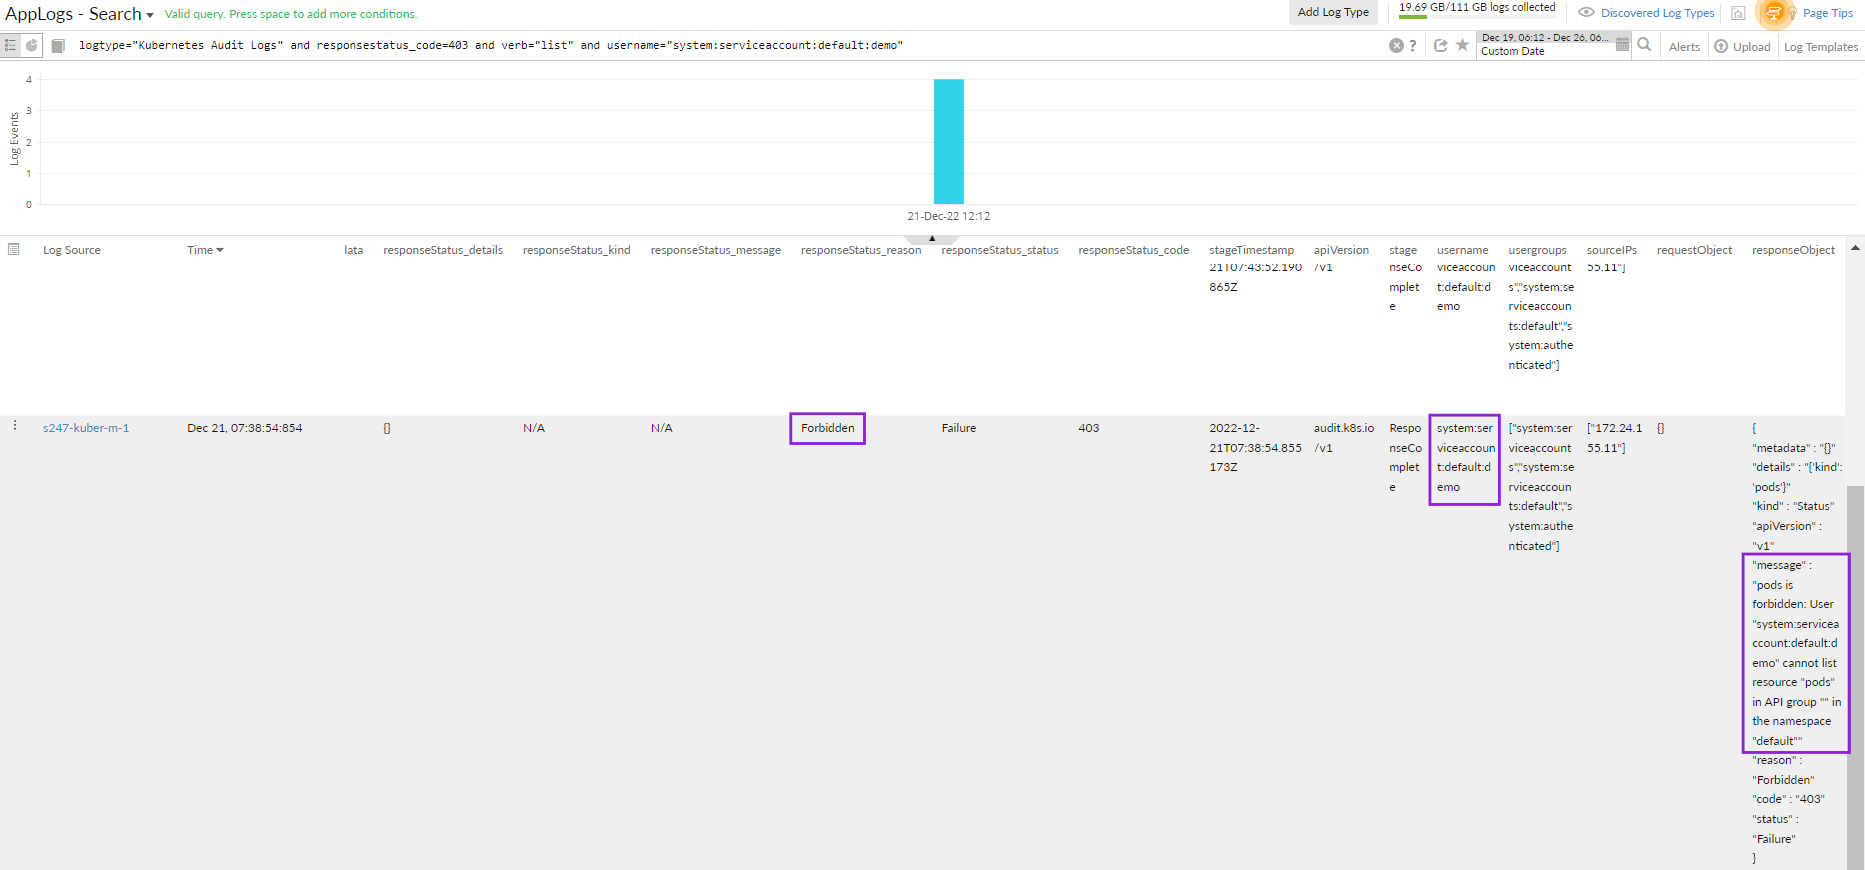
Resolution: The RBAC policies were corrected, and continuous security monitoring was established with alerting on privilege escalation attempts through Site24x7’s integrated alerting workflows.
Outcome: The compliance gap was closed ahead of a regulatory audit, avoiding penalties and strengthening customer trust.
3. Scaling issues in a SaaS application
Problem: A SaaS vendor’s analytics service crashed intermittently during customer report generation.
Monitoring insight: Monitoring showed frequent pod evictions due to node memory pressure and a mismatch between configured limits and actual workload needs.
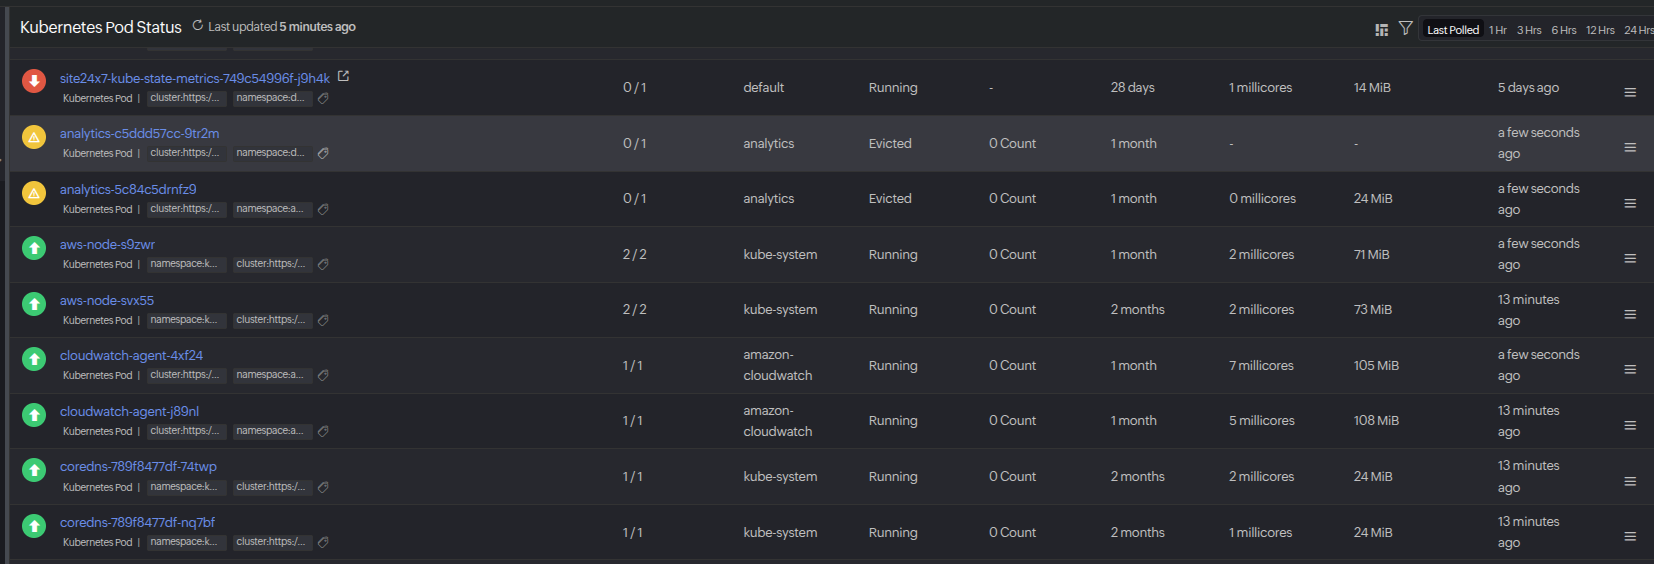
Resolution: Resource requests and limits were right-sized, and a VerticalPodAutoscaler was introduced to dynamically adjust resources.
Outcome: Service uptime improved to 99.95%, support tickets related to failed reports dropped by 80%, and infrastructure costs were reduced by 15% through more efficient resource allocation.
By continuously monitoring database interactions, APM ensures reduced downtime, optimizes query execution, and improves system efficiency, contributing to effective database performance optimization.
Best practices
Monitoring Kubernetes effectively requires more than just scraping cluster metrics. To gain true observability, teams should follow a set of best practices that balance visibility, performance, and cost.
Kubernetes monitoring with Site24x7
Kubernetes environments are highly dynamic, making it challenging to track workloads, resource utilization, and service dependencies without a unified observability layer. Site24x7 provides an end-to-end Kubernetes monitoring solution that ties directly into the use cases outlined above, enabling teams to move from detection to resolution faster.
- Control plane and node monitoring: Gain visibility into the health of your API server, etcd, kube-scheduler, and kube-controller-manager along with node resource usage. This ensures that infrastructure bottlenecks are identified before they impact workloads.
- Namespace and quota monitoring: Track resource allocation and enforce limits across namespaces to prevent noisy-neighbor issues and ensure fair usage. Site24x7 provides visibility into CPU, memory, and storage quotas, helping teams detect over- or under-utilization, optimize resource distribution, and maintain balanced performance across projects.
- Application and workload observability: Track pod performance, replica availability, and service response times. Site24x7 maps dependencies across services and workloads so you can pinpoint issues in real time.
- Cost and capacity optimization: Break down resource consumption by namespace, deployment, or cluster. Site24x7’s dashboards highlight idle pods, overprovisioned resources, and opportunities for right-sizing, helping uncover spending on the cloud.
- Security and compliance visibility: Detect anomalies such as unauthorized access, API abuse, or suspicious resource configuration changes. Site24x7 integrates alerting and log monitoring to support compliance requirements.
- Multi-cluster monitoring at scale: Whether you run a single on-prem cluster or multiple cloud-native deployments, Site24x7 offers centralized monitoring with drill-down capabilities for granular troubleshooting.
By consolidating cluster health, application performance, and cost metrics into one platform, Site24x7 helps engineering teams, DevOps teams, and business leaders maintain Kubernetes environments that are both resilient and cost-efficient.
Conclusion
Kubernetes monitoring is not just about tracking pods and nodes—it’s about enabling teams to keep applications reliable, performant, secure, and cost-efficient. By addressing use cases across reliability, compliance, scaling, and cost, organizations can proactively optimize their Kubernetes environments and deliver business outcomes with confidence.