When you’re working with massive volumes of data (billions of rows), speed and stability become your top priorities. That’s where ClickHouse shines. It's a high-performance columnar database designed for ultra-fast analytics, even on terabytes of data. However, even ClickHouse isn’t immune to bottlenecks. That’s why monitoring is essential. It's not just about monitoring surface-level performance, but about diving into the right metrics that tell you what’s really going on under the hood.
In this article, we’ll break down the key metrics that you need to monitor for ClickHouse and how they can help you optimize performance for large-scale analytics.
Why monitoring ClickHouse matters for billion-row workloads
ClickHouse is built for speed, but high-scale workloads introduce complexity. Queries that run fine on millions of rows may suddenly drag when you scale up. Background merges, distributed inserts, memory spikes, and lock contentions can silently build up, impacting both performance and stability.
Proactive monitoring with Site24x7 provides visibility into how ClickHouse uses system resources, handles queries, manages replication, and coordinates background tasks. The right insights help you prevent slowdowns, pinpoint bottlenecks, and ensure high availability.
Essential ClickHouse metrics to monitor
Site24x7 collects dozens of ClickHouse metrics, but to keep things clear, let’s group them by function:
1. Query execution and performance
Metrics like Query, QueryThread, and QueryPreempted provide insights into how queries are being executed, how many threads are being used, and whether any queries are being preemptively stopped due to resource constraints. Similarly, metrics such as DelayedInserts, PartMutation, and Merge reveal how well the system is handling inserts, data mutations, and background merge operations—tasks that are especially common when dealing with large datasets. Site24x7 helps by offering real-time dashboards to visualize query behavior and alerting rules to flag query preemptions or excessive mutations. By tracking these patterns over time, Site24x7 enables you to fine-tune insert and mutation strategies to reduce latency and maintain optimal performance.
2. Background tasks and scheduling pools
ClickHouse relies heavily on background workers to maintain performance, and metrics such as BackgroundPoolTask, BackgroundSchedulePoolTask, BackgroundMovePoolTask, BackgroundBufferFlushSchedulePoolTask, and BackgroundDistributedSchedulePoolTask indicate the load on various background processing pools. A growing queue in any of these tasks may signal resource exhaustion or inefficiency in handling operations. Site24x7 tracks these pools in real time and notifies you when queues start growing unexpectedly—often a sign of resource saturation or slow disk I/O. With this proactive insight, you can balance resource allocation or scale infrastructure before bottlenecks begin to affect query speed.
3. Thread utilization
Metrics like GlobalThread, GlobalThreadActive, LocalThread, and LocalThreadActive show how ClickHouse is utilizing CPU threads, helping determine whether the system is underused, overburdened, or in need of tuning to maximize parallelism and efficiency. You can correlate thread utilization with query latency and background task queues in Site24x7, alerting you when threads are maxed out or when performance lags despite idle threads. This pinpoints CPU misallocation or blocked execution paths.
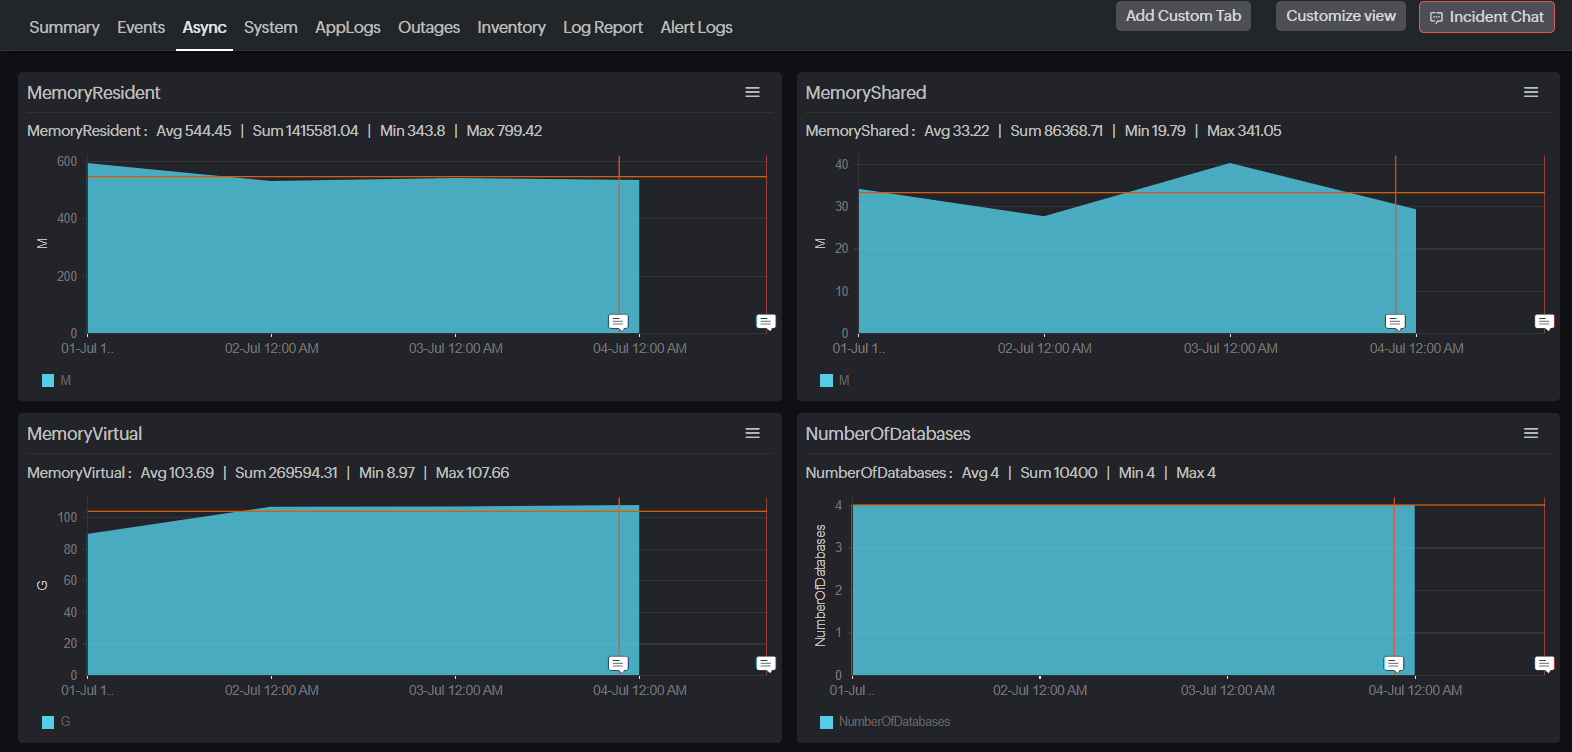
4. Memory usage
Memory consumption is one of the most important factors in ClickHouse performance. Metrics such as MemoryTracking, MemoryTrackingForMerges, and pool-specific usage metrics like MemoryTrackingInBackgroundProcessingPool allow you to monitor both overall and task-specific memory consumption. High memory usage may point to leaks, inefficient queries, or large merges running in the background. Site24x7 provides memory graphs and trend analysis to track growth over time and across tasks, while alerts on memory spikes during merges or flushes help you proactively investigate leaks or suboptimal usage patterns.
5. Dictionary cache metrics
ClickHouse uses caching mechanisms for external dictionaries, and metrics like DictCacheRequests, CacheDictionaryUpdateQueueBatches, and CacheDictionaryUpdateQueueKeys help evaluate cache efficiency. A low hit rate may result in slow joins or lookups, indicating the need for cache size adjustments or optimizations to dictionary update frequency. Site24x7 visualizes dictionary cache access trends and alerts you when update queues begin piling up, enabling you to fine-tune configurations or refresh strategies before JOIN-heavy analytics slow down.
6. Lock contention and concurrency
Locking issues can quickly degrade performance, and metrics like ContextLockWait, RWLockActiveReaders, RWLockActiveWriters, RWLockWaitingReaders, and RWLockWaitingWriters reveal how often threads are blocked due to locks. These insights allow you to identify and resolve concurrency problems before they affect query response times. You can detect contention hotspots in Site24x7 by tracking wait times and reader/writer imbalances, providing early warning signs to refactor workloads, avoid deadlocks, or increase parallelism where necessary.
7. Disk I/O and buffer health
Disk operations are a critical performance factor, with metrics like DiskSpaceReservedForMerge, OpenFileForRead, and OpenFileForWrite indicating how often disk resources are used and whether merge operations are reserving too much space. Additionally, StorageBufferBytes and StorageBufferRows show the amount of data waiting in memory buffers, helping you fine-tune insert and flush behavior. Site24x7 provides granular insights into disk buffer usage and flush activity, allowing you to track whether flushes are stalling or merges are over-consuming disk space, and sends alerts before storage pressure starts to impact ingestion or query performance.
8. Replication and networking
In distributed ClickHouse setups, metrics like ReplicatedFetch, ReplicatedSend, ReplicatedChecks, and ReadonlyReplica are crucial for assessing the health of replication. These metrics indicate whether replicas are in sync, if fetch or send operations are lagging, and whether any replicas have fallen into read-only mode. Alongside these, networking-related metrics such as DistributedFilesToInsert, DistributedSend, InterserverConnection, TCPConnection, and HTTPConnection provide visibility into how nodes communicate with each other and with external systems. Site24x7 helps you detect replication delays and failed sends in real time. It continuously monitors node communication health and triggers alerts if files fail to sync or replicas go stale, ensuring consistency and stability across distributed clusters.
9. External integrations and ZooKeeper health
ClickHouse often integrates with external systems like MySQL or PostgreSQL and depends on ZooKeeper for coordination. Metrics such as MySQLConnection, PostgreSQLConnection, SendExternalTables, and SendScalars help track the health of these integrations. ZooKeeper metrics like ZooKeeperRequest, ZooKeeperSession, ZooKeeperWatch, and EphemeralNode are critical for ensuring that cluster coordination remains intact. Site24x7 keeps tabs on ZooKeeper connections and session counts, alerting you when session drops or request delays could impact cluster availability. It also tracks database connection health, allowing early detection of integration failures or response latency.
Turning metrics into optimization
Metrics are only useful if you act on them. Here’s how to use them effectively:
Identify trends: Spikes in memory usage or delayed inserts can signal growing load. Use historical trends to forecast resource needs.
Set thresholds: Set alerts for query preemption, lock waits, or ZooKeeper session drops so you’re the first to know if something breaks.
Correlate metrics: High MemoryTracking alongside QueryPreempted usually means the server is out of memory, and queries are being dropped. Patterns like these help you triage faster.
ClickHouse monitoring made easy with Site24x7
ClickHouse is powerful, but like any high-performance engine, it needs regular tuning—especially when handling billions of rows. With the right metrics and tools in place, you can ensure smooth, responsive analytics that scale with your data.
With Site24x7's ClickHouse monitoring, you don’t just get raw metrics—you get custom dashboards, threshold-based alerts, and multi-application support. Whether you’re running ClickHouse on-premises, in the cloud, or across multiple data centers, Site24x7 gives you centralized observability without the noise.
Site24x7 provides deep insights into everything from background pools to ZooKeeper sessions—so you’re never in the dark. Start optimizing smarter and keep your analytics pipeline running like clockwork.