A server-side 5xx error is more than an inconvenience—it is a direct hit to user experience, revenue, and brand credibility. Whether it is a 500 Internal Server Error, a 502 Bad Gateway, a 503 Service Unavailable, or a 504 Gateway Timeout, each code signals that something broke deep in your backend stack.
A 2024 EMA study found that IT outages cost $14,056 per minute on average, and can cost as much as $23,750 per minute for large enterprises. That's why DevOps teams, SREs, and IT operations have to do all that it takes to detect and fix all server-side 5xx errors by understanding and isolating the root cause quickly enough to stop the bleeding.
In this journey, ManageEngine Site24x7, the enterprise-grade, AI-powered full-stack observability platform serves as a comprehensive digital experience monitoring platform. Site24x7 monitors HTTP status codes from more than 130 global locations, and after analyzing error trends over time, transforms your IT team from reactive firefighting mode into proactive warriors that ensure the best user experience.
The problem: 5xx errors disrupt access and trust
There are ten different 5xx HTTP status codes that point to the reasons why a server understood a request but could not fulfill it. Among the ten, the following top five errors occur most frequently:
500 Internal Server Error: An unexpected condition happened on the server.
501 Not Implemented: The feature or method requested is not supported.
502 Bad Gateway: The upstream server sent an invalid response.
503 Service Unavailable: The server is temporarily overloaded or down.
504 Gateway Timeout: No response was received within the expected timeframe.
Each error, while a server-side issue, has a subtle yet critical difference. For example, a 502 Bad Gateway error points to a breakdown in communication between servers, while a 503 Service Unavailable error is about the server's current state—it is too busy or in maintenance. A 504 Gateway Timeout is different still, signifying a delay in one of the many communication stages upstream. The lack of detailed context from traditional monitoring tools means these subtle differences are often lost, forcing IT teams into a manual hunt for the root cause. This wastes precious time in manual log hunts and guesswork, prolonging downtime.
These errors are standard across the web, applying to both HTTP and REST APIs. They are also prevalent in modern architectures like:
Kubernetes: Occurs when an ingress controller fails to process requests or a service exposes a faulty HTTP endpoint.
Microservices: Generated when a service communicating via HTTP or gRPC experiences an internal or dependency failure.
Cloud platforms (AWS, Azure, GCP, and OCI): Pass or generate 5xx errors when backend issues arise, propagating them downstream.
These errors serve as crucial windows into the health of your infrastructure. To monitor and resolve them quickly, you need a comprehensive website monitoring platform like ManageEngine Site24x7.
How Site24x7 detects and alerts on 5xx errors
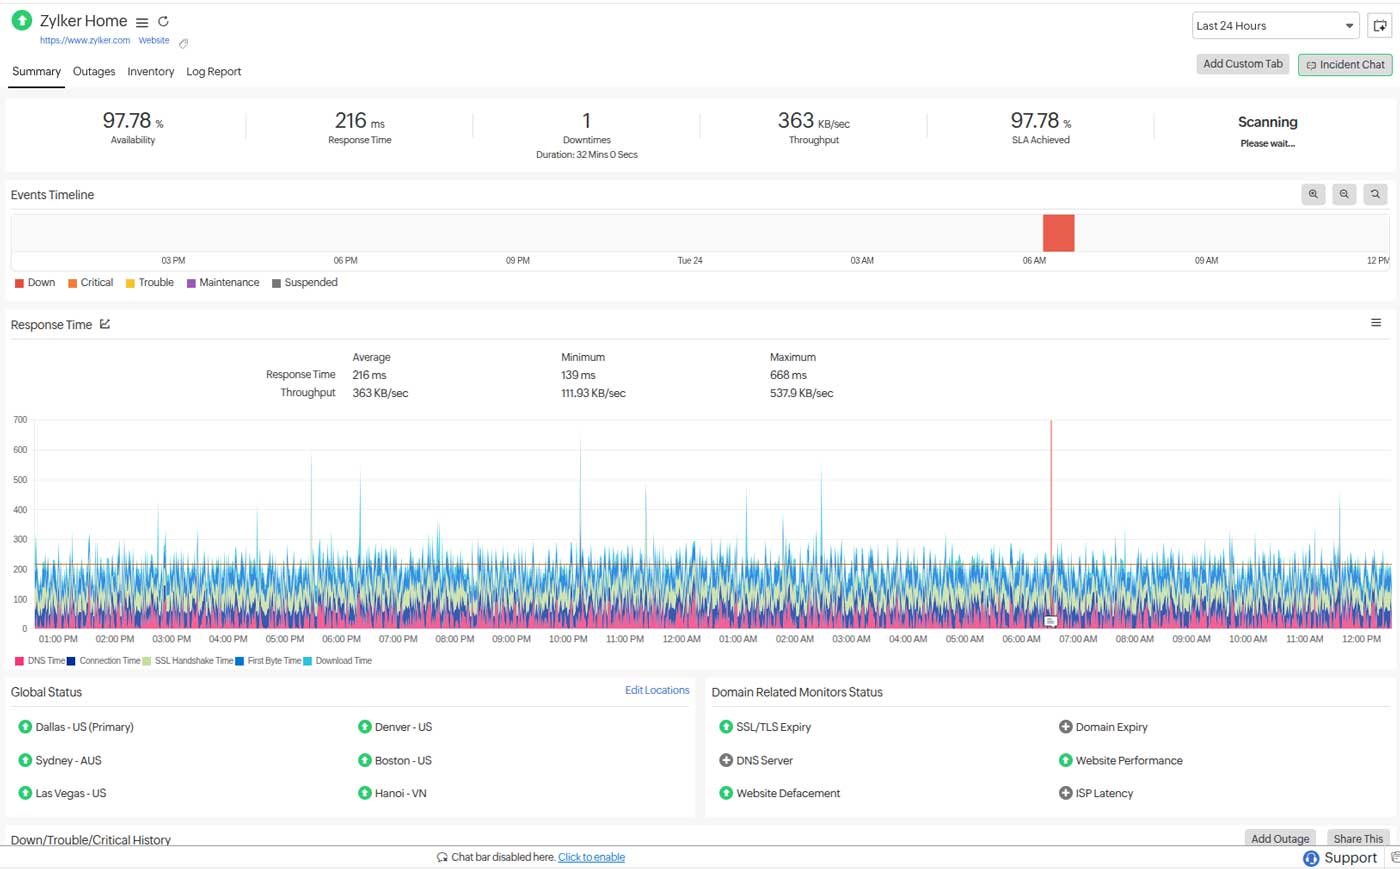
Site24x7 monitors websites continuously, checking HTTPs requests synthetically for your sites, APIs, and services, simulating real-user activity from multiple geographic regions. This proactive approach ensures you detect issues before your customers do. Each check records the:
- Exact 5xx code returned.
- Timestamp of occurrence (to the second).
- Location of the check.
- Endpoint or URL affected.
- Response time until the error appeared.
Please note that the alerts are triggered only when error rates exceed configured thresholds (either static or dynamic, Zia-powered), such as more than 1% 5xx responses over five minutes. To avoid false positives, Site24x7 rechecks the resource before firing alerts. Notifications can be sent through SMS, voice, email, push, or integrations like Slack, Microsoft Teams, Zoho Cliq, and PagerDuty. The result is an actionable alert with context removed from the noise.
Turning data into insight: HTTP status trend analysis
A single error snapshot tells you something broke. A trend tells you why it keeps breaking. Site24x7 aggregates 5xx responses into time-series graphs, giving you a visual view of error frequency and distribution. You can:
Identify spikes vs. sustained rises: Spikes often indicate sudden outages; sustained rises may signal resource leaks.
Spot recurring patterns: Errors appearing at the same time each day may align with backups or scheduled jobs.
Compare current vs. historical baselines: Deviations from normal error rates stand out immediately.
Catch intermittent issues: Trends expose problems that momentary checks might miss.
The above capabilities help detect and verify patterns, turning troubleshooting from guesswork into precision targeting.
Correlating errors with server loads and changes
Trend data alone is powerful, but Site24x7 goes further by correlating HTTP status trends with infrastructure metrics. You can overlay your 5xx trends with a variety of data points to find the root cause quickly.
CPU, memory, and disk: A spike in 503 errors alongside high CPU usage points to resource contention.
Network I/O: High traffic with rising 504s may indicate bottlenecks or upstream proxy issues.
Database latency and connections: Correlation with 500 or 504 errors can reveal query slowdowns or connection exhaustion.
Application performance metrics: A growing message queue tied to rising 502s signals backend processing lag.
Deployment timelines: A jump in errors after a code push often identifies a faulty release.
Further, with Site24x7’s APM Insight, you can probe further by tracing failing requests across microservices, databases, and external APIs to pinpoint exactly where latency or errors occur.
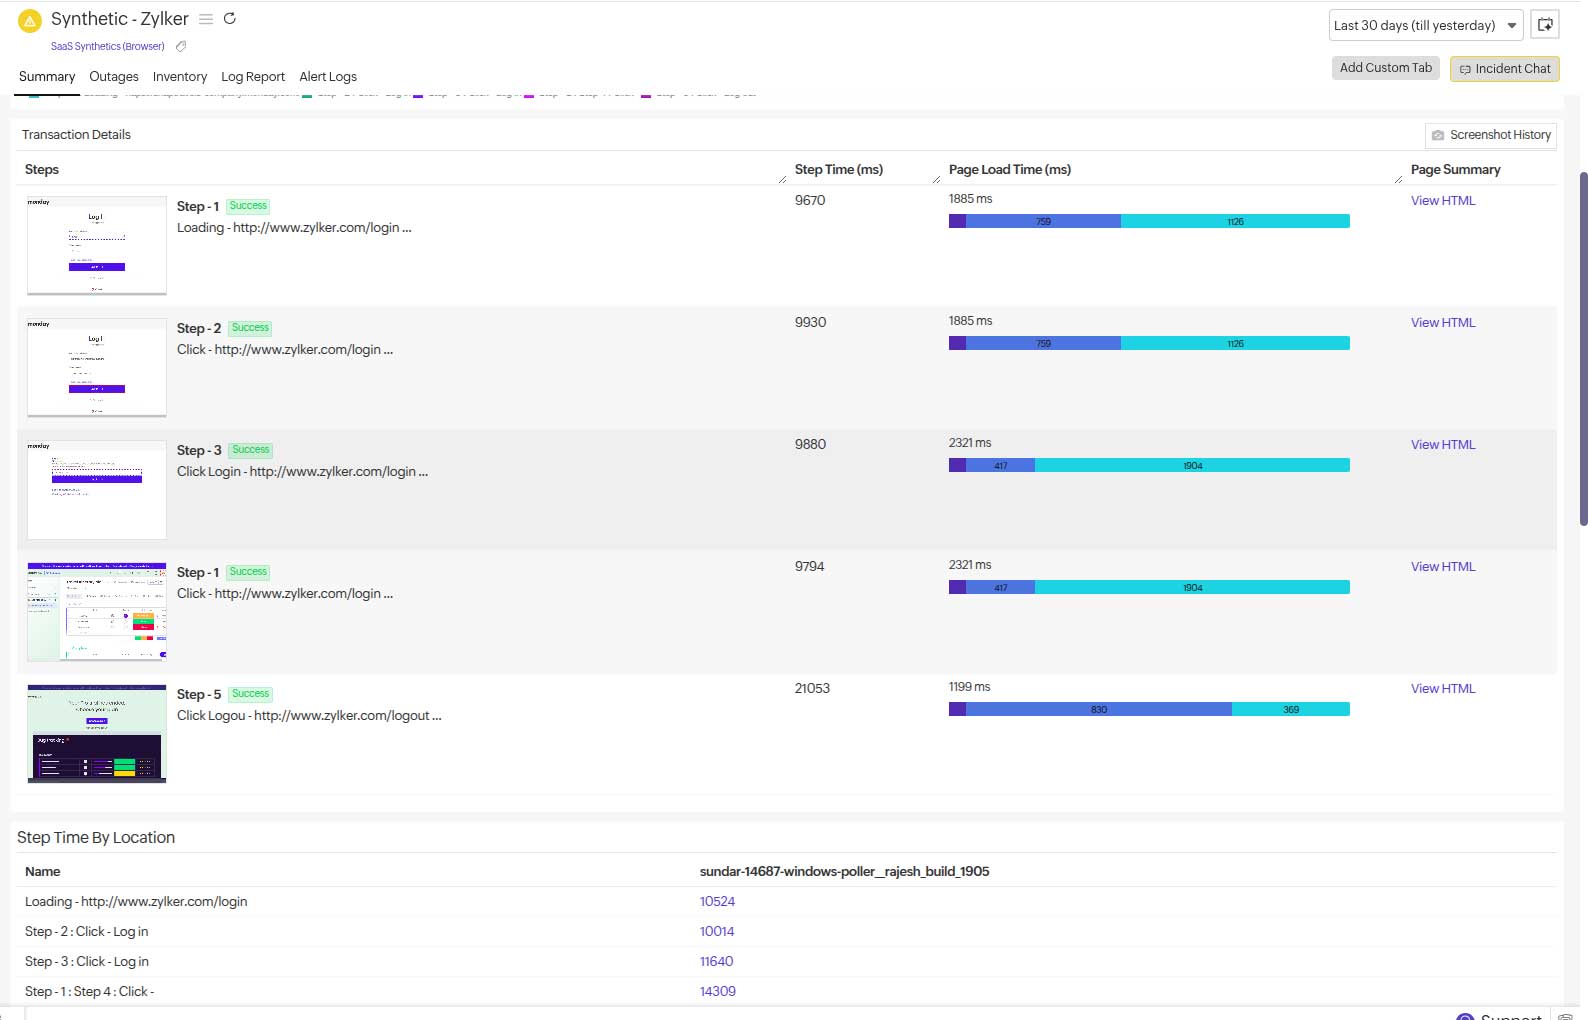
How HTTP status breakdowns appear in Site24x7
From the Status Codes tab within any website or web transaction monitor, Site24x7 displays:
Categorized response codes: 2xx (success), 3xx (redirects), 4xx (client errors), 5xx (server errors)
Filters for 5xx by:
- Time range
- URL path or endpoint
- Geographic location
- Monitor group
From here, you can drill down into:
Synthetic check details: Raw HTTP headers, payload, and even screenshots for web pages.
Resource metrics: CPU, memory, and network usage at the error moment.
Logs and traces: Directly linked if log management or APM is integrated.
This unified interface means you do not have to switch between tools, because you can move from detection to root cause analysis within the same platform.
Automating early detection and resolution
Site24x7 reduces mean time to repair (MTTR) through proactive automation:
Smart alerts: Threshold and anomaly-based detection prevent alert floods while catching early warning signs.
Multi-channel notifications: Reach the right people, fast.
IT automation actions: Restart a service, scale up a server, or clear a queue automatically when certain 5xx patterns are detected.
Root cause correlation: Error trends are automatically linked to server logs or traces for direct investigation.
For example, if a 503 spike coincides with a memory leak in a caching service, Site24x7 can both alert you and restart the service automatically.
A case to consider
A global news portal faced recurring 5xx errors during peak events, leading to delays, missed ad impressions, and frustrated readers. Its old setup gave only site down pings, forcing engineers to sift through multiple systems.
After switching to Site24x7:
Monitoring scope: The main portal, CPU usage, APIs, and microservices are tracked from regions that most affect your target markets. Spikes in 503 errors are then found to be in correlation with high CPU usage, to isolate the root cause.
Root cause correlation: A newly deployed caching service was leaking memory under the heavy load.
A drastic reduction in MTTR followed by a rapid recovery: What once took hours to diagnose was resolved in under 10 minutes.
Business impact and reliability improvement over the the long term: Consistent uptime during high traffic boosted user engagement and ad revenue.
This case demonstrates how trend analysis turned a chaotic error management process into a streamlined operation, ensuring a better user experience and protecting the portal's reputation.
Why Site24x7 matters
For enterprises, HTTP status trend analysis helps ensure IT resilience by helping IT teams:
Isolate root causes faster: Move from symptoms to fixes in minutes.
Minimize downtime: Keep SLAs intact and avoid revenue loss.
Enhance digital experience: Monitor performance from the user's perspective.
Empower teams: Free up engineers to focus on optimization and innovation.
With Site24x7, you can:
Set up synthetic monitoring and real user monitoring for key endpoints.
Define baselines for acceptable error rates (e.g., <1% 5xx) and track anomalies.
Integrate with logs and APM for full-stack visibility.
Automate remediation where possible.
By following these steps, you will turn what used to be chaotic post-mortems into swift, data-driven recoveries.
Don't let server-side errors chip away at your uptime, user trust, and revenue. See how Site24x7's HTTP status trend analysis can help you detect, diagnose, and resolve 5xx issues before your customers even notice.
Learn more about Site24x7's website monitoring and begin your free trial.
Glossary
- 500 – Internal Server Error: An unexpected condition occurred.
- 501 – Not Implemented: The feature or method isn’t supported.
- 502 – Bad Gateway: The upstream server sent an invalid response.
- 503 – Service Unavailable: The server is temporarily overloaded or down.
- 504 – Gateway Timeout: No response received within the expected timeframe.
- 505 – HTTP Version Not Supported: Indicates that the server does not, or is refusing to, support the HTTP version used in the client request.
- 506 – Variant Also Negotiates: Content negotiation error.
- 507 – Insufficient Storage: Server can’t store required data.
- 508 – Loop Detected: Infinite request processing loop.
- 509 – Not Extended: Missing required HTTP extensions.
- 510 – Network Authentication Required: Client must authenticate (e.g., Wi-Fi hotspot).