Improve uptime for your client infrastructure with centralized virtualization monitoring to manage VMs, hypervisors, and clusters across multiple client environments with speed and scale. With complete visibility into hosts, VMs, clusters, containers, and cloud workloads, MSPs can proactively detect bottlenecks, optimize resource usage, and meet stringent SLAs.
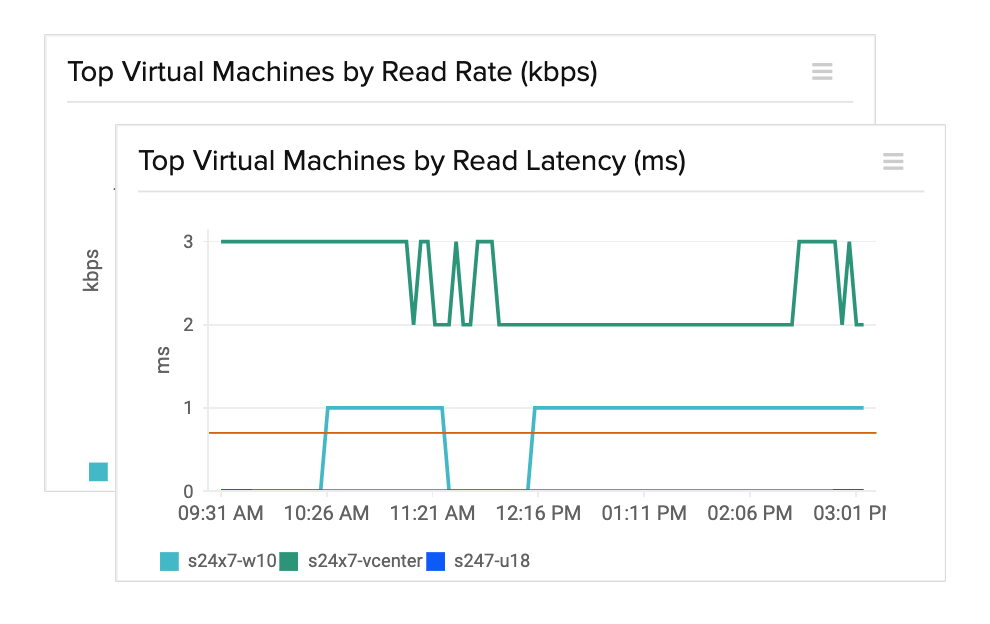
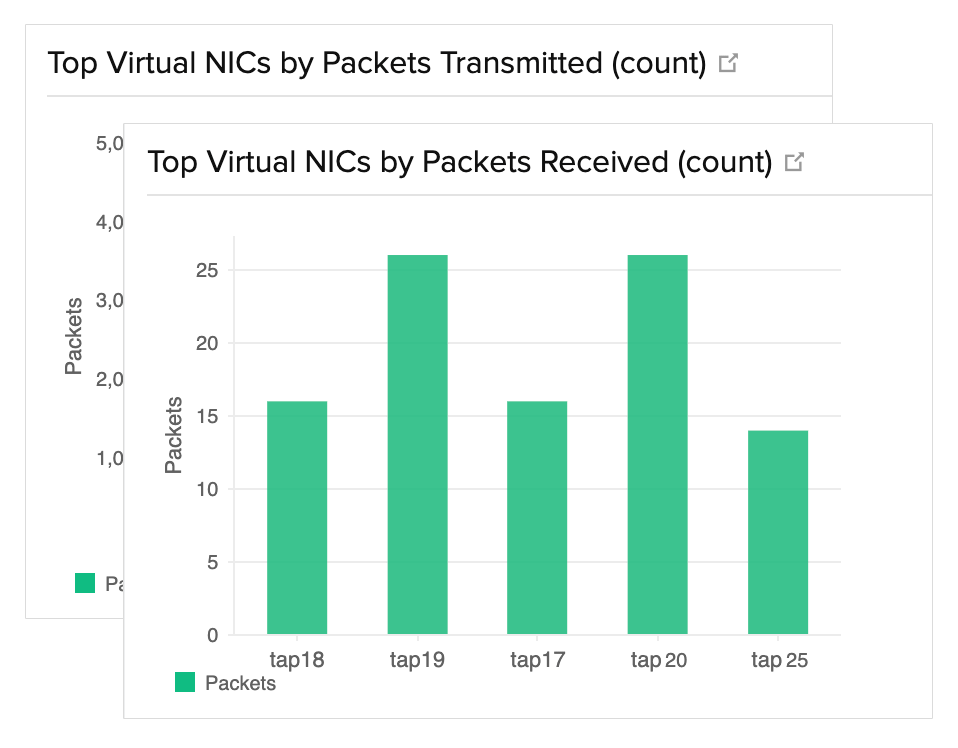
Start 30-day free trialTry now, sign up in 30 secondsGet complete visibility into VMware vSphere, from vCenter and hosts to VMs and datastores. Manage multiple customer setups from a single console with multi-tenant support:
Deliver seamless oversight of customer Nutanix clusters, hosts, storage containers, and VMs. MSPs can ensure high performance and balanced workloads across client deployments with:
Support customers running Microsoft Hyper-V with availability and performance insights into hosts and virtual machines. MSPs can ensure reliability through:

Obtain end-to-end visibility across resources and gain control over your VDI environment with Site24x7’s VDI monitoring tool.

Manage cloud and on-premise VMs together across AWS, Azure, Google Cloud, and Oracle Cloud as customers move to hybrid setups. MSPs can benefit from:
As RMM software developed for uninterrupted service delivery, Site24x7 helps you support your clients' capabilities by offering specialized tools for their unique monitoring needs.
Securely manage the accounts of multiple customers. Gain total visibility into client systems and scale to accommodate any number of customers.
Rebrand your monitoring platform and reports with a custom name, logo, and URLto promote your brand and allow customers to identify with it.
Use operational roles to manage customer accounts. Unified licensing gives admins full control over subscriptions, billing, upgrades, add-ons, and alert credits.
Reduce the risk of oversight by automatically resolving event alerts. Execute IT automation by mapping multiple automation templates to reboot your entire workflow.
Create customized dashboards, NOC views, and business views to highlight all metrics impacting the performance of your infrastructure stack for your clients.
Attain charts and graphs illustrating performance against SLA benchmarks over time. Send SLA reports to update customers about your service consistency.
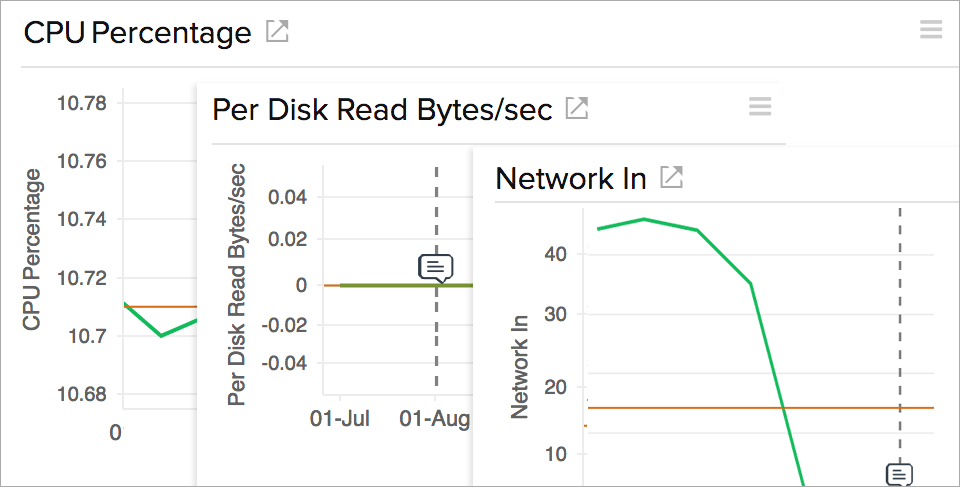
Quickly detect performance issues in servers, applications, network devices, and cloud resources in real time—all from a single central dashboard.
Examine historical data patterns and identify correlations in resource usage trends to anticipate demands and plan capacity effectively.
Receive notifications via SMS, email, voice, and more. Seamless integrations with Slack, Teams, Jira, and other tools are also available..