Leverage Site24x7 for a scalable, cloud-native network monitoring solution tailored for managed service providers (MSPs). It brings together network availability, performance monitoring, NetFlow analysis, and configuration management into a single platform, helping you proactively manage client networks with ease and efficiency—ensuring optimal performance and minimizing downtime.

Ensure the uptime and fault management of all your SNMP devices with a secure, firewall-friendly architecture.
Automatically discover all the devices present within a provided IP range—or an entire network range—using SNMP.

View top devices based on response time and packet loss, along with top interfaces based on traffic, bandwidth utilization, errors, and discards.

Obtain complete visibility using maps. Automate discovery and mapping with Layer 2 maps and create your network schema using topology maps.

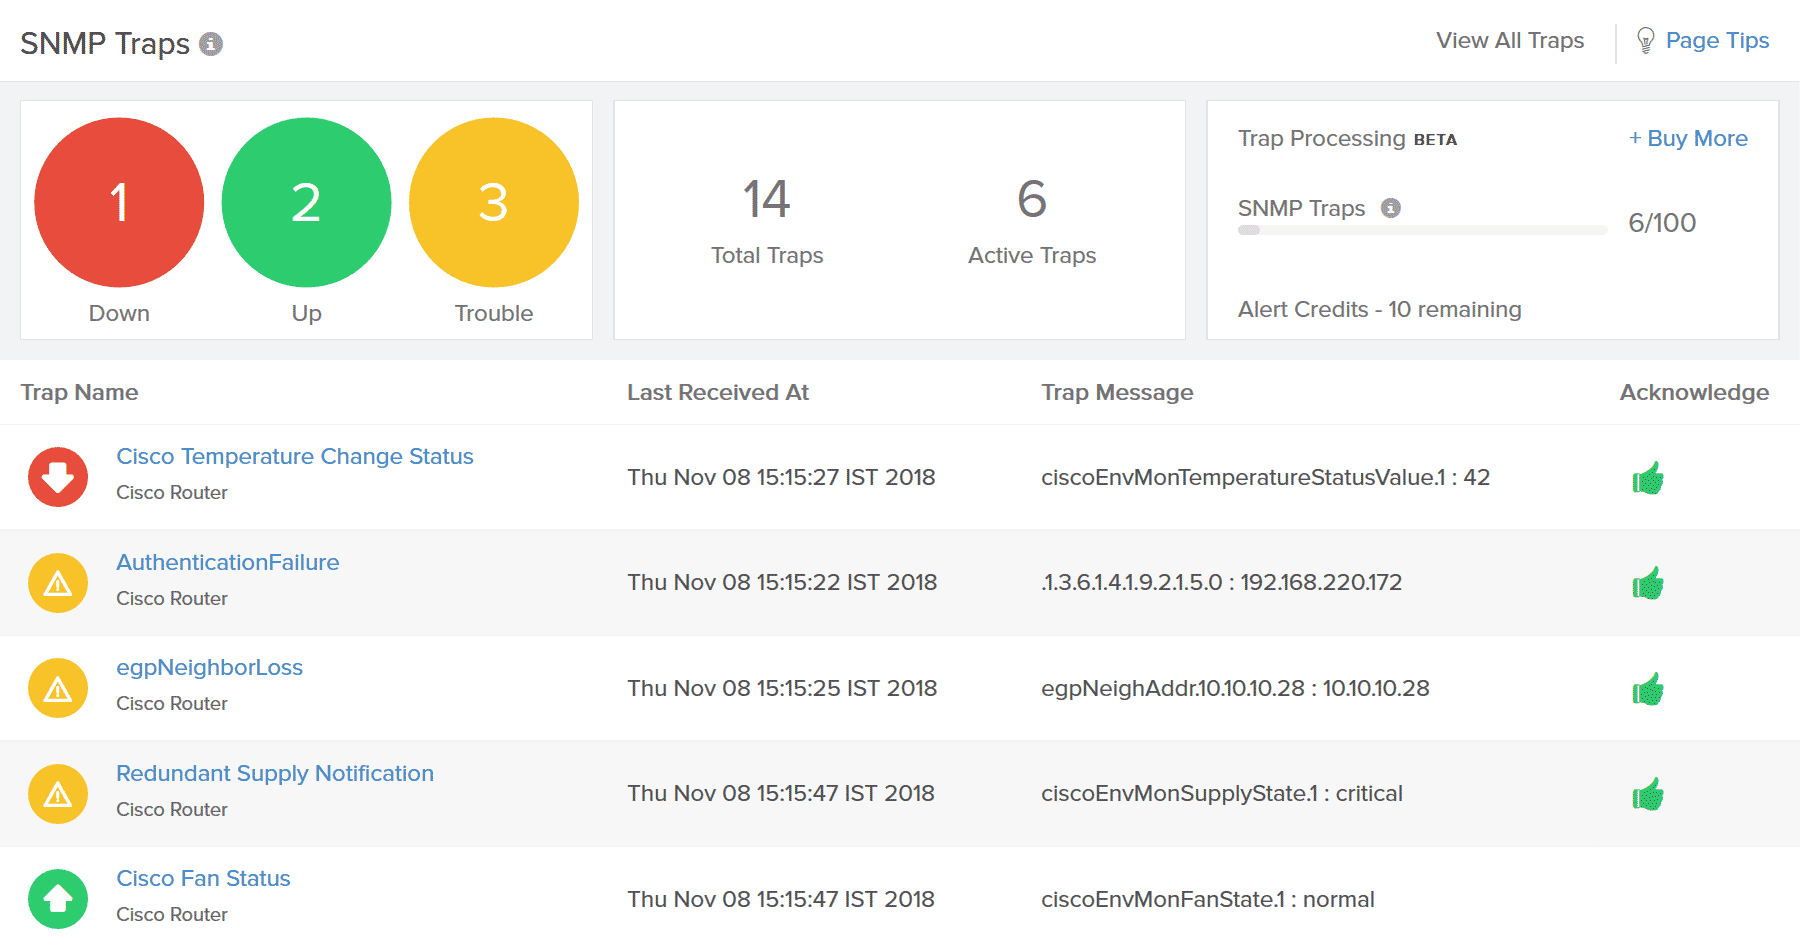
Configure network devices to send SNMP traps to Site24x7, and receive processed alert messages for any trap defined in your SNMP MIB.

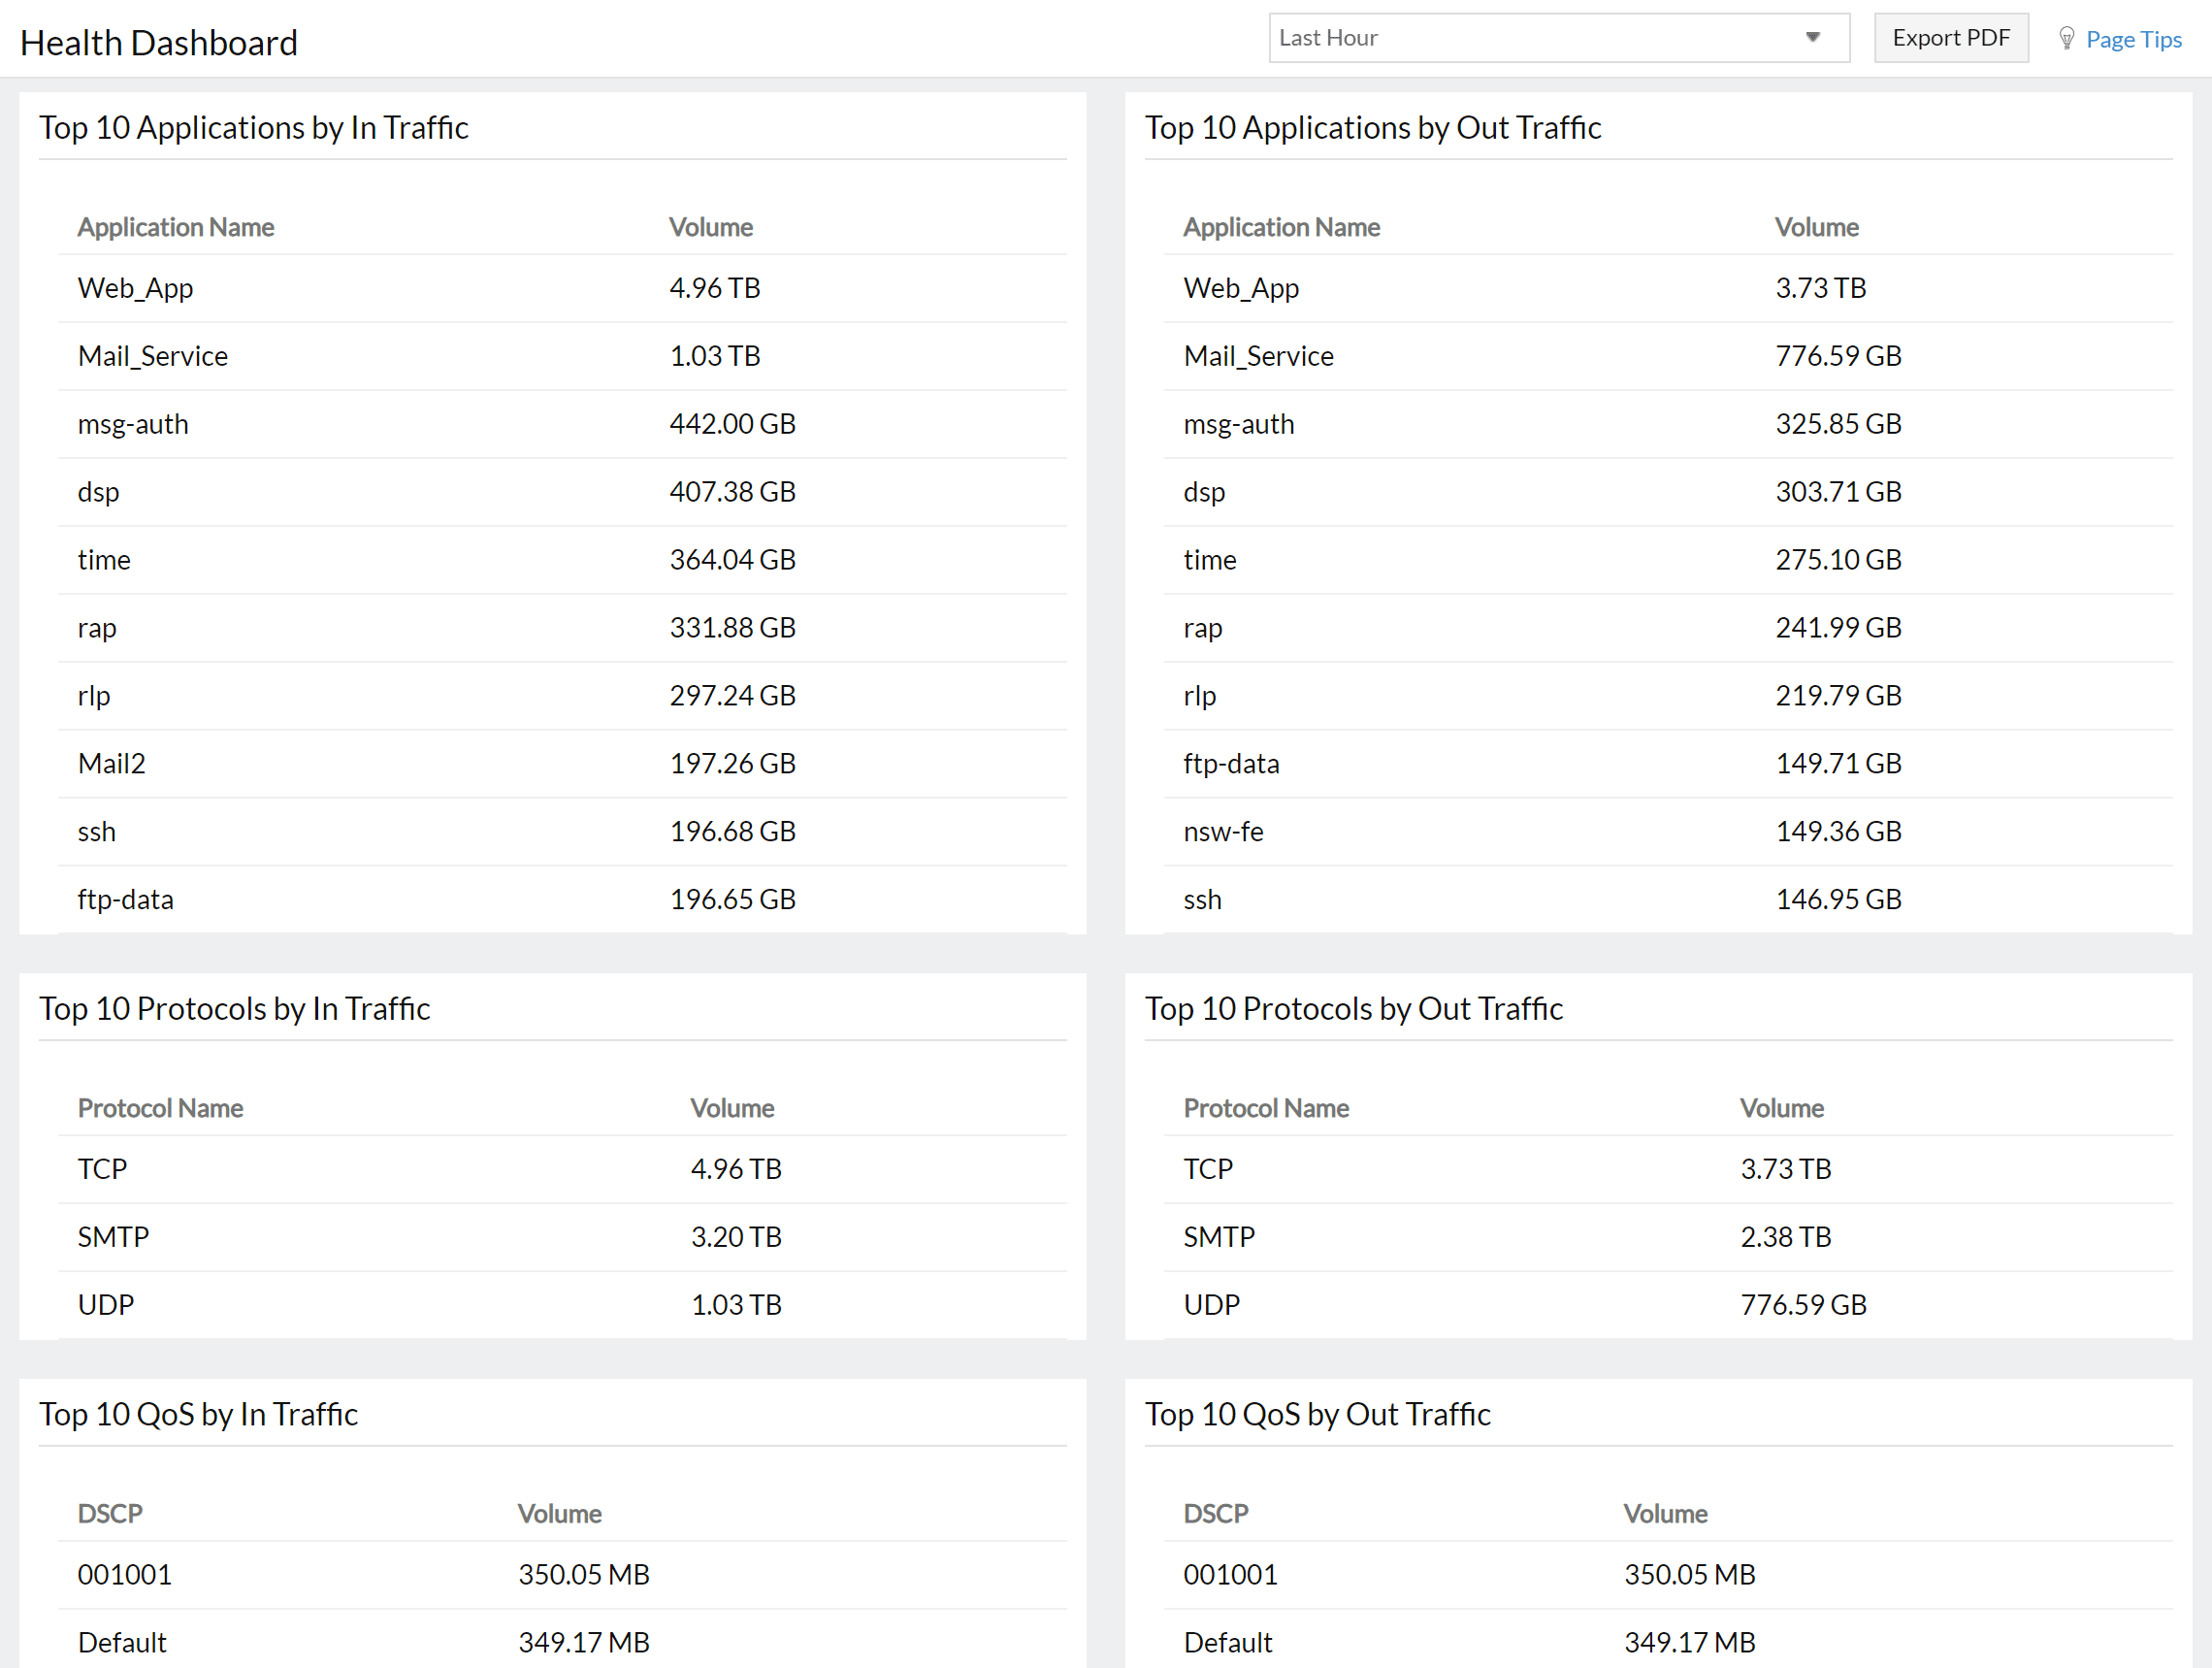
Gain deep visibility into traffic usage and perform smarter analysis by identifying top talkers, bandwidth-consuming applications and protocols, and more.

Streamline configuration management with network automation, real-time compliance checks, and proactive firmware vulnerability detection.

Ensure optimized performance, reliable connectivity, and seamless application delivery across SDN and SD-WAN environments like Cisco Meraki, Cisco ACI, and VMware SD-WAN.

Simplify IP address management (IPAM) with automated subnet discovery, real-time IP status updates, and conflict detection

As RMM software developed for uninterrupted service delivery, Site24x7 helps you support your clients' capabilities by offering specialized tools for their unique monitoring needs.
Securely manage the accounts of multiple customers. Gain total visibility into client systems, and scale to accommodate any number of customers.
Rebrand your monitoring platform and reports with a custom name, logo, and URL so you can promote your brand and so that customers can identify with it.
Use operational roles to manage customer accounts. Unified licensing gives admins full control over subscriptions, billing, upgrades, add-ons, and alert credits.
Attain charts and graphs illustrating performance against SLA benchmarks over time. Send SLA reports to update customers about your service consistency.
Create customized dashboards, NOC views, and business views to highlight all metrics impacting the performance of your infrastructure stack for your clients.
Reduce the risk of oversight by automatically resolving event alerts. Execute IT automation by mapping multiple automation templates to reboot your entire workflow.
Quickly detect performance issues in servers, applications, network devices, and cloud resources in real time—all from a single central dashboard.
Examine historical data patterns and identify correlations in resource usage trends to anticipate demands and plan capacity effectively.
Receive notifications via SMS, email, voice, and more. Seamless integrations with Slack, Teams, Jira, and other tools are also available.