Time to Interactive (TTI) is the silent gatekeeper of user satisfaction in the digital realm. It marks the moment a webpage shifts from a static display to a dynamic environment, ready for user interaction.
In the currency of web performance, a low TTI is gold. It means a seamless transition for users from page load to active engagement—crucial for holding their fleeting attention.
A high TTI is the antagonist in the user experience narrative. It breeds frustration like a slow-ticking clock, turning eager visitors into lost opportunities. The longer a user waits, the more likely they are to abandon the quest for content, leaving behind what could have been an engagement, a conversion, or a customer.
Optimizing TTI is more than just a technical exercise—it’s foundational for any successful online presence.
TTI is measured using a more granular and technical approach than other web performance metrics. It doesn’t merely clock the loading of elements—it gauges the readiness of a page for user interaction. Technically speaking, TTI measures the span between the initiation of the page load and the point where a browser’s main thread is quiet enough to handle user input.
To understand TTI, you need to be familiar with a few other metrics that directly relate to it. Let’s look at them now.
To calculate the TTI, start your timer when the page shows the first bit of content (the FCP). The calculation period concludes at the end of a long-running task (often involving JavaScript loading). During this idle period, the page should not execute any complex operations, and the browser should have no more than two pending GET requests to fetch data from external sources.
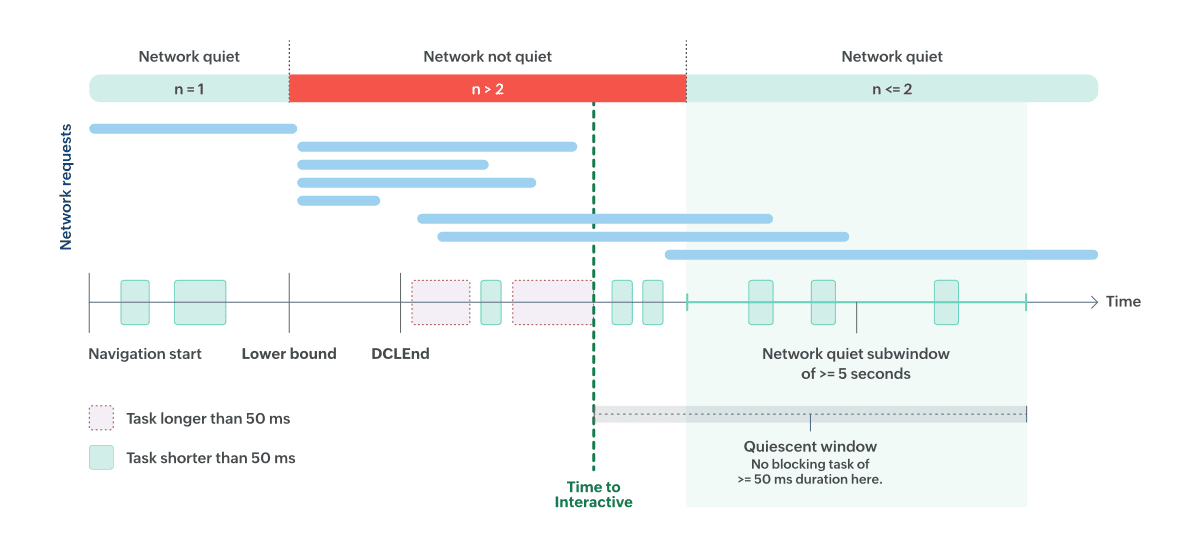 Fig. 1: Diagram demonstrating how to calculate the TTI
In this context, a GET request is a method the browser uses to request data from a server, typically to retrieve webpage content or other resources. It’s a fundamental part of web browsing, enabling the transfer of information from a web server to a client. Pages can be interactive for the user before GET requests are complete, and these GET tasks may run in the background to fetch additional data after the user interacts with the page.
The duration of this low-activity period between the final long-running task and the 5-second idle window is the TTI. If the page doesn’t process complex operations after showing the first content, the TTI equals the FCP.
The criteria for an acceptable TTI vary, but the benchmark is typically five seconds or under. Achieving this metric ensures that a page feels snappy and responsive to the end user.
Developers can measure TTI with common browser tools, such as the Performance insights feature in Chrome DevTools. Performance insights simulate how users interact with a page and measure the TTI alongside other metrics. It reports the TTI by evaluating the readiness of the page to respond to user input at various stages of the loading process. By using this data to identify bottlenecks and optimization opportunities, developers can enhance the interactive readiness of their web pages.
Here’s an example of a Performance insights report, which clocked the TTI for the Site24x7 home page at 250 milliseconds. You can also see the FCP, LCP, and DCL on the timeline.
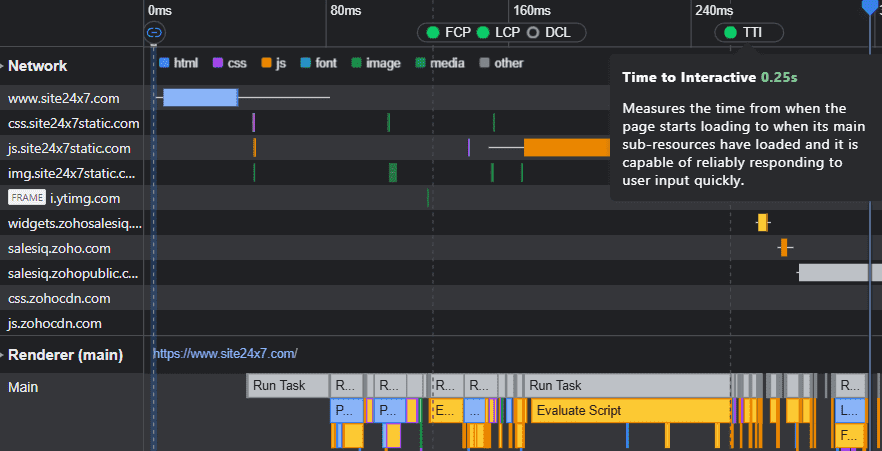 Fig. 2: Chrome DevTools’ Performance insights window indicates the FCP, LCP, DCL, and TTI
Imagine clicking a link to a recipe blog. As the page starts to load, the timer begins.
When the user views the first piece of content on the screen, it’s the initial milestone, the FCP. Then, the article text swiftly fills in the spaces, triggering the DCL event. The document is now somewhat interactive, though not necessarily fully functional.
The final stage in the TTI timeline is identifying a stable network window with minimal or no network activity related to the page load. This inactivity indicates that the browser has fetched most, if not all, of the necessary elements from the server.
During the stable network window, the main thread must be free from long tasks (those exceeding 50 milliseconds) for at least 5 seconds. In this window, the page is considered fully interactive. It can respond to user interactions within 50 milliseconds, meeting the interactive threshold for a seamless user experience.
Understanding the barriers to quick interactivity is key to unlocking a swift TTI score, so let’s explore the culprits. From the weighty execution of JavaScript to the unwieldy size of files, we’ll dissect how the offenders conspire to clog the browser’s main thread.
Optimizing TTI to refine web performance is a multifaceted endeavor, requiring a strategic approach that includes the following:
Tools like Google PageSpeed Insights play an instrumental role in this optimization process. By analyzing a webpage, PageSpeed Insights can pinpoint areas for performance improvements, offering clear, actionable recommendations. It measures a page’s performance on mobile and desktop devices, providing suggestions for critical areas like TTI and outlining steps such as minifying code or leveraging browser caching to enhance speed.
Taking a holistic approach to these strategies improves TTI and enhances the overall user experience, leading to better engagement, retention, and conversion rates.
Ensuring a low TTI score is not a one-off task—it requires ongoing vigilance. As webpages evolve, updates and content changes may impact performance. Therefore, continuous monitoring is crucial.
Site24x7 offers a comprehensive solution for this very purpose. With its Real User Monitoring (RUM), developers can gain insights into real-time user experiences broken down by browser, platform, and geography. This data is invaluable for identifying patterns that may indicate performance regressions, allowing for swift, data-driven optimizations.
Incorporating Site24x7’s server and application performance management into your workflow enables a proactive stance on TTI. By continuously tracking key parameters that influence TTI, such as server health, application bottlenecks, and network device performance, Site24x7 helps you pinpoint and address issues before they affect your users. The platform’s log management capability also supports the cause by centralizing log data, making it easier to analyze trends and troubleshoot quickly.
Regularly using solutions like Site24x7 helps you maintain an optima web vital score while underscoring your commitment to quality user experiences. They can give you the necessary insights to stay ahead of performance dips, keeping users engaged and conversions high.
A website’s responsiveness is a critical factor in user satisfaction. Employing strategies such as minimizing main-thread work and reducing JavaScript execution are key to achieving a lower TTI, which is essential for creating a seamless online experience. By conducting regular performance monitoring with solutions like Site24x7, you can maintain these gains.
To gain deeper insights and proactive solutions, sign up for a free Site24x7 trial and begin troubleshooting your TTI scores today.
Site24x7 RUM (Real User Monitoring) and Synthetic Web Transaction Monitoring capture TTI metrics to help you understand how quickly your page becomes fully interactive for users.
Yes, Site24x7 provides historical data and trend analysis for TTI and other web vitals, allowing you to see the impact of your optimization efforts.
Yes, Site24x7 offers performance thresholds and anomaly detection for TTI. You can set custom thresholds or use AI-based dynamic thresholds to receive alerts if your page load times degrade beyond acceptable limits.