Microservices are an architectural approach where a single application is broken into tiny services, which serve as independent applications that can be run on a variety of different server instances. They are modular, scalable, and easy to test.
Microservices enable the faster delivery of software applications. On the flip side, the increased number of services can make the applications more complex, add latencies, and make them laborious to manage and debug. However, the proactive monitoring of microservices aids in enhancing service uptime, early identification of problems, and ease of management.
In this article, we’ll focus on how to set up a fully functional monitoring stack with Prometheus and Grafana using Prometheus Operator.
Prometheus is an open-source time series database that monitors targets using an active pull mechanism. It has an entire collection of prebuilt exporters to retrieve data from almost all systems in real time.
A basic Prometheus architecture is illustrated below:
 Fig. 1: Monitoring stack architecture with Prometheus and Grafana
Although it has several moving parts, the Prometheus server and Alertmanager are two components to highlight. The Prometheus server pulls the metrics data from applications or devices, then processes and stores it. Alertmanager sends the alerts to end users via email, Slack channels, and other tools. Prometheus is flexible enough to quickly integrate with other tools like Grafana for better data visualization.
Grafana is a powerful open-source visualization engine that runs on top of collected metrics to build customizable dashboards.
There are two prerequisites for deployment:
For demo purposes, we have built a Kubernetes cluster using minikube in a Linux sandbox:
tools@sandbox1:~$ kubectl version
Client Version: version.Info{Major:"1", Minor:"24",
GitVersion:"v1.24.1",
GitCommit:"3ddd0f45aa91e2f30c70734b175631bec5b5825a",
GitTreeState:"clean", BuildDate:"2022-05-24T12:26:19Z",
GoVersion:"go1.18.2", Compiler:"gc", Platform:"linux/amd64"}

Kustomize Version: v4.5.4

Server Version: version.Info{Major:"1", Minor:"23",
GitVersion:"v1.23.3",
GitCommit:"816c97ab8cff8a1c72eccca1026f7820e93e0d25",
GitTreeState:"clean", BuildDate:"2022-01-25T21:19:12Z",
GoVersion:"go1.17.6", Compiler:"gc", Platform:"linux/amd64"}
Further, we also installed Helm, a package manager for Kubernetes that automates the configuration and deployment of applications and services on the container orchestration system:
tools@sandbox1:~$ helm version

version.BuildInfo{Version:"v3.9.0",
GitCommit:"7ceeda6c585217a19a1131663d8cd1f7d641b2a7",
GitTreeState:"clean", GoVersion:"go1.17.5"}
There are three ways to deploy the Prometheus monitoring stack on the Kubernetes cluster.
We’ll focus on the third option, using Helm Charts maintained by the Helm community for our deployment.
Let's add the below repository URL to get the latest kube-prometheus-stack Helm Chart from the Prometheus community:
# helm repo add prometheus-community https://prometheus-community.github.io/helm-charts

# helm repo update
Next, install the kube-prometheus-stack charts through the Helm install command:
# helm install prometheus prometheus-community/kube-prometheus-stack
We’ve now created all the Prometheus and Grafana components for polling, storing, and visualizing the key performance indicators of microservices.
For a quick view of the Prometheus and Grafana components using the Helm charts, use the kubectl get all command to get a high-level view of all components:
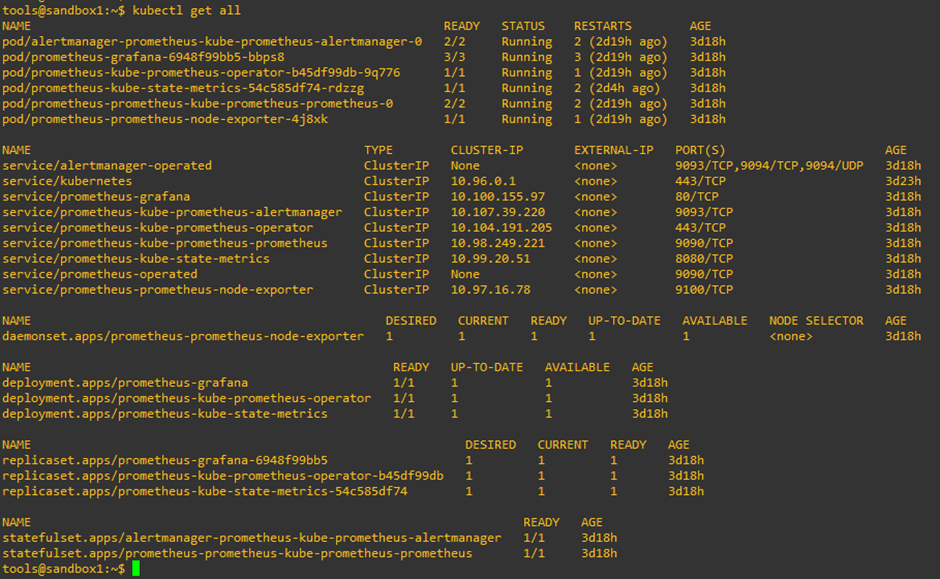 Fig. 2: Deployment status from our lab instance
We have two StatefulSets in the deployment for running the Prometheus server and Alertmanager. We also have deployments for Grafana, Prometheus Operator, and Kube state metrics. Here, the Operator effectively manages the Prometheus monitoring instances in an automated way. It also creates the fundamental components of Prometheus like Alertmanager and the Prometheus server.
Finally, the Kube state metrics are the internal Helm Charts that scrape Kubernetes components inside the cluster and make them available for Prometheus. Here, the pods are created through deployments and StatefulSets. Additionally, there are a bunch of microservices that the Prometheus components have within the pods to allow for the smooth functioning of services.
DaemonSet is a vital component that runs on every worker node in the Kubernetes cluster. In the above deployment status, the node-exporter DaemonSet will connect to the server and translate the worker node metrics into Prometheus metrics like CPU load, memory, and network.
The pod replicas are determined through the ReplicaSets, while Kubernetes Secrets allow us to store the pieces of highly sensitive data for Grafana, Prometheus, and the Operator, like certificates, passwords, and tokens.
ConfigMaps provide the configuration for monitoring the components of the worker node and cluster:
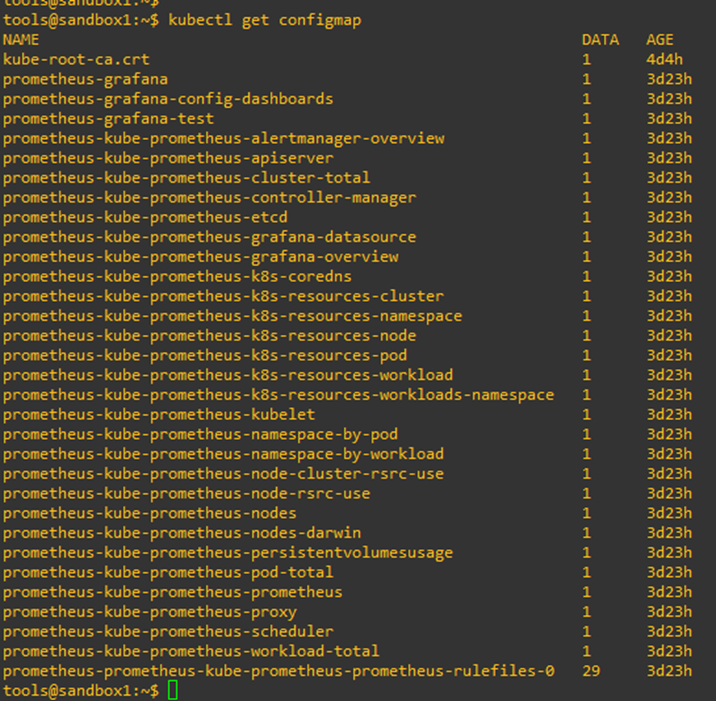 Fig. 3: Deployment configuration
We can also view the configuration of the Prometheus server using the following command, as it delves deeper into the image-level constructs:
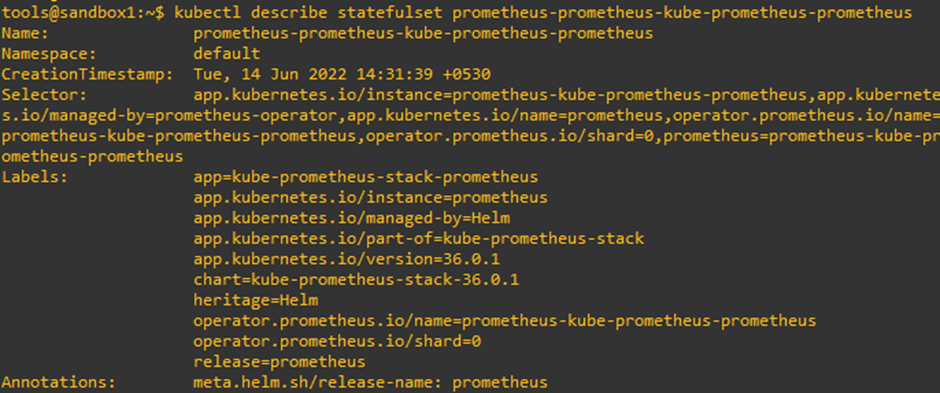 Fig. 4: Configuration of Prometheus server
Next, we will get the list of pods mapped with the Prometheus Alertmanager using the kubectl get pod command:
tools@sandbox1:~$ kubectl get statefulset
NAME                                                   READY
AGE
alertmanager-prometheus-kube-prometheus-alertmanager   1/1     5d
prometheus-prometheus-kube-prometheus-prometheus   	1/1     5d

tools@sandbox1:~$ kubectl get pod alertmanager-prometheus-kube-prometheus-alertmanager-0
NAME                                                     READY
STATUS	RESTARTS     AGE
alertmanager-prometheus-kube-prometheus-alertmanager-0   2/2
Running   2 (4d ago)   5d
Now let’s log in to the Alertmanager pod to configure and manage the alert rules:
tools@sandbox1:~$ kubectl exec -n default alertmanager-prometheus-kube-prometheus-alertmanager-0 -it -- /bin/sh
/alertmanager $ ls /etc/alertmanager/config/
Alertmanager.yaml
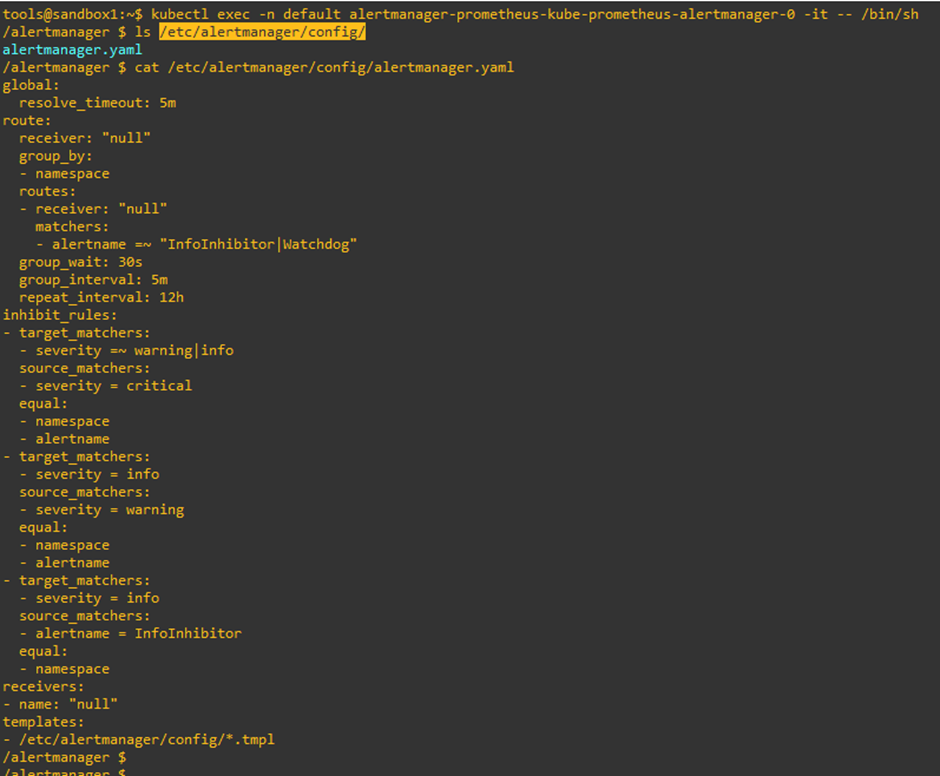 Fig. 5: Prometheus Alertmanager configuration file
Here, the route block represents where the alerts have to be routed. The receiver option indicates the recipient of the alerts, while inhibits _rules will silence the service alerts if the same circumstances have already caused another alert to be fired. Alertmanager can be further integrated with tools like PagerDuty or webhooks. The sample Alertmanager configuration is shown above.
Generally, the application is deployed on the Kubernetes resource and managed through Kubernetes API and the kubectl tool. The Kubernetes operator is an application-specific controller that aids systems administrators in managing application instances. It can create, configure, deploy, and manage the instance of complex applications through the Kubernetes API.
Overall, it works as a closed-loop automation system for managing operational aspects of the deployed application. Internally, the operator uses a custom resource for the management of application components. Based on best practices, the operator translates high-level directives in the Custom Resources (CR) into low-level actions.
As highlighted before, a custom resource is the API extension of the Kubernetes API server. Usually, the custom resource definition (CRD) defines a CR and lists all the configurations available to the operator’s users. The custom controller maintains the desired state of the applications through CR.
Prometheus has a wide range of components that track multiple infrastructure and software metrics. However, the deployment and maintenance of all Prometheus components are cumbersome. Prometheus Operator simplifies and streamlines the configuration, deployment, and maintenance of components in the Prometheus monitoring stack.
For example, in Kubernetes, the StatefulSet and deployments manage the lifecycle of pods and replicas. Similarly, Operator manages the combination of all components as a single unit, providing several features, including:
Helm, a package manager for Kubernetes clusters, sits atop Prometheus Operator and provisions a production-grade monitoring stack very quickly.
Here, we use Helm to do the initial setup, and then Operator manages the setup.
We can access the Grafana web UI by port-forwarding the services to port number 3000:
tools@sandbox1:~$ kubectl port-forward svc/prometheus-grafana 3000:80
Forwarding from 127.0.0.1:3000 -> 3000
Forwarding from [::1]:3000 -> 3000
Handling connection for 3000
Handling connection for 3000
Next, go to http://localhost:3000 to see the Grafana webpage below:
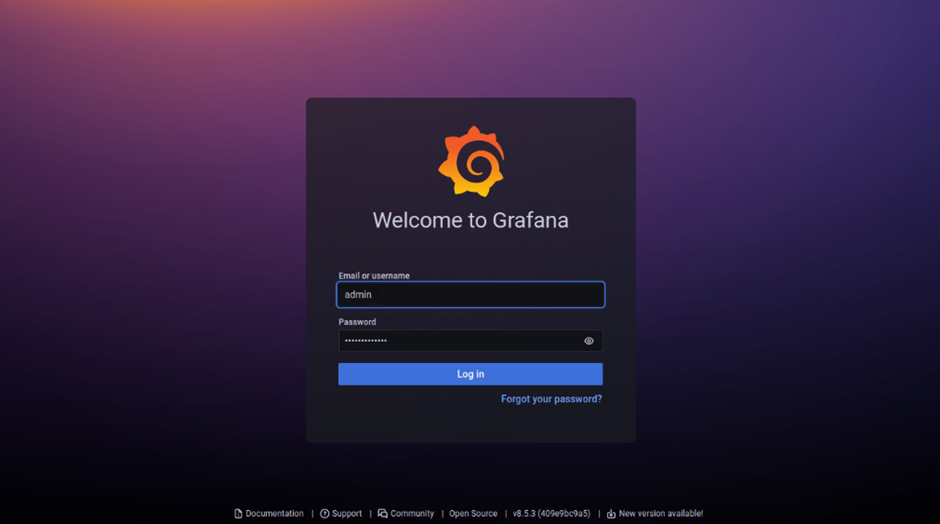 Fig. 6: Grafana login page
To access Grafana, the default username is admin, and the password is prom-operator. However, the password can be extracted either directly from Secrets using the command below or through the Prometheus Operator GitHub repo:
tools@sandbox1:~$ kubectl get secret --namespace default prometheus-grafana -o jsonpath="{.data.admin-password}" | base64 --decode; echo
prom-operator
After logging in with the valid credentials, click on Dashboard, then Browse to access the numerous built-in dashboards provided by the community on kube-prometheus-stack for microservices in the cluster infrastructure:
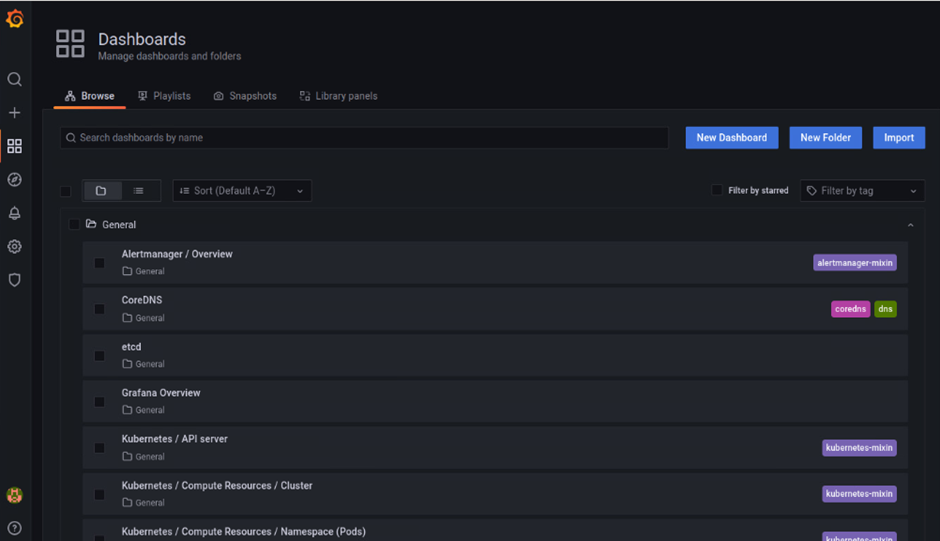 Fig. 7: Grafana Dashboards page
For example, here’s the Kubernetes/Networking/Pod dashboard:
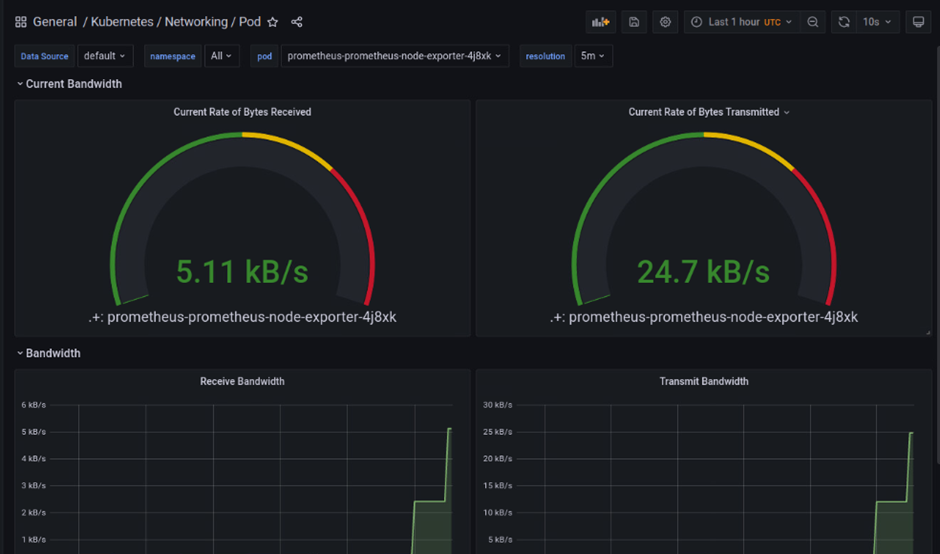 Fig. 8: Kubernetes/Networking/Pod monitoring page
Or another example, the overview dashboard:
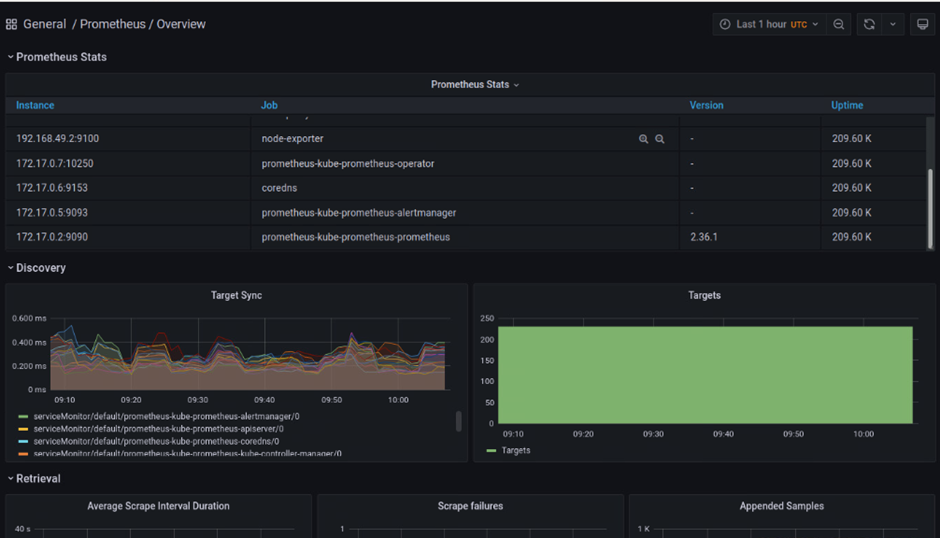 Fig. 9: Microservices overview page
These are all standard dashboards available in the deployed stack. We can also create custom dashboards based on the data available on Prometheus.
Here are a few benefits and drawbacks of Grafana:
Gone are the times when system administrators had to install tools in pieces and further integrate them to build a proactive monitoring system. This article has covered the quick installation steps for Prometheus and the Grafana monitoring stack using Prometheus Operator.
We have learned the basics of Prometheus, discussed the pros and cons of Grafana, and explored the built-in dashboards for monitoring microservices. Additionally, tools like Prometheus Monitoring provide better visibility and an integrated view of your applications and servers.
Yes, Site24x7 offers a Prometheus integration that allows you to send your Prometheus metrics to Site24x7 for long-term storage, advanced alerting, and correlation with other infrastructure data.
Site24x7 includes built-in customizable dashboards and reports that provide rich visualization of your monitoring data without requiring a separate tool like Grafana, simplifying your monitoring stack and reducing maintenance overhead.
Site24x7 provides a fully managed monitoring solution that eliminates the maintenance overhead of managing your own Prometheus and Grafana servers while offering similar metric collection and visualization capabilities.