Check the health and availability of your Linux servers for optimal performance with Site24x7's Linux monitoring tool.
Understanding CPU run queue length in Linux
Table of Contents
The Linux operating system uses processes to perform all system and user tasks. These processes may be blocked, killed, running, or waiting to be run. The number of processes in the latter two states determines the CPU run queue length.
There are several possible process states, such as:
- Runnable or running
- Interruptible sleep
- Uninterruptible sleep
- Stopped
- Zombie
Processes waiting for resources or signals from other functions will either be in the interruptible or uninterruptible sleep state: The process is put to sleep until the resources it needs become available. Then, depending on the type of sleep, the process can either transition into a runnable state or remain in sleep.
Even when a process has all the resources it needs, it doesn't immediately start running. It transitions to the runnable state where it is queued along with other processes in the same state. The CPU can execute these processes in the next few seconds or milliseconds. The scheduler lines up processes for the CPU and determines which process to execute next.
Depending on the system’s hardware configuration, the length of this runnable queue, called the CPU run queue, can either be short or long. A short run queue length signals that the CPU is underutilized. On the other hand, if the run queue is long, it means either that the CPU isn’t powerful enough to execute all the processes or that there aren't enough cores in the CPU. In an ideally utilized CPU, the run-queue length will equal the number of cores in a system.
There are a few commands in the Linux operating system that help determine the CPU run queue length, CPU utilization, and resource utilization to understand if system performance is being affected. In this article, we review some of these commands and how to use them.
Commands to monitor CPU run queue
Linux ships with a few commands to monitor the load on the CPU. While we proceed with these commands, bear in mind that if the information they provide is insufficient, third-party tools are also publicly available.
System activity report (sar)
The sar command is part of the sysstat package, which is not pre-installed in any Linux distribution. It can be installed using the below commands.
For Debian-based systems:
apt install sysstat
For RPM-based systems:
yum install sysstat
The sar command helps gather all necessary system activity and performance stats. This command accepts options to display metrics about resources such as CPU, memory, network, disks, queues, and more. The option q is used to access the run queue length and the average load on the CPU using the sar command. The output of the command provides the following information:
- runq-sz: Run queue length
- plist-sz: Number of tasks in the task list
- ldavg-1: System load average for the last minute
- ldavg-5: System load average for the last five minutes
- ldavg-15: System load average for the last 15 minutes
- blocked: Number of currently blocked tasks, waiting for I/O to complete
Along with the option, the command needs the refresh interval as well. The refresh interval, a number, represents how frequently the output has to be refreshed. For example, the following command will refresh the output every second, adding a new row to the table:
sar -q 1
Figure 1 below shows the output of the sar command refreshing every second.
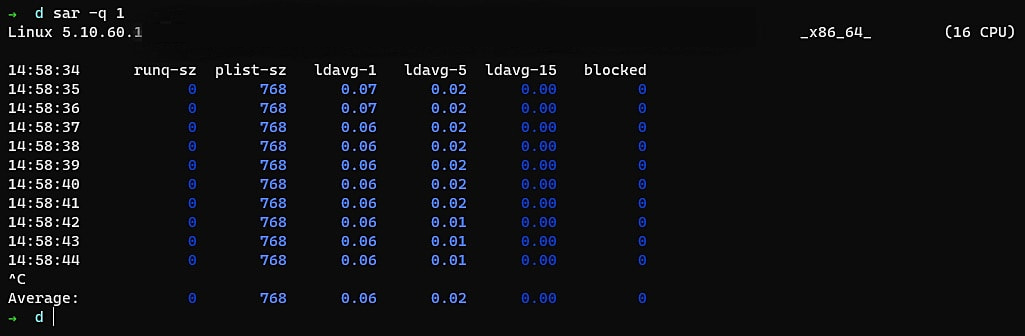 Fig 1:
 sar command output
The load on this particular system is extremely low—the run queue in the screenshot is zero. Meanwhile, there are over 768 tasks in the task list, but close observation reveals that the number of tasks is decreasing. This means the load on this system isn’t heavy—the system is over-configured for the tasks it performs. The average load over the last few minutes also tells us that there is virtually no load on the CPU, even though it is just a single-core unit. There are no blocked processes as well.
The ps command
The ps command is another handy tool for checking the state of processes. The process list can be filtered using the various options available for the command. The output of the ps command includes the STAT column, which displays the state of each running process. Figure 2 shows a sample output.
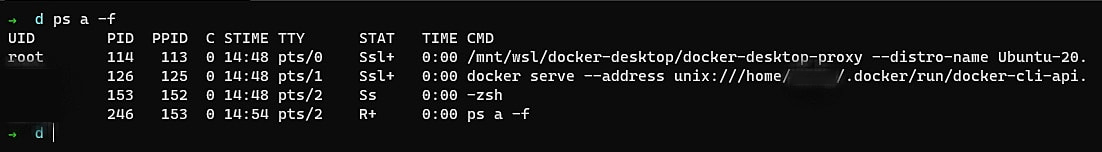 Fig 2:
 ps command output
The first letter of the STAT column value is the state of the process, where S stands for sleep and R stands for runnable.
The top command
The top command can display the state of any process. These options can be used to filter results and get a list of relevant processes.
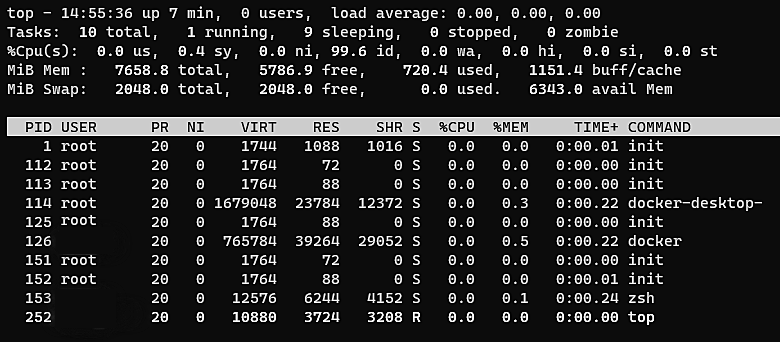 Fig 3:
 top command output
The column S in the output of the top command, as shown in figure 3, denotes the state of the process. The image also shows the top command as running (R) and a Docker process in the sleeping state.
The top command also provides the three CPU load average figures in the top right corner. These figures represent the average load on the CPU in the last 1, 5, and 15 minutes. Figure 3 shows that the average load hasn't risen past 0.0 in the last 15 minutes.
The /proc status file
Linux stores all process-related information as files in the /proc directory. Each process gets its own directory, with the process ID (PID) being the name of the directory. Each PID directory contains a file named status that holds all the information on the process, including its state. So a simple cat on the file and grep to filter the State will tell you the state of the process. The command below will indicate the state of the Docker process running on a Linux system. The PID of the Docker process is taken from figure 3 above.
cat /proc/126/status | grep State
Figure 4 below shows the output of this command.
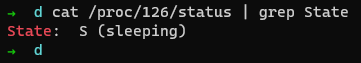 Fig. 4: State of a process using the
 /proc status file
CPU utilization vs. run queue length: Understanding the metrics
The three numbers of CPU utilization provided by commands such as top, sar, and uptime represent the load the CPU is taking and how much headroom is still available. This utilization number includes processes in running, runnable, and interrupted states. For example, a number lower than 1.0 on a single-core CPU means there is still some room left for new processes. A load of 1.0 on a single-core processor means that 100% of the CPU is utilized, while anything over 1.0 means that a single-core CPU is overloaded.
Similarly, on a dual-core process, an average load of 2.0 indicates 100% CPU utilization, 4.0 on a quad-core processor indicates 100% utilization, and so on. How is this utilization related to the CPU run queue length? Remember that the average load calculation includes processes in the running and runnable states, which are also the states that represent the run queue of a CPU. So even if the run queue is long, system performance will not be compromised as long as the average load is within the 1.0 per core measure.
This is because the CPU is able to efficiently execute all processes on time and keep the average load under control, even with a large number of processes waiting for CPU time.
You should also consider the average load from the last 5 and 15 minutes because these numbers indicate the sustained average load over a substantial amount of time. If the CPU is overloaded, this would result in a higher average load.
How to solve high load issues
There are two ways of solving high load issues: either add more hardware to the system or optimize the code to better use resources. For example, if a cluster of servers is regularly taking high loads, the cluster can be scaled out by adding more nodes to it or be scaled up by adding more memory and faster and bigger CPUs to each node.
But this approach might not be sustainable if the code being executed on these nodes isn’t optimized. For example, if the code isn’t releasing the memory back to the pool or if the code is blocking other programs by holding on to resources for longer than needed, adding more hardware will not improve the average load.
Using the iotop command will reveal the list of all processes using the I/O resources, making it easier to understand why a process might be blocked (or be blocking other processes) or using resources for a long time. Combining this information with the CPU load average numbers should provide a clearer picture of the CPU utilization.
High load issues usually arise when the code isn’t optimized, so this should be the primary focus. Hardware scaling is done only after code optimization is complete.
Summary
While the CPU run queue length indicates the number of processes ready to be scheduled for CPU time, it doesn’t always provide the complete picture. As demonstrated, a high number of tasks in the task list could still result in a low load on the CPU.
Alternatively, even a small number of processes in the run queue could lead to a high CPU load. In such cases, it is important to monitor the I/O operations to check for bottlenecks, which could be the underlying cause.
Using the commands listed in this article, you can easily monitor the queue length, task list, and average load on the CPU. In addition, measures like scaling up or scaling out the cluster and optimizing the code can help you avoid high load issues.
Was this article helpful?
Monitor your Linux environment
