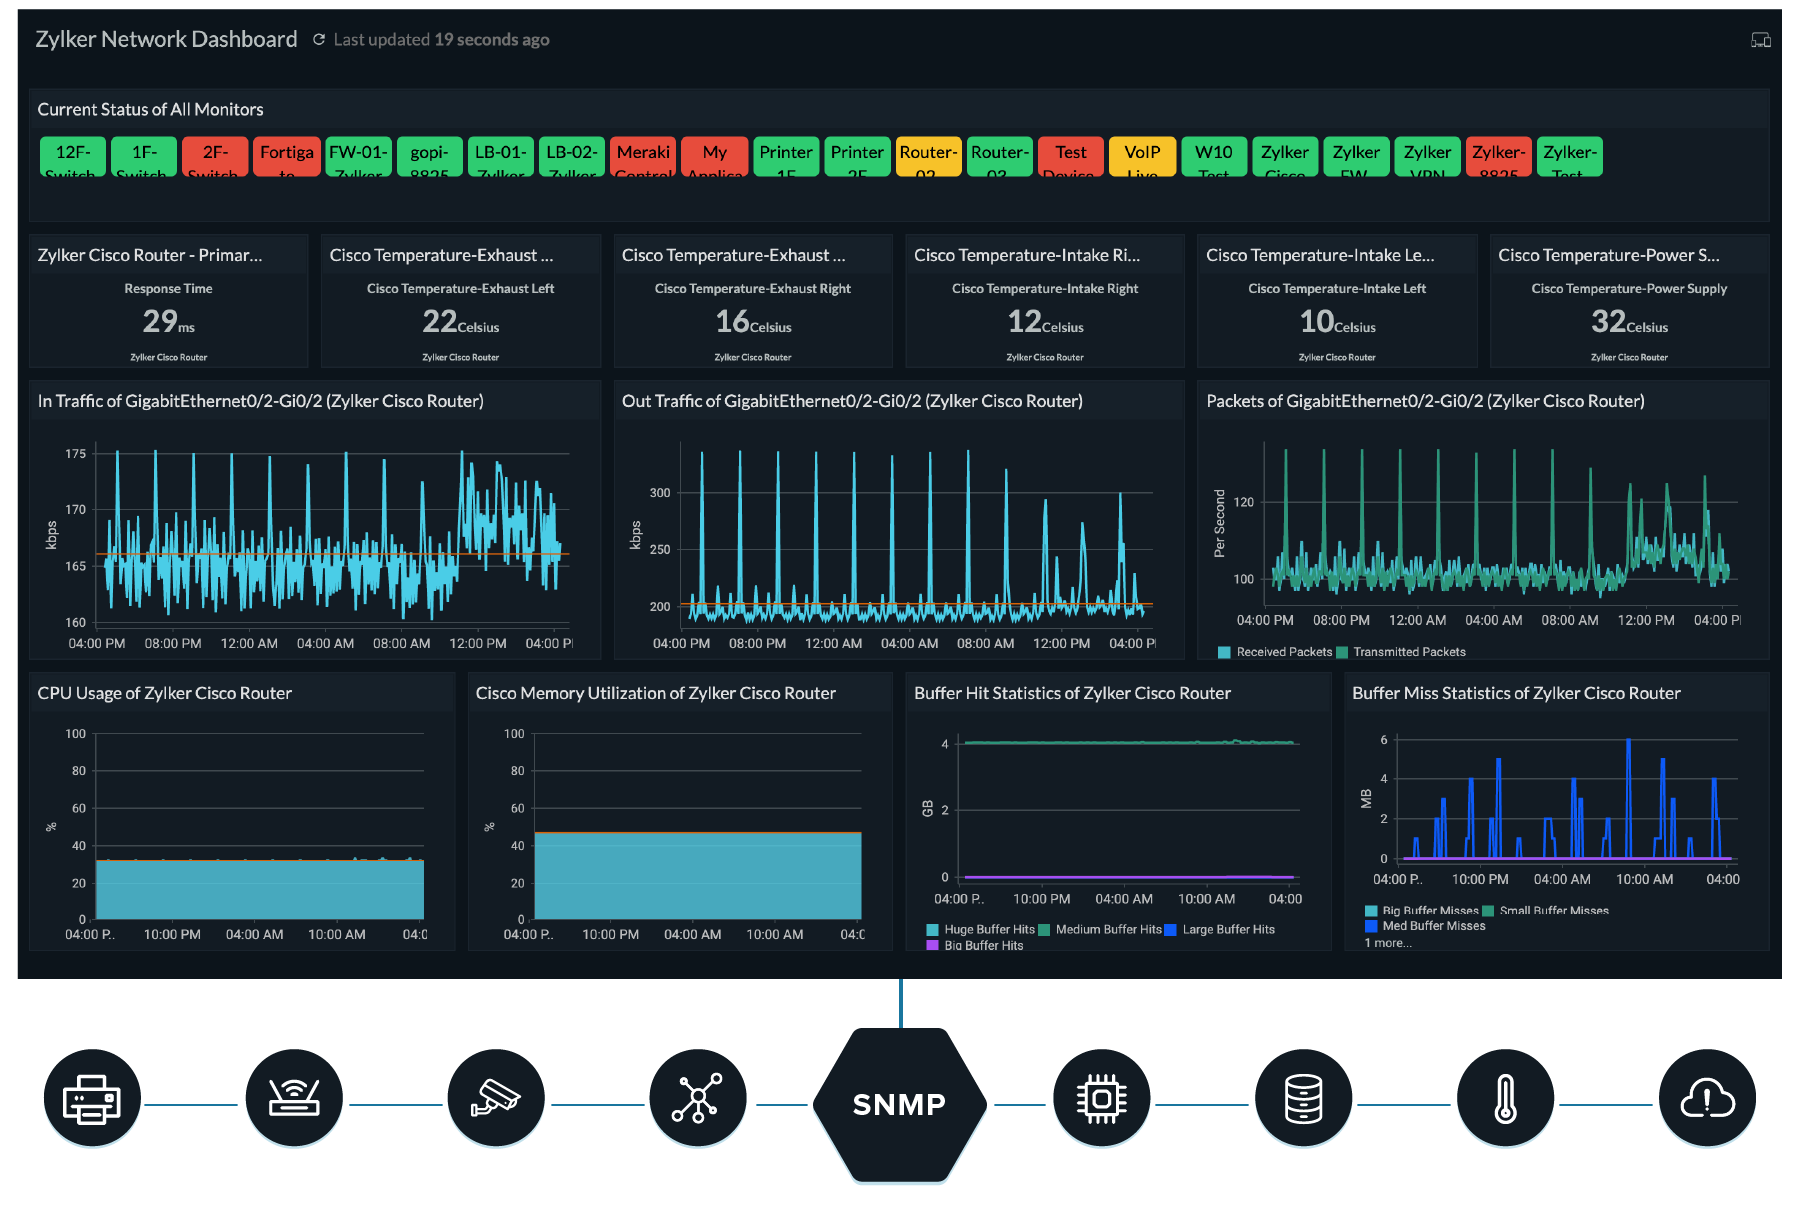
What is network monitoring?

Network monitoring is a vital IT process that tracks network components and endpoints and provides fault, performance, and traffic monitoring. It monitors critical network issues, provides fault detection, and monitors the health of various network elements from the device level to the protocol and interface levels.
Network monitoring systems help track network operations. They help monitor traffic, bandwidth utilization, and other metrics using performance counters. Further, examining the faults in the health and performance of network interfaces assists in managing various network resources, both on-site and remote. Network monitoring tools help IT admins reduce the mean time to repair (MTTR) to solve real-time network performance issues with instant alerting and data in the form of tables, charts, graphs, dashboards, and reports.
Why are network monitoring tools important?
Businesses rely on networks, whether they're on-premises or remote. Since managing organizational networks can become difficult, network monitoring tools are crucial to:
- Ensure continuous network uptime for uninterrupted business operations.
- Gain performance insights on every network device and interface, along with their hierarchy.
- Analyze the device and interface level performance using metrics.
- Identify threats proactively.
- Generate alerts and avert downtime.
Site24x7 is a cloud-based network monitoring tool that supports multiple vendors and provides real-time monitoring of your network. It helps reduce network outages and ensures high availability through uninterrupted monitoring. These are the reasons why many of our customers consider Site24x7 the best network monitoring tool.
Site24x7 - The complete network monitoring tool
With our comprehensive cloud network monitoring tool, a brainchild of ManageEngine OpManager, you can easily drill down to the root cause of network issues with our in-depth network analysis. This Simple Network Management Protocol (SNMP) based network monitoring system lets you detect anomalies instantly. Ensure the uptime and fault management of all your SNMP devices with a secure, firewall-friendly architecture.
Monitor network traffic: Monitor the in-and-out traffic, packets, errors, and discards, and analyze the network performance based on actionable insights.
Router monitoring
Identify network activities and optimize bandwidth allocation.
Firewall monitoring
Ensure optimal firewall performance to secure your network gateways.
Wireless monitoring
Check the signal strength, data transfer rates, and usage metrics.
UPS monitoring
Gain insights into metrics like input voltage, remaining battery stats, etc.
Load balancer monitoring
Analyze traffic distribution and performance across data centers.
Switch monitoring
Obtain port-wise performance stats for your switches, switch stacks, and switch ports.
VPN monitoring
Track your VPN latency, connections, paths, and tunnels to protect your network from intruders.
Printer monitoring
Track the number of pages printed, marker life count, and more.
Storage monitoring
Analyze memory size, buffer size for proper capacity planning of RAIDs, and tape libraries.
WAN monitoring
Optimize WAN performance by monitoring WAN links.
Key features of our cloud-based network monitoring tool
Auto-discovery
Automatically discover all the devices present within a provided IP range, or an entire network (LAN or WAN) using SNMP.
Multi-vendor support
Over 450 vendors like Cisco, HP, Canon, Juniper, D-Link, and Dell, are supported and you can monitor any other product by just entering the sysOID.
Device templates
Out-of-the-box support for over 11,000 device types from 450+ vendors that makes device categorization and auto-association simple.
Network mapping
Obtain complete visibility using maps. Automate discovery and mapping with Layer 2 maps and create your network schema using topology maps.
Health dashboard
View top devices based on response time and packet loss, along with top interfaces based on traffic, bandwidth utilization, errors, and discards.
SNMP trap processing
Configure network devices to send SNMP traps to Site24x7, and receive processed alert messages for any trap defined in your SNMP MIB.
Sensor monitoring
Site24x7 also supports SNMP-based sensor monitoring, which you can use to monitor attributes that are tracked by sensors by simply creating custom device templates.
Support for custom MIBs
In addition to the default management information base (MIB) provided, you can upload custom MIBs from your system, and use them to add custom performance counters of your choice.
VoIP monitoring
Assess the quality of Voice over Internet Protocol (VoIP) services throughout the call path by tracking different metrics including jitter, latency, and packet loss.
Hear it from our customers
Key metrics monitored with our network monitoring tool
SNMP counters for network performance monitoring
Monitor the SNMP performance counters and tabular performance counters of all your devices. Simply specify the sysOID and monitor any custom performance metric of your choice using custom SNMP monitoring.
Track key metrics, including:
- Memory and CPU usage
- Undersize packets
- Oversize packets
- Interface in giants
- Drop event statistics
- Jabber packets
- Backplane utilization
- Active session count
- Buffer failures
- Interface collisions
- Disk utilization
- Input packet drops
- Output packet drops
- VPN latency

Monitor NetFlow for complete traffic and bandwidth monitoring

Optimize data usage and pinpoint peaks
Obtain a thorough understanding of your network traffic behavior by analyzing flows based on different technologies like NetFlow, J-Flow, sFlow, CFlow, IPFIX, NetStream, and AppFlow.
Easily identify bandwidth hogs, intrusions, slowness or unauthorized access with a flows, conversation, port, and protocol-wise categorized application. Leverage dashboards and generate reports on network security, so that you can compare and analyze traffic stats and usage trends over stipulated periods with bandwidth monitoring.
Automate network configuration and change management
Network Configuration Manager (NCM) for better accountability
Track your Cisco, Juniper, HP, and other network device changes, automate backups, restore configurations, receive alerts, and stay compliant using our network configuration management tool.
Prevent security misconfigurations by receiving instant alerts and obtaining detailed analysis from reports that analyze the NCM inventory, startup-running conflicts, and user activities.

How does the Site24x7 network monitoring tool work?
Site24x7 Network Monitoring is an agentless, SaaS network monitoring system that collects data from your network using an On-Premise Poller. This helps monitor your internal and external networks. The Site24x7 network monitoring tool is SNMP based. You can either specify an IP range or use classless inter-domain routing (CIDR) to discover the devices in your network. You can mention discovery rules and device and interface filters, which help to fine-tune the discovery. Once added, the On-Premise Poller starts to fetch data like traffic, bandwidth, packets, error, discards, and other performance data from your devices.
You can configure threshold limits for all the key performance metrics at the device and interface level so that you can take corrective measures on any breach and keep the network performance under control using our cloud network monitoring tool.


Benefits of using Site24x7 as your network monitoring tool
Single console monitoring
Monitor network performance, network traffic (NetFlow), and NCM from the same console.
Out-of-the-box reports
View top N, health trend, and inventory reports, and also create custom reports of your choice.
Third-party integrations
Integrate with software like Slack, Microsoft Teams, Jira, and more.
Full-stack monitoring
Full-fledged Server Monitoring with more than 60 performance metrics for your physical, virtual, and cloud servers.
Dashboards
Create a custom dashboard with key metrics, and also view an exclusive network health dashboard.
Versatile alerting
Get SMS messages, emails, voice calls, push notifications, and RSS feeds.
Freemium version
Monitor your devices and interfaces using our free network monitoring software.
MSP monitoring
Scale as needed, support diverse network monitoring requirements of your customers, and manage from one dashboard.


