Anticipate issues and optimize the performance of your Apache web server.
Complete guide to monitoring Apache performance
Table of Contents
Monitoring services for uptime and performance is a crucial part of any organization’s day-to-day operations. In this post, we will explain what Apache HTTPD Server is and how to ensure that it is being fully monitored.
What is Apache?
For more than 25 years, essentially since its inception, Apache HTTPD Server has been among the three most popular web servers on the internet. It has been providing critical hosting services to hundreds of millions of web sites for millions of organizations on all seven continents. It’s very likely that your organization is using it for some functionality unless your leadership has made a deliberate decision to avoid it.
Apache HTTPD Server is the seminal project of the Apache Foundation, which supports many of the most popular open source projects in use today. Although it is technically called “HTTPD Server,” it is commonly referred to as “Apache” in many technical circles.
Apache is a small core system that provides static web hosting and the flexibility, since OS level version 2, to adjust how it handles request processing. It employs Multi-Processing Modules (MPM), which are specific to one operating system (mpm_winnt or mpm_netware). These implement pre-forking or act as a highly-tuned, thread-based system for maximizing performance on Unix/Linux (worker or event).

In addition, Apache relies on a large and widely-supported series of modules to enhance its core functionality. These modules provide everything that a modern web server needs, from basic authentication to proxy services and the ability to encrypt data in transit. A large percentage of the most popular modules (https://httpd.apache.org/docs/2.4/mod/) are delivered by the Apache HTTPD Server Project and kept in sync with core server releases, but quite a few are also provided by members of the community as integration points for their own projects. One extremely popular example of a community-provided plugin is The PHP Group’s mod_php (https://www.php.net/manual/en/security.apache.php), which enables you to dynamically process PHP scripts as part of the Apache request processing stream.
What is a web server?
A web server is any server-side product that handles the processing of requests based on the HTTP protocol (which was first standardized in 1996 as HTTP/1.0 and most recently as HTTP/2.0 in 2015). Its core function is to deliver HTML pages to client-side web browsers, like Chrome and Firefox, and render them to end customers as usable content. The integration of hypertext links to allow for seamless navigation within and between different pages and sites has made this platform incredibly popular.
Alternative web servers - NGINX and IIS
Apache has been one of the top three most popular web servers since the introduction of the World Wide Web in the mid-1990s. Its two main competitors are Internet Information Services (IIS) and NGINX, and according to Netcraft’s monthly web server survey (https://news.netcraft.com/archives/category/web-server-survey/), the latter surpassed Apache in popularity in 2015.
IIS ships as part of Microsoft Windows. As a native component of what is arguably the second most popular operating system used in data centers, it’s only logical that it has been a top contender for web server traffic. In the mid-2000s, it was used by some of the biggest e-commerce sites on the internet. While it’s every bit as extensive as its two big rivals, the use of IIS has dropped in recent years, and NGINX and Apache currently handle most of the 1.2 billion available sites on the internet.
NGINX, on the other hand, was born out of the need for a higher performing web server than Apache was capable of providing at the time. NGINX was built for performance, but it has since added functionality that allows it to go toe-to-toe with Apache on all levels (arguably, NGINX is still the top performer). In fact, Apache came out with their second version based on flexible processing modules to address the performance issues that drove the community, such as large-scale web companies like Facebook, to switch to NGINX.
Why is Apache monitoring important?
In the end, the customers are the ones who decide to use the services that a business provides, and regardless of whether those services are paid or free, they expect high performance and little to no downtime. Even if the services are offered only to internal business users, their personal experiences as consumers on the web give them heightened expectations for the smallest and most obscure services they use in their daily work activities.
Paying customers have service-level agreements (SLAs) which define the minimum performance standards they are willing to accept, and there are often penalties if your service does not meet those requirements. To ensure that they don’t risk violating their SLAs, organizations normally set much higher internal service-level objectives to judge themselves against.
Since Apache is a critical part of many infrastructures and can perform multiple roles depending on which modules are enabled, it is absolutely essential to enable extensive monitoring on Apache.
Apache is commonly used on the customer-facing side of a service as a reverse proxy, to host the static content of an application (like images), or to host a dynamic web content management system.
Using Apache to serve static content helps performance, but it often creates a bottleneck of its own. It’s extremely important to monitor memory usage, network throughput, and disk I/O when caching is involved to ensure everything is behaving as expected.
When Apache is used as a reverse proxy or a web content management system, it handles all incoming connections and manages outbound connections to backend servers that handle part or all of the request. Apache can even act as a cache for common requests so that the response is given back to the customer without any backend processing. These features demonstrate the importance of being able to support a large number of concurrent requests so that response time is not negatively impacted.
Over time, you will build a profile of your application and its components, including any regular usage patterns that are date-driven (like New Year's Day) or workload-driven (such as the fact that your credit department is at full capacity from 8am to Noon, Eastern Time, when your New York City office in the United States and your Paris office in France are both online).
Once you build a solid performance profile for your application, your application and Apache experts can start to work with the infrastructure and cloud engineering teams to scale services up and down as required. This will allow you to make better use of your resources while providing customers with the high-quality experience that they expect.
Featured
Start monitoring with Site24x7's Apache monitoring tool
Sign up for a free trial
Monitoring Apache with native tools
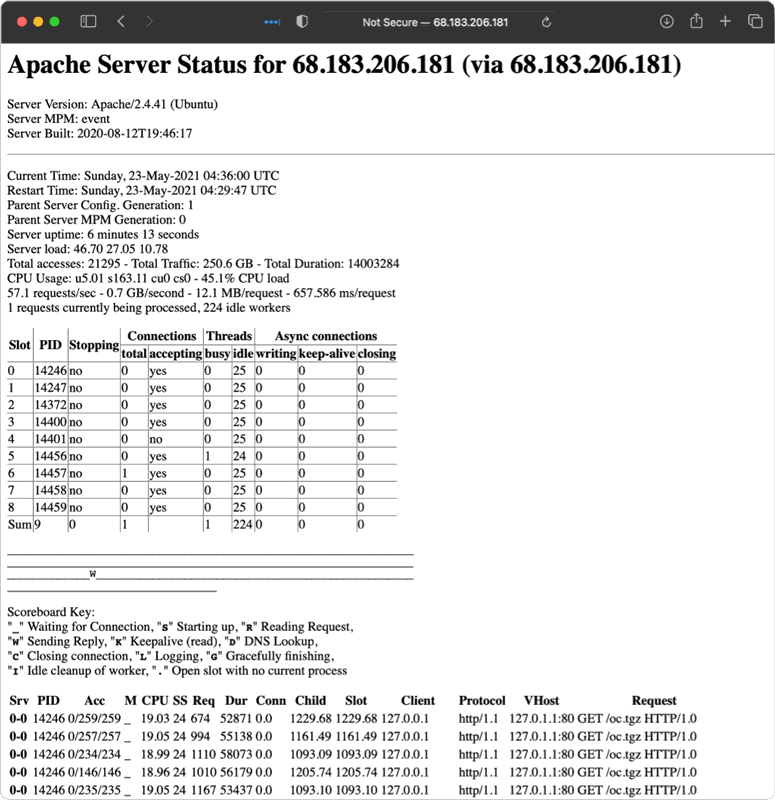
Apache has a module called mod_status that provides a
fairly
in-depth look at what Apache is
doing at any
given time, including a summary of performance data
like current CPU usage and the total number of
requests made since the Apache HTTPD Server was started. This is good information, but not nearly enough
to know that all aspects of the network is healthy. Just because a process is running and serving requests
doesn’t mean that the requests are timely or even returning the correct information.
Apache performance monitoring from additional angles
Holistic monitoring of Apache requires more insight than a single data source can provide. You need to be able to look at Apache from as many angles as possible to get the big picture and really know what is going on.
These additional angles include log files, operating system and server usage, network metrics and data flows, and both synthetic transactions and real user monitoring (RUM) (https://developer.mozilla.org/en-US/docs/Web/Performance/Rum-vs-Synthetic).
| Category | Type of Monitor | Metric to Watch | Description | Source |
|---|---|---|---|---|
| Throughput | Log monitor | Request processing time | Microseconds required to process a client request | Apache access log |
| Throughput | Server monitor | Average number of client requests per second | Average number of client requests per second | mod_status |
| Throughput | Server monitor | Total bytes served | This metric reflects the bytes that should have been served, which is not necessarily equal to the bytes that were actually served successfully. | mod_status |
| Resource utilization | Server monitor | Memory usage | ||
| Resource utilization | Server monitor | CPU utilization | ||
| Resource utilization | Server monitor | Open file descriptors | ||
| Resource utilization | Server monitor | Number of processes | ||
| Resource utilization | Server monitor | Disk I/O | The actual performance metrics of the disk subsystem | |
| Resource utilization | Server monitor | Disk usage | The amount of space available on the disk subsystem | |
| Resource utilization | Server monitor | Busy workers | Total number of busy worker threads/processes | mod_status |
| Resource utilization | Server monitor | Idle workers | Total number of idle worker threads/processes | mod_status |
| Resource utilization | Server monitor | Asynchronous connections: writing | Number of asynchronous connections in writing state (This is only applicable to event MPM.) | mod_status |
| Resource utilization | Server monitor | Asynchronous connections: keep-alive | Number of asynchronous connections in keep-alive state (This is only applicable to event MPM.) | mod_status |
| Resource utilization | Server monitor | Asynchronous connections: closing | Number of asynchronous connections in closing state (This is only applicable to event MPM.) | mod_status |
| Client-generated errors | Log monitor | Client-side errors | Rate of 4xx client errors (e.g. 403 Forbidden, 404 Not Found) per second, logon failures, forbidden errors | Apache access log |
| Server-generated errors | Log monitor | Server-side errors | Rate of 5xx server-side errors (e.g. 500 Internal Server Error, 502 Bad Gateway, 503 Service Unavailable) per second, internal server errors, web server busy errors, and service unavailable errors | Apache access log |
| End user experience (active) | Synthetic monitoring | Availability | Is the web site available from different locations? What is the response time for users in different geographic locations? | Synthetic monitoring solutions, which are included in a holistic observability suite |
| End user experience (passive) | Real User Monitoring | Network latency | Is a slowdown due to increased network latency or increased server-side processing? | RUM solutions, which are included in a holistic observability suite |
| Traffic patterns | Log monitor | Traffic patterns | Auto-baseline traffic (i.e. time-of-day and day-of-week behavior) | Combination of previous metrics |
| Capacity planning | Log monitor | Load balancing | Are the current servers being used effectively, or do you need to scale up/down? | Combination of previous metrics |
Request processing times
Apache HTTPD Server has the ability to log the exact amount of time that was spent processing a request. (This is in addition to the other metrics that are available in its custom log format, which are most often used for access logging.) To enable this, you need to update LogFormat to include %D, which is defined as the time (in microseconds) spent processing requests.
The default LogFormat line is "%h %l %u %t \"%r\" %>s %b," which is
the client, identd, http username,
request time, requested page, http status, and bytes returned. Identd is almost never used, so you can
simply replace %l with %D and ensure that the tool you use to monitor Apache knows that the change has
been made.
Average Client Requests per Second
While mod_status shows a metric for requests per second, it is not a relative number or even
a recent
number like the average requests per second within the last minute. The number is actually calculated from
the time that the HTTPD Server instance starts. So, if you start Apache on Sunday at midnight and it
doesn’t receive any requests by Monday morning at 4am, it will show 0 requests per second. If it then
receives 104,400 requests between 4am and 5am, it will read 1 request per second. This doesn’t really show
how busy the server was at any given moment, but it does provide a way to measure usage over time and
compare usage between servers in a cluster to ensure that the traffic is balanced.
You can gain more valuable insight by using monitoring tools that can use the raw data to perform calculations based on the relative time to determine how many client requests were in play within specific time frames. Knowing that you usually received zero requests over the weekend and then over 100,000 every Monday morning will enable better capacity planning so that you can provide the best possible user experience.
Total Bytes Served
Although the number of bytes that the server thinks it’s sending isn’t always the most accurate, it gives a baseline for estimating the size of the average transaction. This can be used to fine-tune memory set aside for caching as well as buffer sizes on inline applications and network devices. For example, if 95% of requests are 50KB, then having your default buffer size for compression set to 32KB is not a very efficient use of resources, since this will require the system to allocate additional buffer space almost every time.
Memory Utilization
Systems do not like it when all of their memory is in use. A lack of memory will result in one of two scenarios, neither of which is good for the client experience. If virtual memory has been allocated, then the kernel will start trying to move data from your physical memory to allocate space on the disk subsystem. Since disks are much slower than memory (SSDs are an improvement, but they’re still not as fast), this will slow overall performance. On the other hand, if virtual memory hasn’t been allocated, or if it’s full, the kernel can start randomly killing workers and other processes that ask for more memory than is available. This will result in lost requests, and clients will have to retry connections, which will in turn require more capacity. This can cause a sort of avalanche in which failed requests start to outnumber successful requests.
CPU Utilization
There are a few metrics that can help track CPU usage, which is normally displayed as a raw percentage. Apache is multithreaded, so it will use as many CPU cores as you give to the server that it’s running on. As in the case of memory utilization, a backlog will be created if CPU time is not available when requested, and performance will suffer. In the case of CPU utilization, however, requests won’t get killed–they’ll just wait. In addition, OS background tasks will start getting backed up, too, and the system can crash if they can’t recover.
Open File Descriptors
Everything is a file in Unix and Linux systems, so open network connections to config files, log files, and even HTML files being served by Apache are all treated as files. Therefore, it’s a good idea to keep an eye on the number of files that are open at any given time to ensure that you have enough available. For example, if a system runs out of file descriptions, the automated scripts that adjust files won’t be able to get a file description to even launch. Similarly, when you try to connect to the server via SSH, the connection has to have a file descriptor to finish connecting.
Process Limits
Anything that runs in Unix or Linux needs at least one process. While it’s far more likely that you’ll run into limitations with file descriptors rather than processes, it’s still a good idea to keep an eye on your number of processes, since some Apache MPMs, specifically pre-fork, use a lot more of them than other MPMs (like worker and event).
Disk I/O
Disk I/O tracks how much reading and writing is happening at the disk level while the system is operating. Depending on how these metrics look and how the system is tuned, it isn’t uncommon to use a read-optimized system like NFS to serve HTML and other content files while using an SSD for the operating system and logging disks.
Disk Usage
Disk usage is probably the least important metric to watch because almost all servers have more than enough space available. Since there is no reason to retain log files on individual servers, they can be connected to a larger centralized logging solution and configured to rotate on a set schedule. Still, it’s a good idea to keep an eye on disk usage just in case there is an unexpected spike caused by a core dump or a security breach that’s attempting to offload data.
Busy Workers
In Apache, different MPM modules have metrics that track how many of the existing instances (processes and/or threads) are in use at any given time. This will help you ensure that Apache is configured to allow the creation of enough workers to support the actual load that the server is asked to handle.
Idle Workers
As with the number of busy workers, it is always good to have a number of idle workers that are alive and ready to accept incoming requests. Ideally, this number should be kept low, but it should never be zero. Apache checks to make sure that the number of idle workers is okay about once per second. So, if the server is set to have two idle workers and it’s receiving 10 requests per second, then eight of those requests are delayed while their worker is starting, which wastes time. When milliseconds count, increasing your number of idle workers is an easy way to speed things up.
Asynchronous Connections – Writing, Keep-Alive, and Closing
When you use the event MPM worker module, you will have access to additional metrics that track the status of your active workers beyond just busy or idle. With these metrics, you can fine-tune your server to a much higher degree. If most of the workers are writing, then additional raw network performance capacity should also be evaluated (in packets per second, for example). If they are sitting on keep-alive or closing, there are Transmission Control Protocol (TCP) parameters that can reduce the length of time that the kernel keeps connections in those states. They might be waiting to receive a close message that didn’t get passed along, for example, which is not uncommon when there are multiple load balancers and firewalls in the mix.
Client-Generated Errors
While these aren’t technically errors, it’s a good idea to watch the number of HTTP status codes being returned in the 400 range. If you see an excessive number of 401 and 403 codes, this could indicate that you are under attack or there is a problem in the authentication system. If there is a massive increase in 404 errors, this could be a sign that a recent application update was unsuccessful.
Server-Generated Errors
HTTP status codes in the 500 range are server errors. These shouldn’t happen when all is well, unlike client-generated errors (which can happen anytime a client makes a bad request).

Synthetic User Monitoring
Synthetic user monitoring is also referred to as active monitoring. This is when a scripted and proven request (or series of requests) is made to a running application. An example of this would be when a user logs into the application, searches for a specific product, then adds or removes it from the shopping cart. Since these tasks are the same every time and occur on a set schedule, it’s easy to generate a proven baseline. Then, if an error is generated or there is a deviation from the baseline, monitoring can quickly escalate it to the correct team to check it out. This will often uncover errors before real clients find them.
Real User Monitoring
Passive user monitoring, more commonly known as real user monitoring (RUM), involves instrumenting an application on the client side by either adding a library to a mobile app or enabling an additional JavaScript package on a web app. These packages either include extra information about standard requests that clients make or they initiate additional requests to specific URLs that track all kinds of things, including network latency, client details (such as browser and OS version), and even application-specific data to see what the client is working on.
Traffic Patterns
Over time, patterns accumulate based on all of the metrics discussed above. This allows you to plan more effectively for many tasks, including when to schedule downtime and application upgrades.
Capacity Management
In addition to being helpful for overall application management, determining traffic patterns enables effective capacity management. Based on this information, you can plan for instances when more capacity is needed, and if you’re running on a cloud environment, you can also plan for times when capacity can be taken away.
Author Bio
Vince Power is an Enterprise Architect with a focus on digital transformation built with cloud enabled technologies. He has extensive experience working with agile development organizations delivering their applications and services using DevOps principles including security controls, identity management, and test automation. You can find @vincepower on Twitter.
Was this article helpful?
Sorry to hear that. Let us know how we can improve the article.
Monitor your Apache web servers

