Okta is an identity management service compatible with many on-premises and cloud applications. Configure the Site24x7 Okta plugin to effectively monitor and manage Okta logs. View an Okta management dashboard with metrics like top events, application severity, failed log ins, successful log ins, logged in users, and more.
This document details the following:
- How it works
- How to install the plugin
- How Site24x7 manages Okta logs
Prerequisites
How it works
- Download and place the script in the server agent's folder. This script will collect the events (logs) from Okta, write them to a local file, and also rotate and clean up the log files.
- The AppLogs agent will read this local file, parse it, and send the parsed data to Site24x7.
Plugin installation
- Create a directory named okta under the Site24x7 server agent's plugin directory.
For Linux: /opt/site24x7/monagent/plugins/
For Windows: C:\Program Files (x86)\Site24x7\WinAgent\monitoring\plugins\ - Download the script from here and place it in the okta directory.
- In the script, replace the value of the variable OKTA_DOMAIN and OKTA_API_TOKEN with your Okta domain and API token, respective
- Once the plugin file is downloaded, the agent will note the change during the next data collection and you can view the logs in the Site24x7 client.
What's next
- Create a log profile for Okta logs.
- Associate the log profile with the log type "Okta logs," and map a server that has the following file path:
For Linux: /opt/site24x7/monagent/temp/scriptout/events-*.log
For Windows: C:\Program Files (x86)\Site24x7\WinAgent\monitoring\temp\scriptout\events-*.log
Note: Once the plugin file is downloaded, the agent will note the change during the next data collection and you can view the logs in the Site24x7 client.
Perform a query language search with "Okta logs" as the log type, and start viewing your log data in an exclusive dashboard. Save your searches and configure alerts based on them.
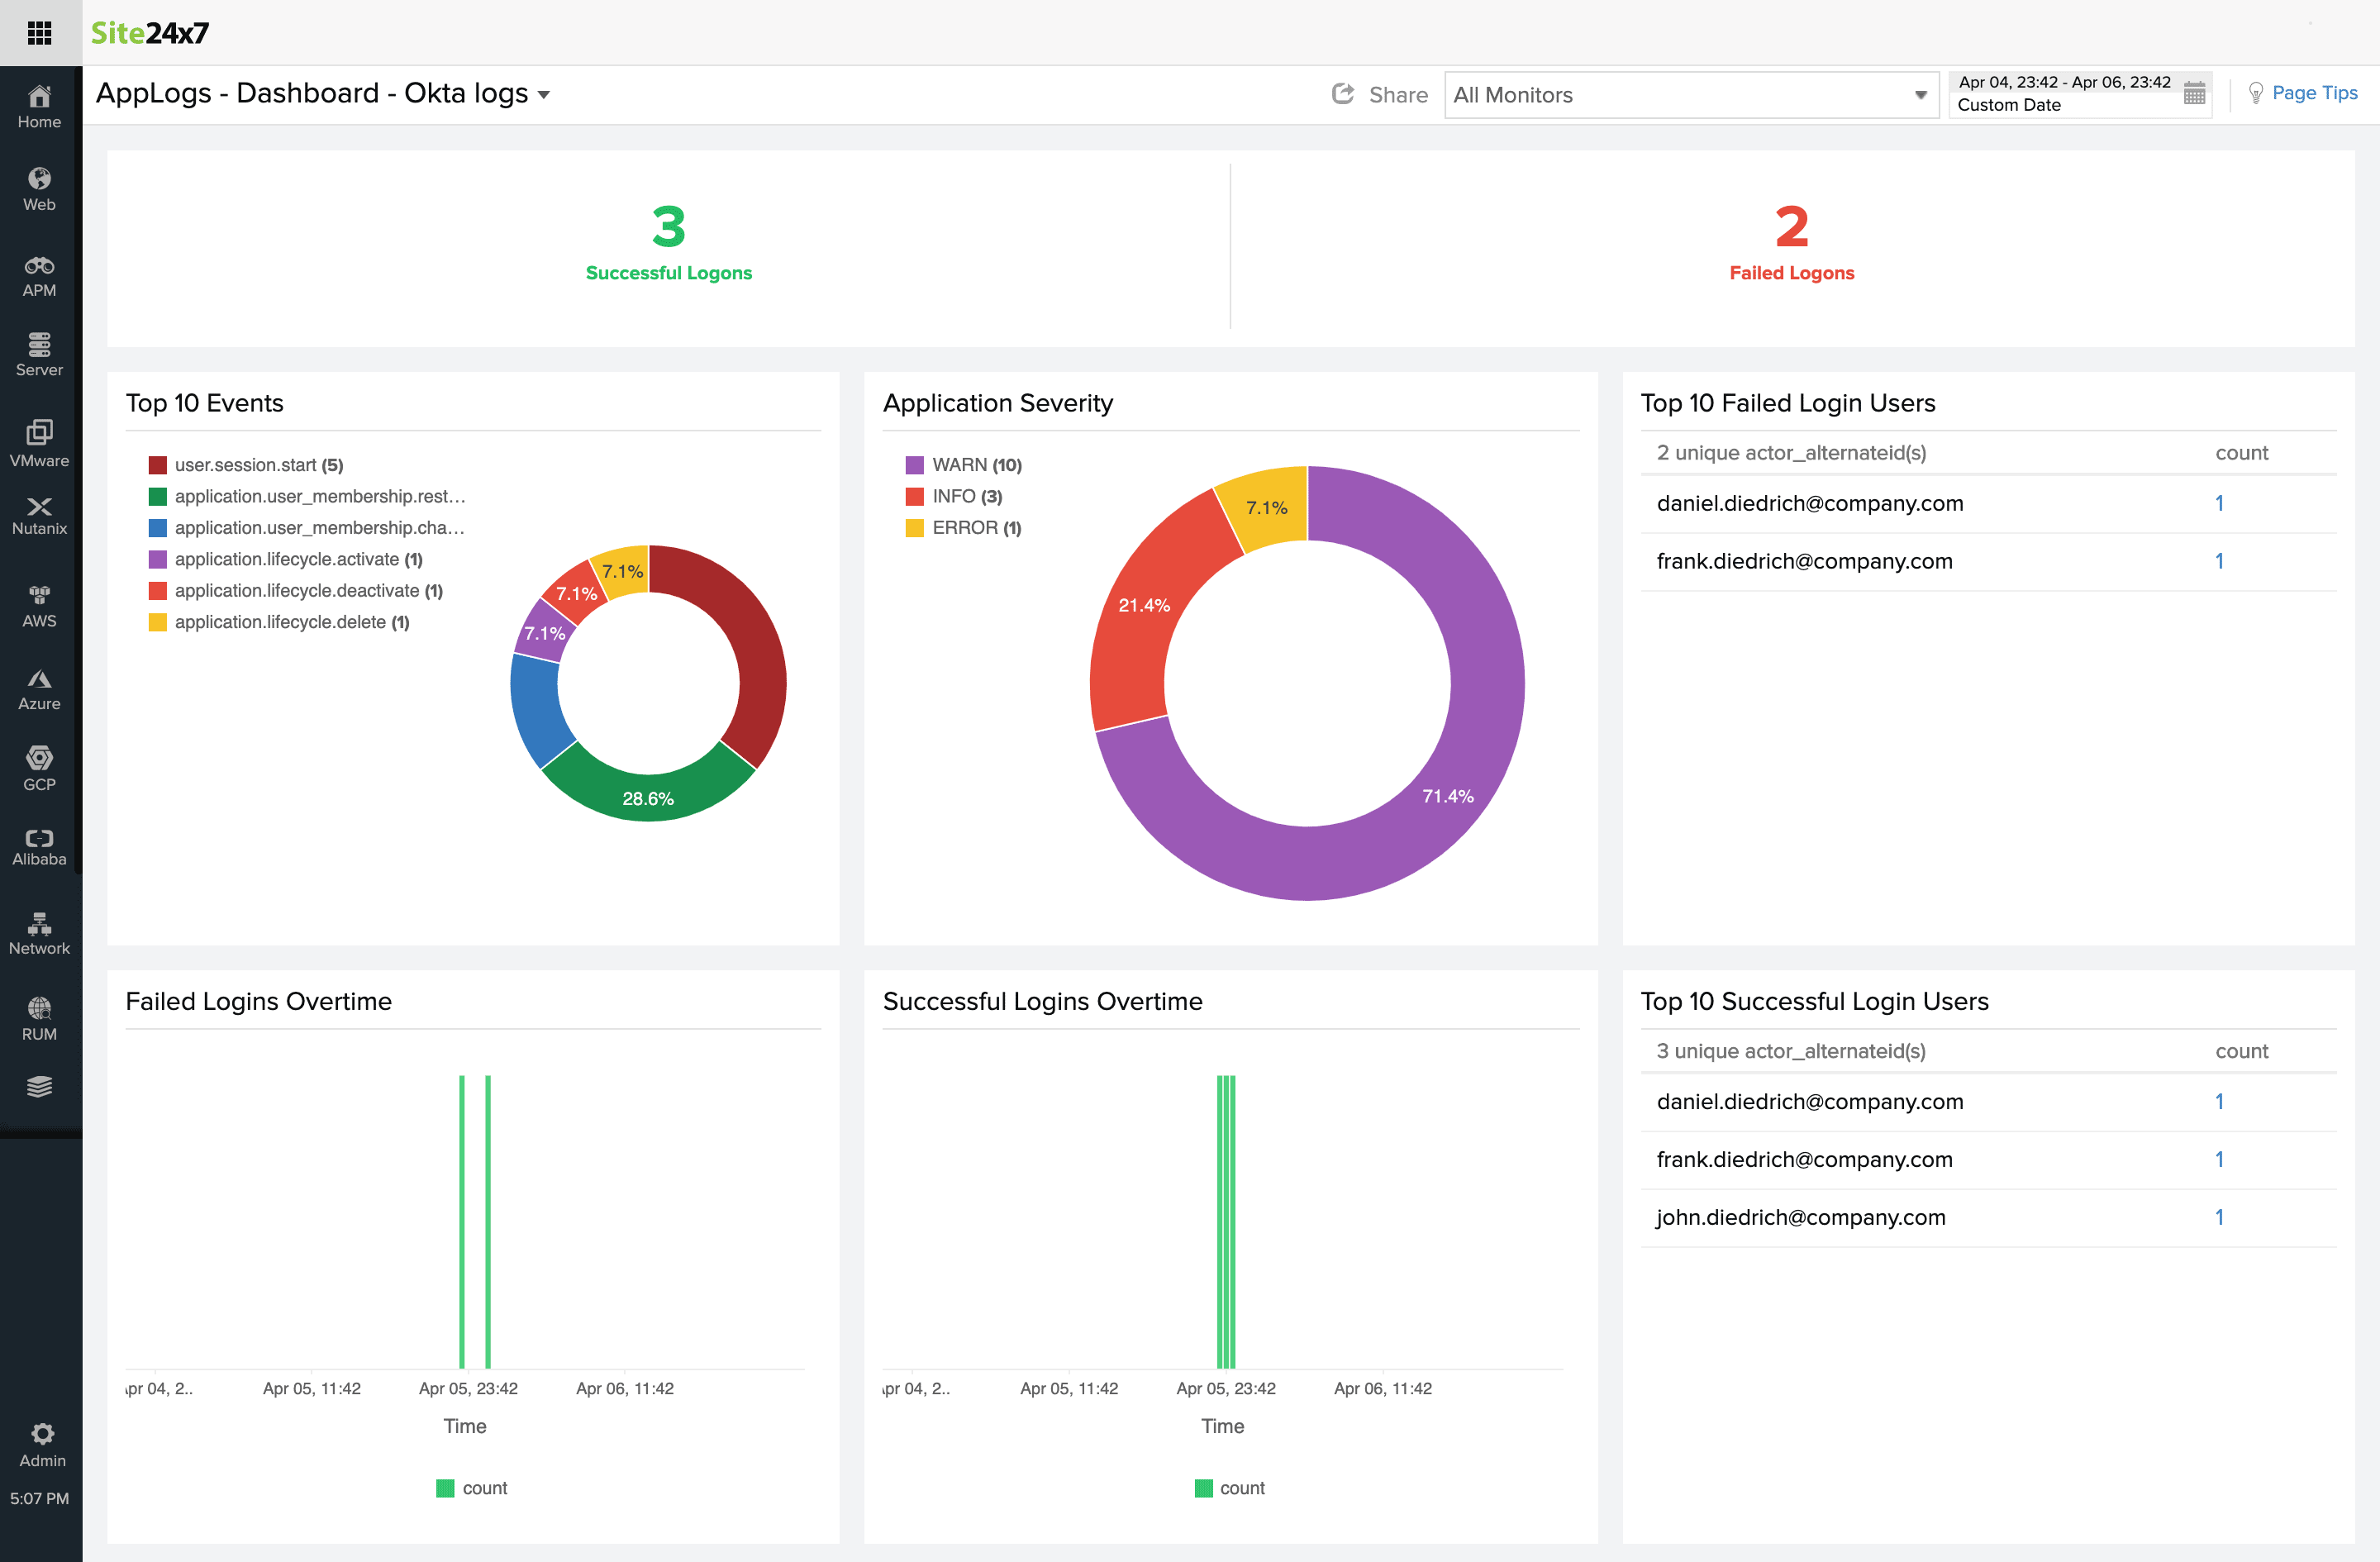
Okta log monitoring dashboard
Here's a list of the widgets that are available by default in the Okta event logs dashboard:
- Successful Logons
- Failed Logons
- Top 10 Events
- Application Severity
- Top 10 Failed Login Users
- Failed Logins Overtime
- Successful Logins Overtime
- Top 10 Successful Login Users
Plugin Contribution
Feel free to contribute to our existing plugin and come up with suggestions or feedback on our Community.