AppLogs Alerts
Site24x7's AppLogs Alerts allow you to set thresholds and send notifications to your predefined user alert groups so you can thwart critical operational issues right when they start.
In this doc, we'll cover:
- Use cases for AppLogs Alerts
- Monitor-level support for AppLogs Log Types
- Configuring alerts
- Alerts based on relative time
- Managing alerts
Use cases for AppLogs Alerts
- You want to monitor the average response time of a particular URL in your IIS server, and receive alerts if the response time exceeds the configured threshold. In this case, you can use the following query to create an alert:
logtype="IIS Access Logs" and stemuri="/EmpApp/" AVG(timetaken)By configuring the attribute as AVG(timetaken) > 60000 and setting the check frequency to 30 minutes, you'll receive an alert when the average time taken for the particular request exceeds one minute (60000 milliseconds). This condition will be checked every 30 minutes. - You want to receive an alert when too many response 500 errors occur in your IIS server. In this case, use the following query:
logtype="IIS Access Logs" and statuscode=500By configuring the attribute as count > 10 and setting the check frequency to five minutes, you'll receive an alert when there are more than 10 500 status code requests within five minutes. This condition will be checked every five minutes. - You want to receive an alert when a distinct source IP has generated too many response 404 errors in your IIS server. Use the following query:
logtype="IIS Access Logs" and statuscode=404 groupby clientipBy configuring the attribute as count > 100 and setting the check frequency to 10 minutes, you'll receive an alert when there are more than 100 404 status code requests from any distinct source within 10 minutes. This condition will be checked every 10 minutes. - You want to receive an alert when too many response 500 errors are thrown from any particular monitor in your IIS server. Use the following query:
logtype="IIS Access Logs" and statuscode=500 and monitor_name = "TEST_SERVER"By configuring the attribute as count > 10 and setting the check frequency to five minutes, you'll receive an alert when there are more than 10 500 status code requests from the "TEST_SERVER" monitor within five minutes. This condition will be checked every five minutes.
If you want to receive alerts if the response 500 error from any of the agents installed in your IIS server exceeds the configured threshold, then use the following query:
logtype="IIS Access Logs" and statuscode=500 groupby monitor_name
Monitor-level support for AppLogs Log Types
Once you configure an alert for a Log Type in AppLogs, your Log Type will be treated as a monitor.
With your Log Type treated as a monitor, you can:
- View your AppLogs monitors along with other monitors from Home > Monitors page.
- Configure Notification Profiles.
- Receive notifications via third-party ITSM and collaboration tools of your choice.
- Mark your Log Type monitor as in Maintenance mode to stop receiving AppLogs alerts.
- Configure your monitor to change to the Trouble state when any of the AppLogs alerts are generated.
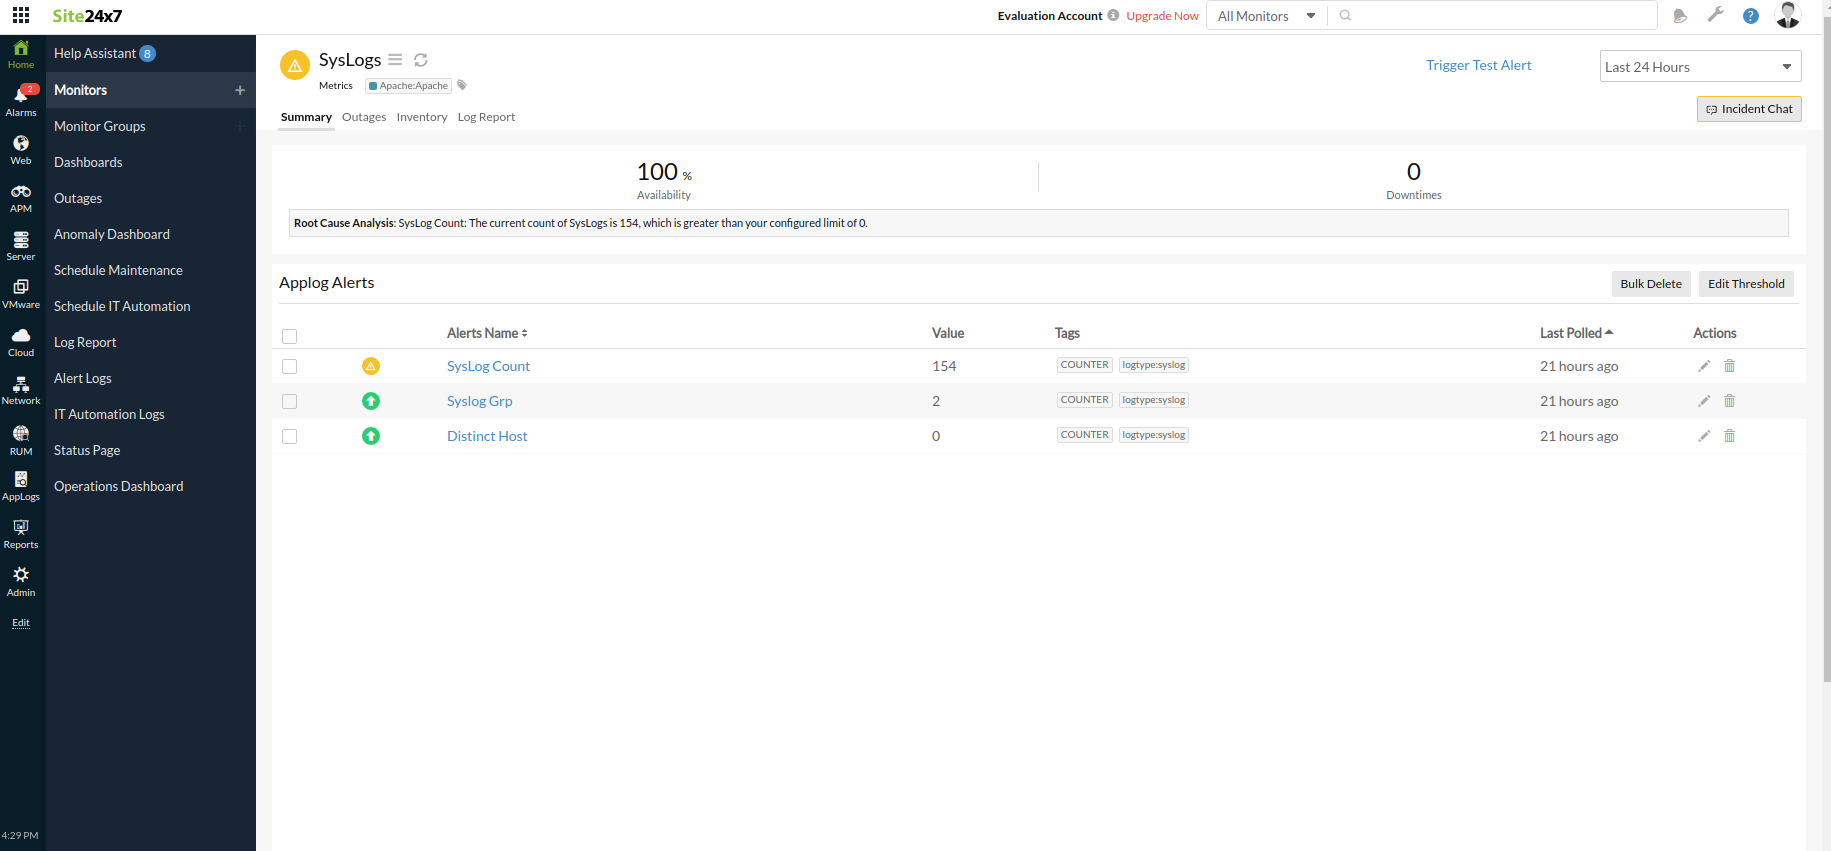
- Edit thresholds and delete all AppLogs alerts for a Log Type in bulk from the AppLogs Monitor Summary page.

Configuring alerts
To configure alerts from the AppLogs Search page:
- Log in to your Site24x7 account and navigate to the AppLogs tab.
- Enter a valid query.
- Click Alerts at the right-most corner of the query field.
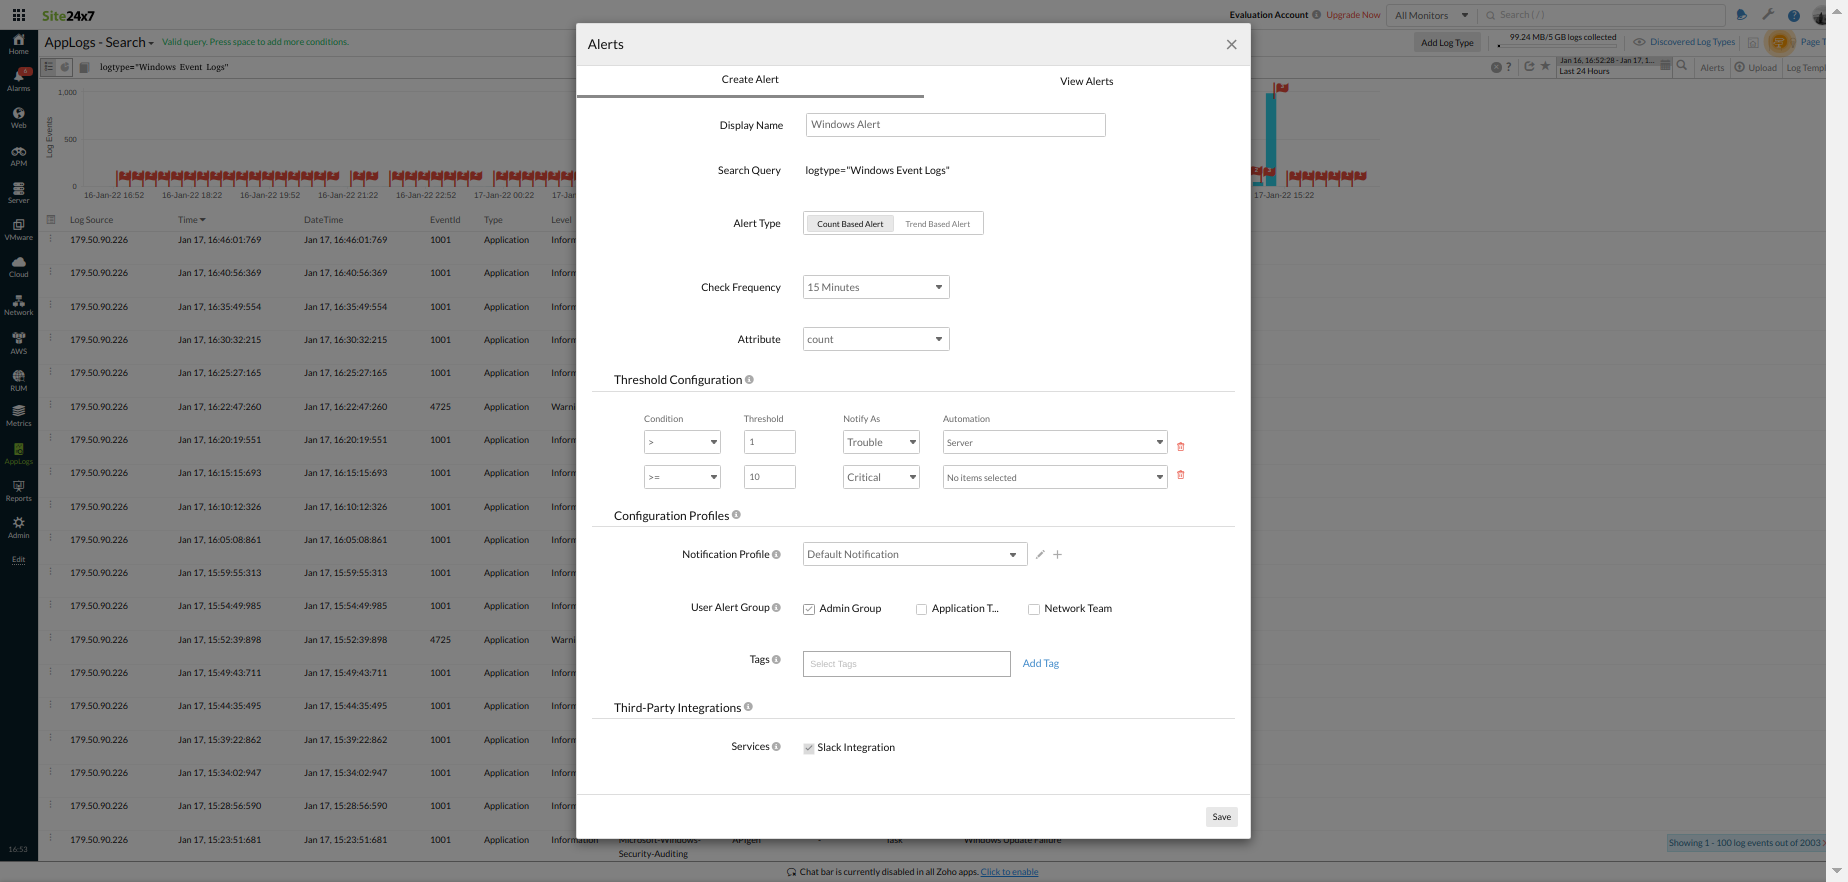
- Enter the following in the Configure Alert pop-up:
- Display Name: Enter a display name to identify the alert.
- Query: Your query will be displayed here (refer step 2).
- Alert type: Toggle between the following and set the conditions.
- Trend Based Alert: The alert will be based on the trend learned over a period of the configured days using the Exponentially Weighted Moving Average (EWMA) algorithm. For this your should also configure the Trend Observation in days. This is simply the period of observation to learn the trend of your log collection, after which you'll start to receive alerts.
- Count Based Alert: Count is simply your number of log lines, beyond which you'll receive alerts.
- Attribute: Choose an attribute from the drop-down list and set a condition (>, <, >=, <=, !=, or =). For trend based alerts, you can set the attribute as either 'increases by', 'decreases by', or 'increases or decreases by'. Next, you can set a value as the threshold for that attribute.
Configuring alerts based on relative time
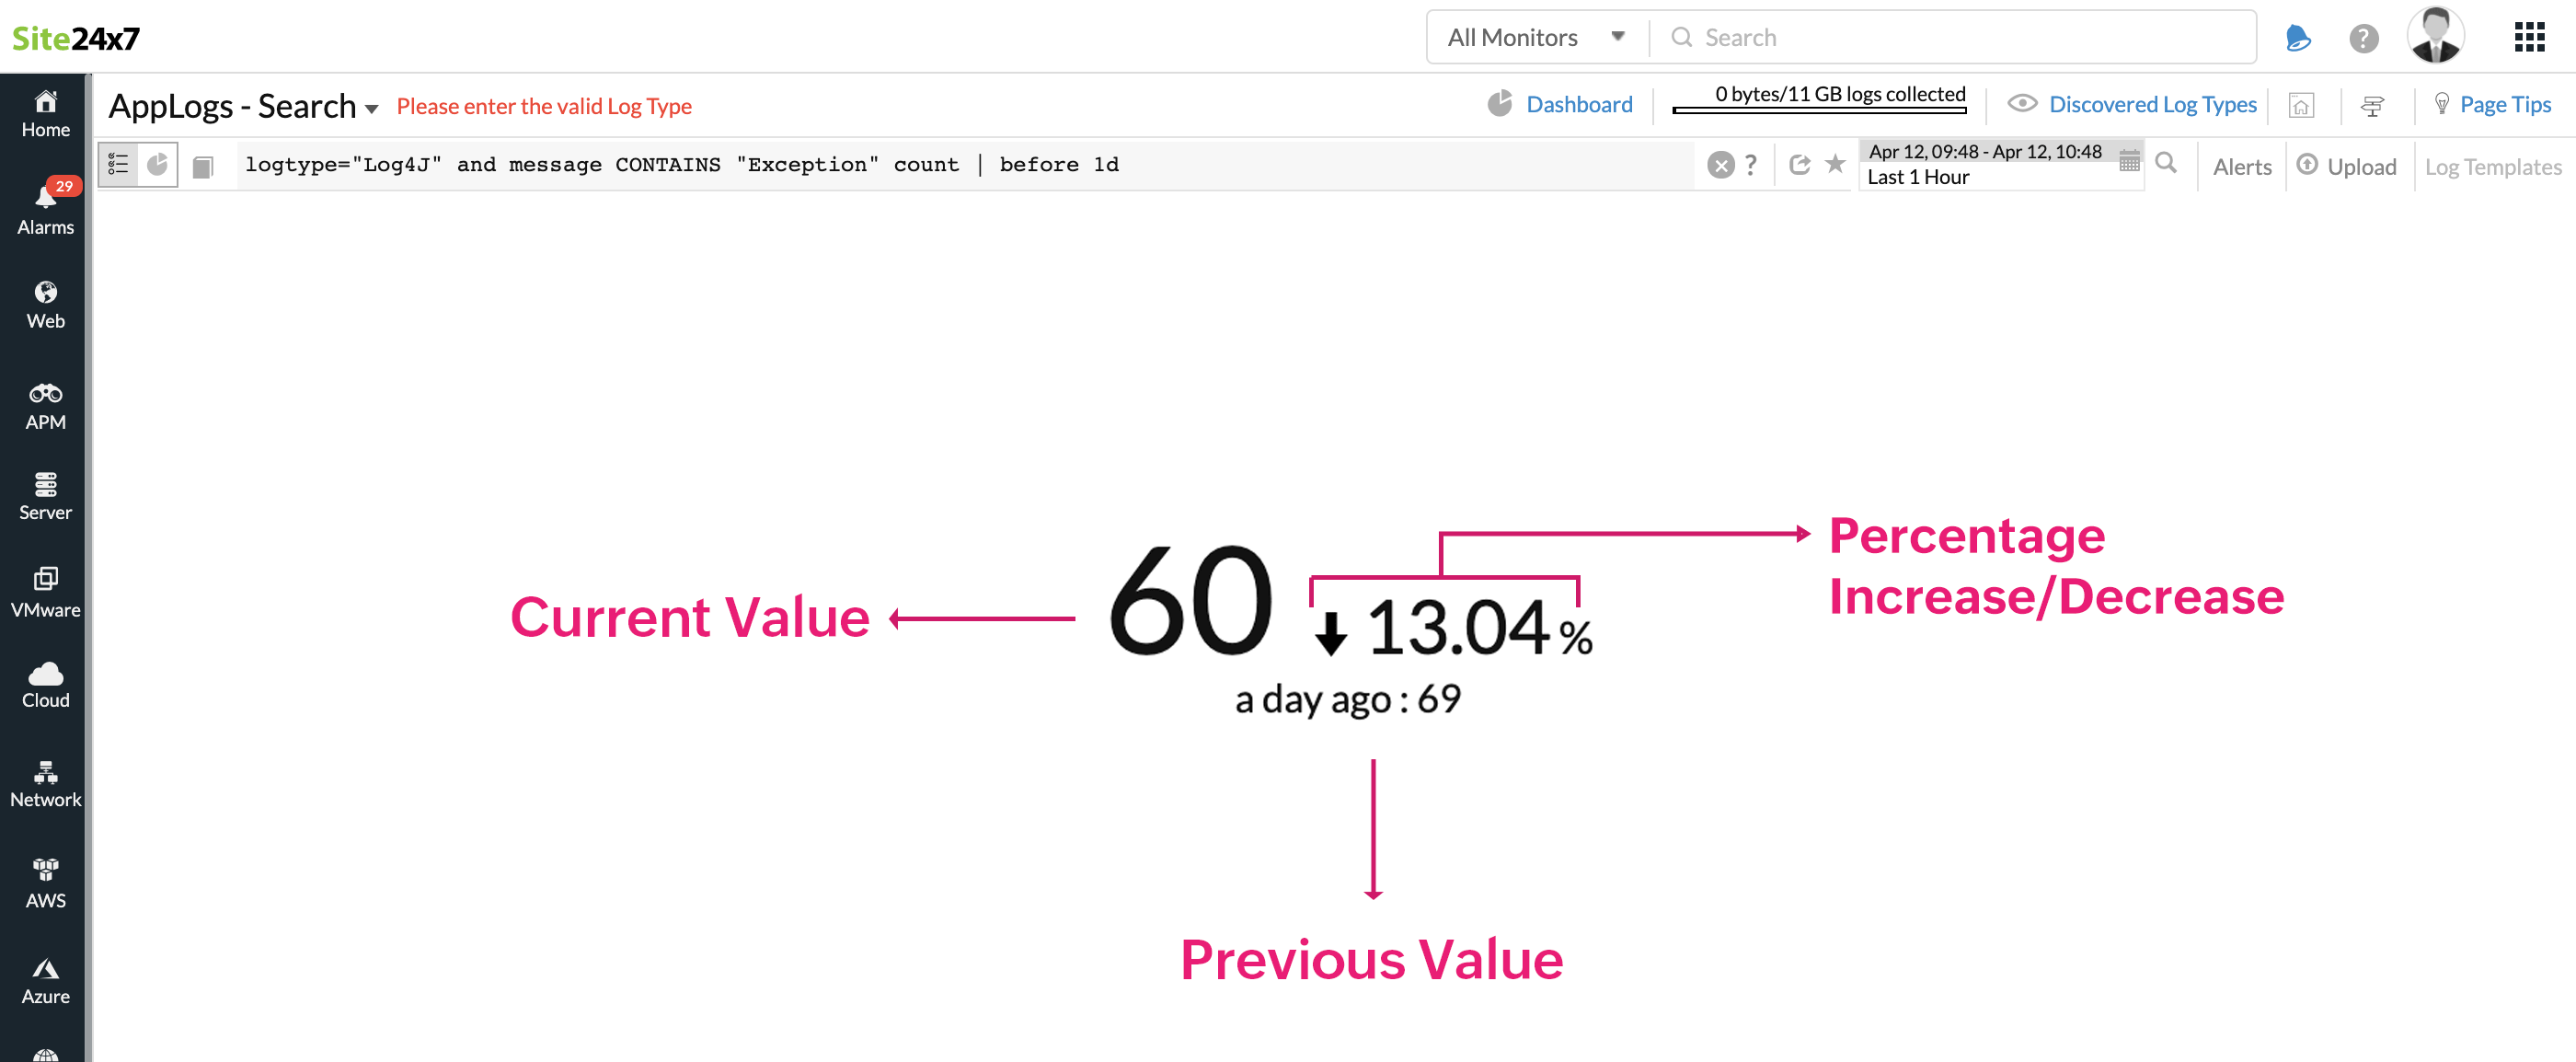
When your query contains "before", you'll be able to compare the results for the same time, before one day, seven days, or the period you provide. In that case, the Attribute will show fields like Difference Value and Difference Percentage in the drop-down menu. Here, you can choose based on which of the two you'd like to receive an alert. Your results will show the current value, previous value (before 'x' time), and the percentage increase or decrease. You can choose to receive alerts based on the difference value or the difference percentage for the threshold you configure. This kind of alert can be helpful to track your key performance indicators and receive alerts when there is a sudden increase or decrease compared to previous period.
For instance, in the below screenshot, we compare the current exception count of the Log4J logs with that of the exception count one day ago, at the particular period of 09:48 - 10:48. The query result displays the current value, previous value, and percentage decrease in the exception count. You can configure alerts based on the query entered and choose to receive alerts based on the difference between the two exception counts or the percentage difference.
By default, the "count" attribute will be selected, and you can only configure one attribute per alert. You can also configure alerts for the min, max, or avg of a number field in your logs. - Check Frequency: Select a check frequency between 15 minutes and 24 hours from the drop-down menu.
- Threshold Configuration: Threshold Configuration helps the alarms engine decide the state of a specific AppLogs Alert. Add the conditions and set the value on how you would like to receive an alert.
- Configuration Profiles
- Notification Profile: The Notification Profile helps with configuring who gets notified and when in case of downtime. Choose a Notification Profile from the drop-down list, use the default profile available, or create a custom Notification Profile.
- User Alert Group: Select which group should be alerted about an anomaly. You can also create new user alert groups and associate them with this query.
- Tags: Associate your monitor with a predefined Tag or multiple Tags to help organize and manage your monitors creatively.
- IT Automation Templates: Select an Automation Template to be executed when there is a change in the state of the AppLogs monitor. The defined action gets executed when there is a state change and selected user groups are alerted.
All the Configuration Profiles settings are applied at the monitor level for the Log Types. Changing any of these settings for one AppLogs Alert in the Log Type will affect all the alerts created under the Log Type. - Third-Party Integrations: Associate your monitor with a preconfigured third-party service. This lets you push your monitor alarms to selected services and facilitate improved incident management. If you haven't set up any integrations yet, navigate to Admin > Third-Party Integrations to create one.
- Click Save.

You can also set up e-mail, SMS, voice call, and instant messenger alerts for AppLogs Alerts. Learn about the licensing for AppLogs Alerts.
Managing alerts
To manage your configured alerts from the Admin tab:
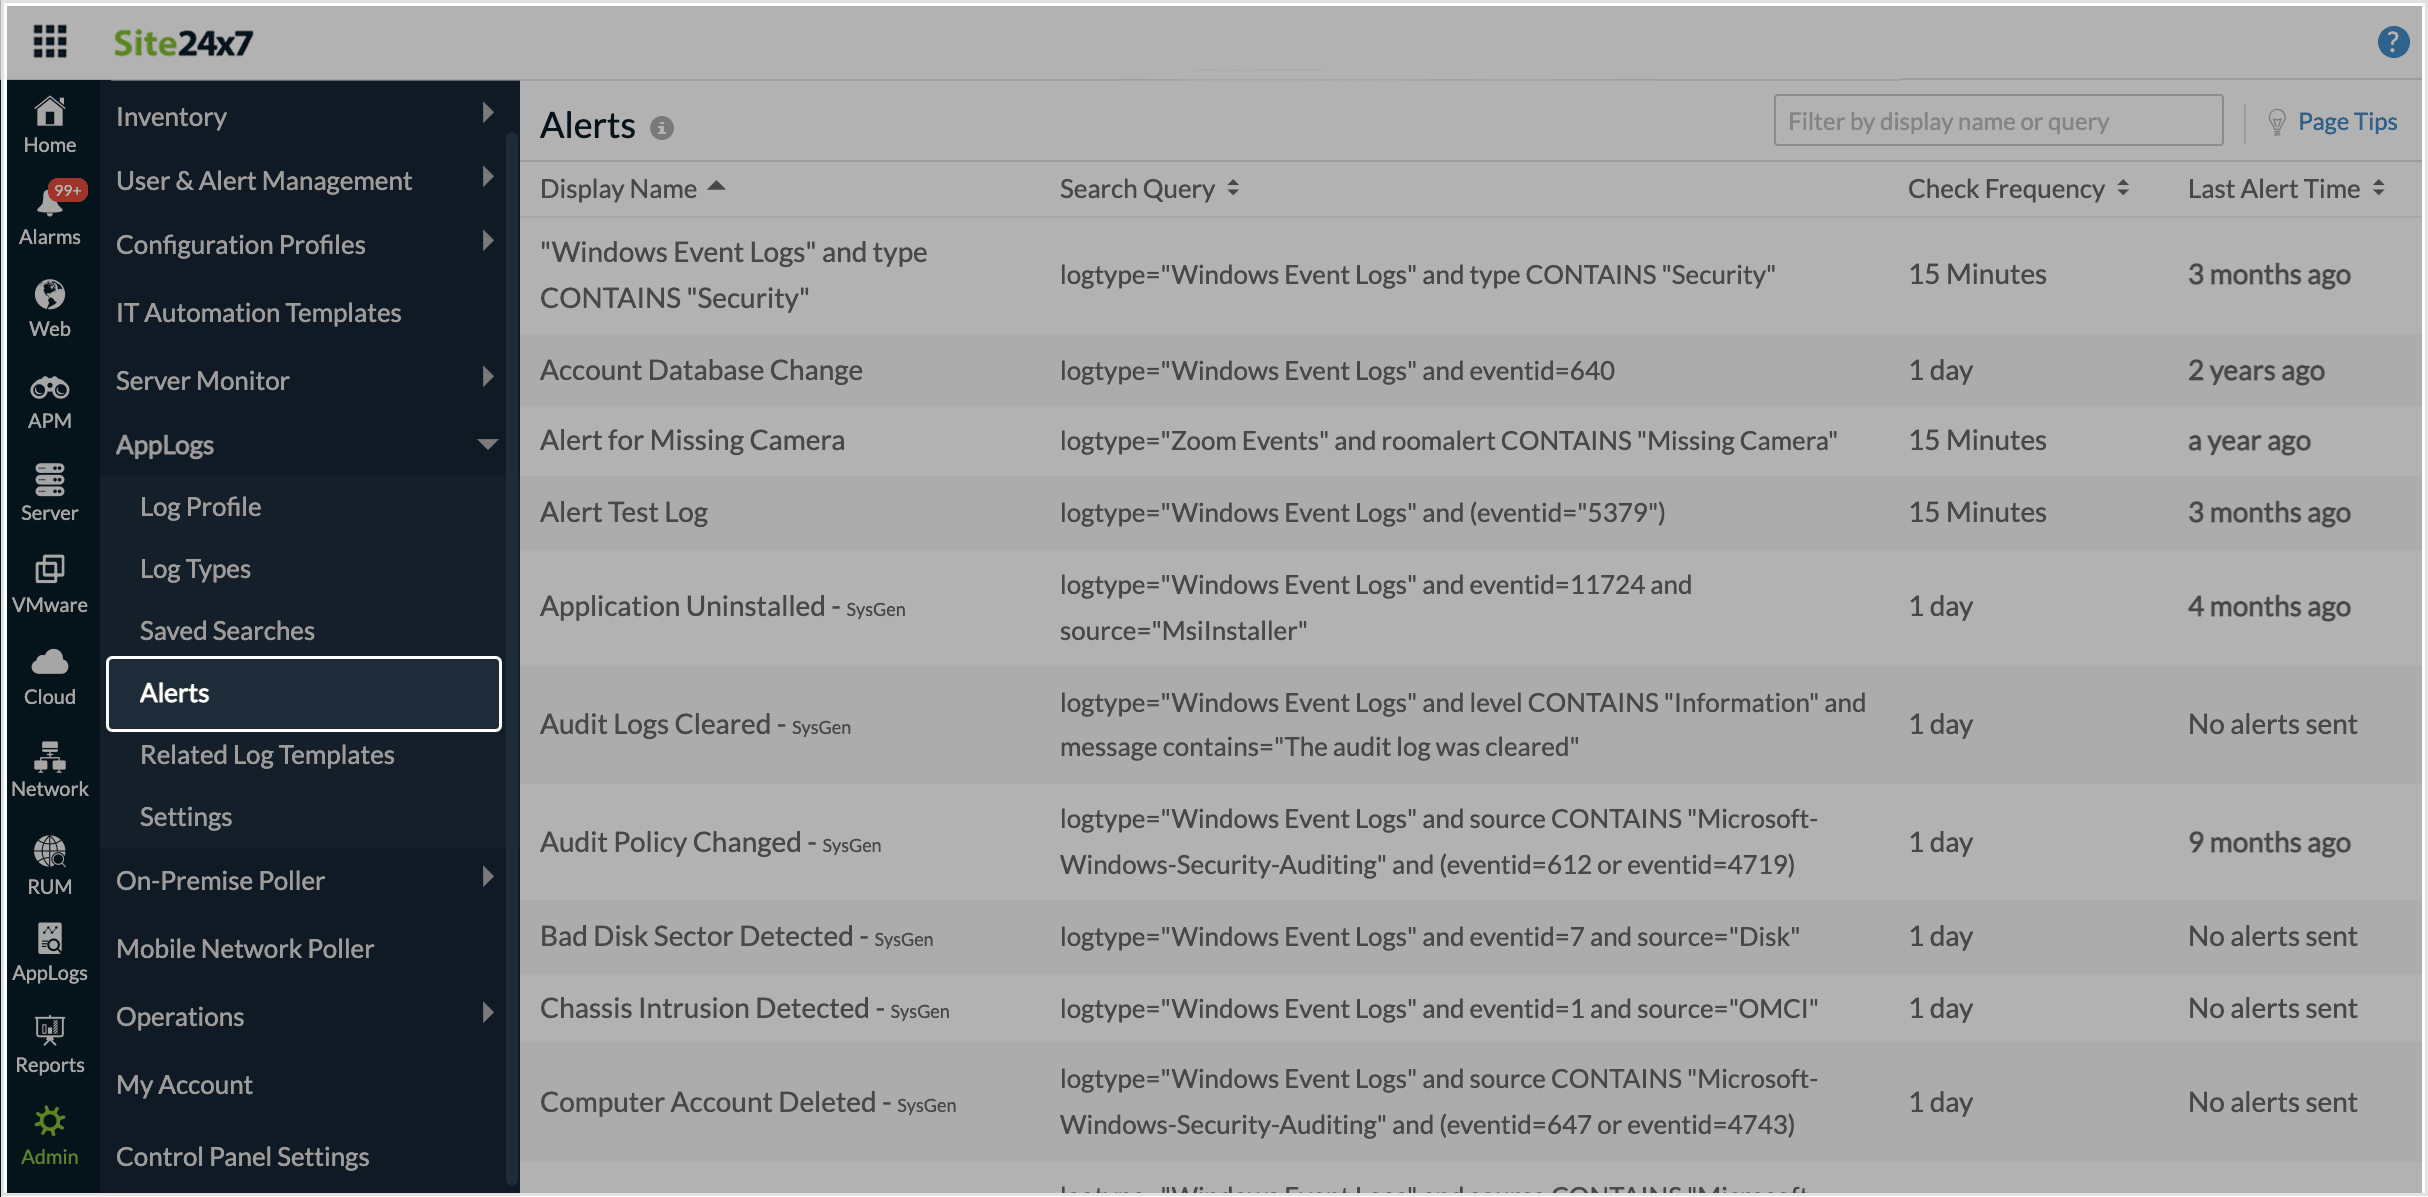
- Go to Admin > AppLogs > Alerts. This page lists all your configured alerts.
- You can edit an alert's configuration by clicking on it.
- To edit an alert's Search Query, click on the
 icon near an alert. You'll be redirected to the AppLogs Search page where you can edit an alert's properties, including the Search Query.
 - You can also delete configured alerts from here.

Related articles:
- Configuring voice calls and SMS alerts
- Licensing for AppLogs Alerts
- Log management with Site24x7
- Supported log types
- Query language search
- Saving search queries