Thread Profiling
Thread profiling enables you to identify and isolate bottlenecks in your code stack. In Site24x7 APM Insight, all thread profiles collected in the chosen time window are listed, along with the thread count, CPU time and memory details. Each thread profile consists of a list of threads that were running when the application was being profiled.
Upon clicking a specific thread profile, one can view:
- High CPU consuming threads,along with its thread ID, CPU time and memory allocated details
- Time consuming methods which could potentially affect application's performance
- Invocation count of every method
Table of contents
To view thread profiling:
- Log into your Site24x7 account.
- Go to Home > APM > your application.
- Click on Thread Profiles tab and then on individual threads to inspect them further.

Types of thread profiling:
Scheduled profiling:
By default, APM Insight schedules thread profiling twice a day for a period of 5 minutes.
On-Demand profiling:
With On-Demand profiling,one can initiate thread profiling at the current time for a duration ranging from 5 to 30 minutes.
The threads are sampled at regular time interval in the specified duration and the collective data is displayed at the end of time duration.
To initiate On-Demand profiling,
- Log into your Site24x7 account.
- Go to Home > APM > your application.
- Click on Thread Profiles tab and then click on On-Demand Thread Profiling tab.
- Specify time duration and click on Initiate profiling.


On-Demand profiling can be initiated for both applications and instances.
- In application view, On-Demand profiling will be initiated for the first available instance.
- In instance view, On-Demand profiling will be initiated only when the instance is UP.
- When you try to initiate On-Demand profiling when the instance is Down,you will receive an alert message saying "Agent is currently DOWN.Please try after some time

- When your instance is suspended, On-Demand profiling will be disabled

Top N resource-consuming threads
With this option, you can easily identify the threads that consume the most CPU or memory. You can choose any value (N) from five to 20.

When ON-DEMAND thread profiling is requested, the agent also monitors the CPU and memory usage of each thread. The agent picks the top N threads that consumed a large amount of resources from each category (CPU and memory) based on the N value you provided. Once the profiling is finished, the threads, along with their usage statistics and stack traces, will be displayed in the Site24x7 web client.
The below figure shows the threads sorted in descending order by the amount of resources consumed.

Automated thread profiling
You can create a thread dump automation that triggers thread profiling automatically based on the given conditions.
Add thread dump automation
You can automate the thread profiling process by following the below steps:
- Click the hamburger icon (
 ) next to the Application/Instances drop-down.
 - Select Edit. The Edit APM Insight Application screen will open.
- Navigate to the IT Automation Templates field in the Configuration Profiles section and select the automation from the drop-down menu.
 You can also create a new automation template.
- Choose when it should executed from the Execute on drop-down menu. Options include:
- Execute on Down
- Execute on Critical
- Execute on Trouble
- Execute on Up
- Execute on any attribute status change
- Execute on any status change
You can add multiple automation for the same monitor.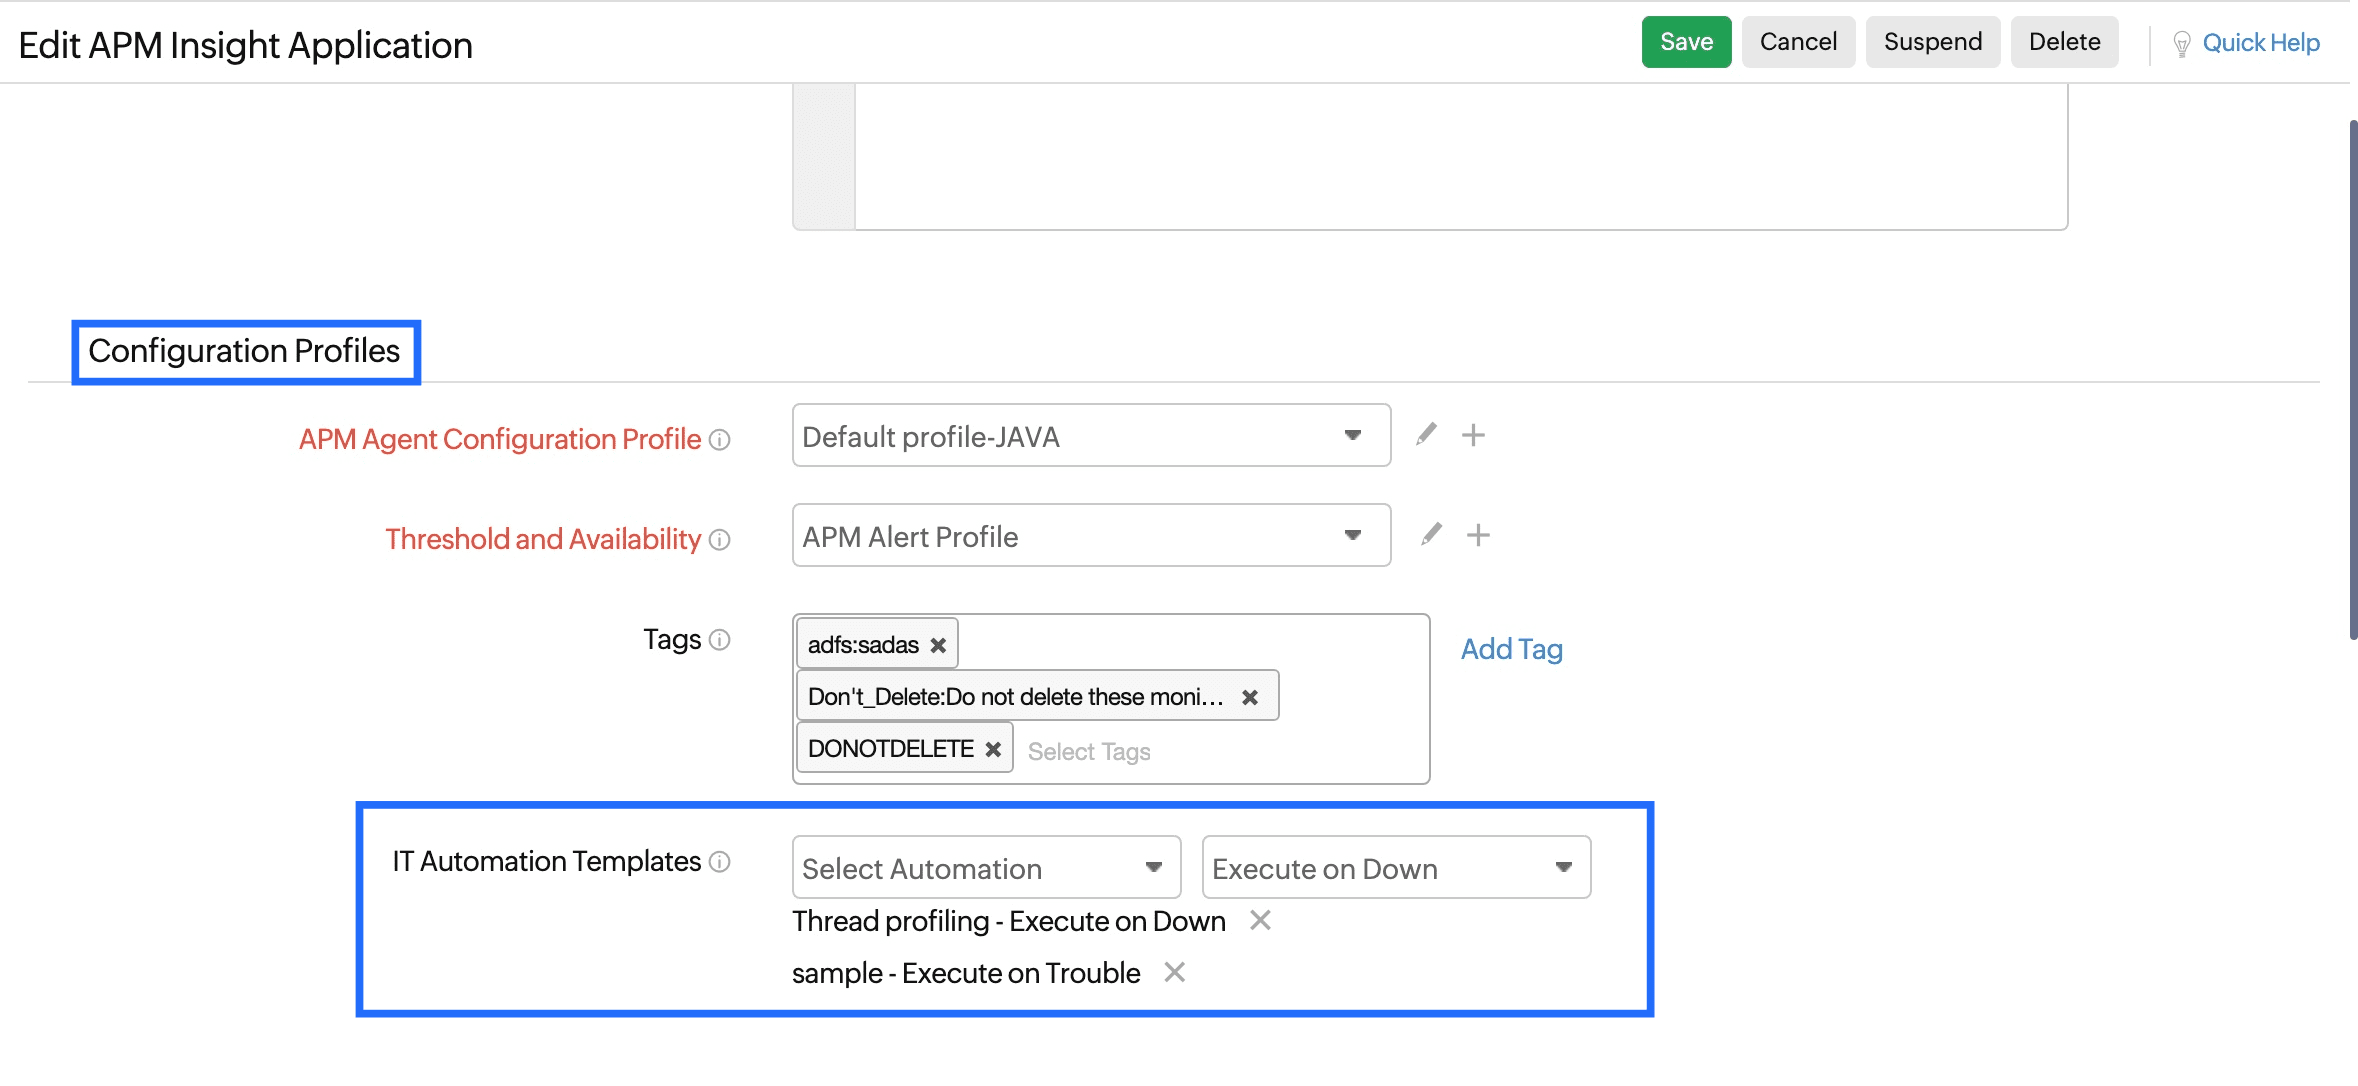
- Click Save.
Create a new thread dump automation template
To create a new thread dump automation template, follow the below steps:
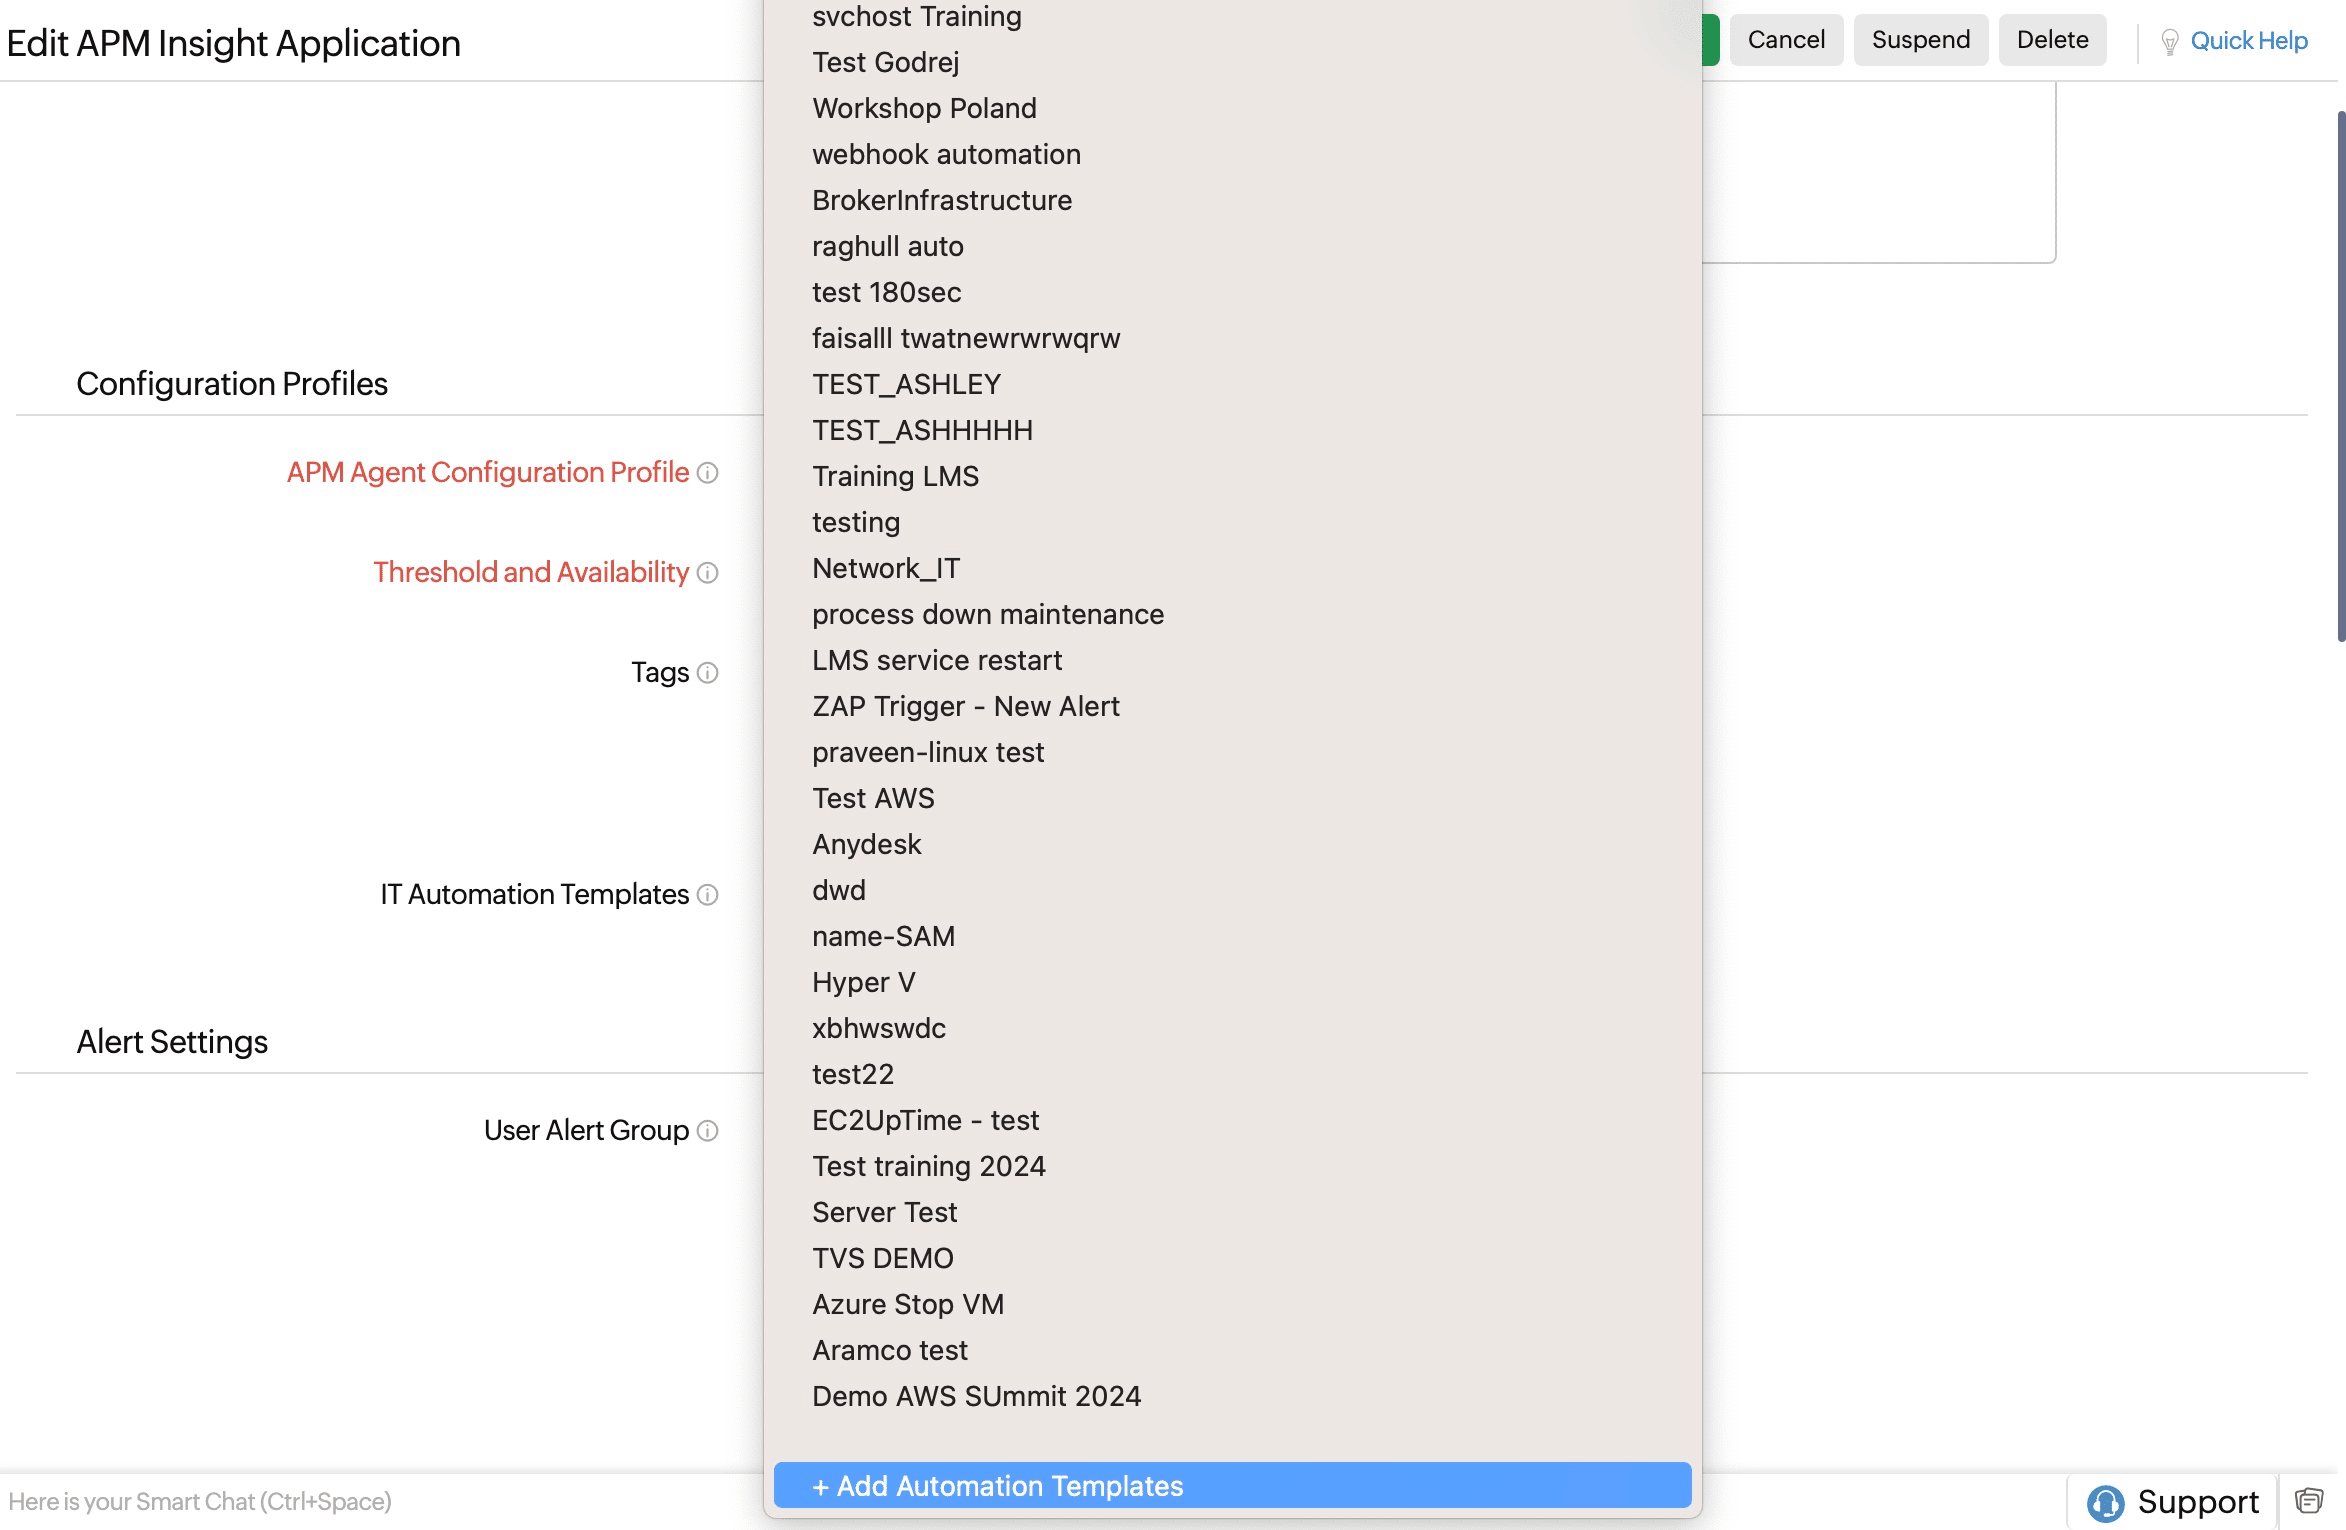
- Click the Select Automation drop-down menu and scroll to the bottom to choose +Add Automation Templates.
- In the Add Automation Templates pop-up, enter the details as given below.
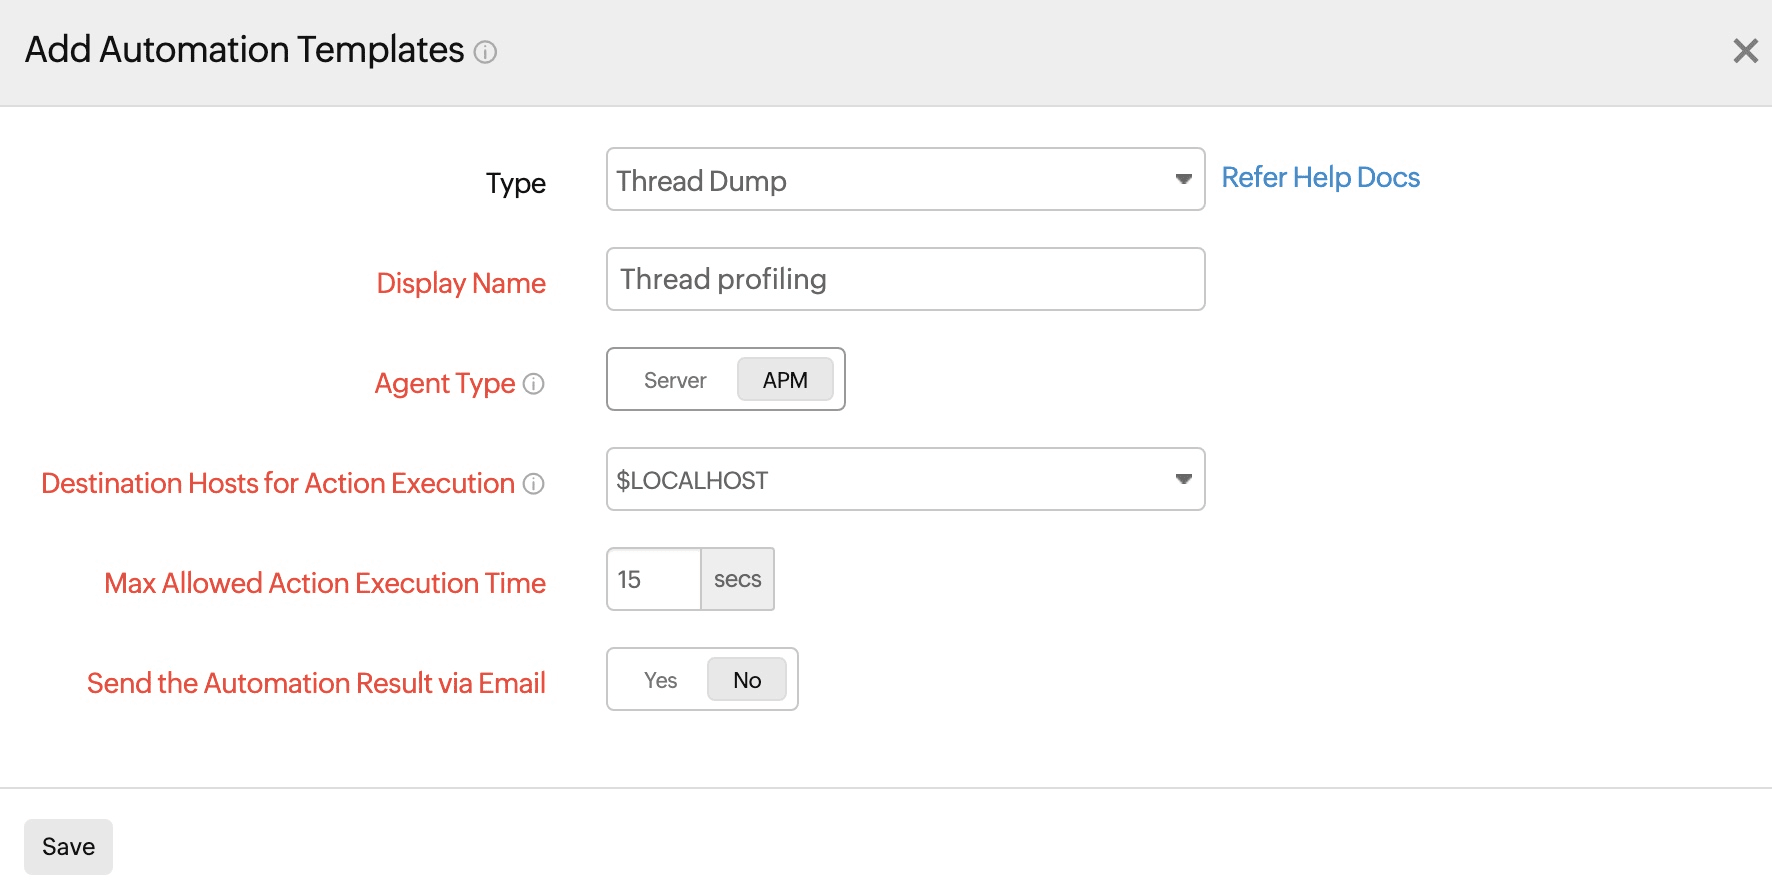
- Type: Thread Dump
- Display Name: Provide the display name as per your convenience.
- Agent Type: APM
- Destination Hosts for Action Execution: The default value for this field is $LOCALHOST and cannot be modified.
- Max Allowed Action Execution Time: The default time-out duration is 15 seconds, but you have the option to set it anywhere between one and 90 seconds.
- Send the Automation Result via Email: You can choose Yes to send an email of the automation result to the user group(s) configured in the notification profile. By default, it is set to No.
- Click Save.
Once an automation is added, it will be added to the IT Automation Templates drop-down menu.
Video
Here's a quick video of how thread profiling works:
Next step
Check out the Thread Dump Analysis feature to explore more about thread profiling.