Good day folks,
Custom Dashboard has always been one of the most sought-after product enhancements at Site24x7. Also, now with our renewed focus on Reporting and Dashboards, it was only a matter of time before the feature became a reality. We're excited to introduce to you our brand new Custom Dashboards -- A new way to build personalized and customizable dashboards, which can portray all your monitoring data in a single interactive view, all without any additional coding. So, without further ado, let's see what's new and exciting about Custom Dashboards.
Build Dashboard from the ground up using Dynamic Widgets
Site24x7 has been providing standard dashboard views and reports out-of-the-box. These views let you trace your monitoring trends and identify potential performance issues, in a matter of minutes. Now with the Custom Dashboards, we're giving you complete freedom and ability to build and design dashboards, which can portray critical monitor metrics for a relative time stamp of your choice.
We have brought in a set of dynamic widgets that can render your monitor's availability and performance attributes in numerical and graphic charts inside the Dashboard grid. You can filter the widget category, pick the right attributes for your monitors, and select a time period of your choice; once done, drag and drop the widgets onto the Dashboard grid. You can pin up to 24 widgets on a single dashboard grid and create 20 such custom dashboards, in total.
Widgets Supported
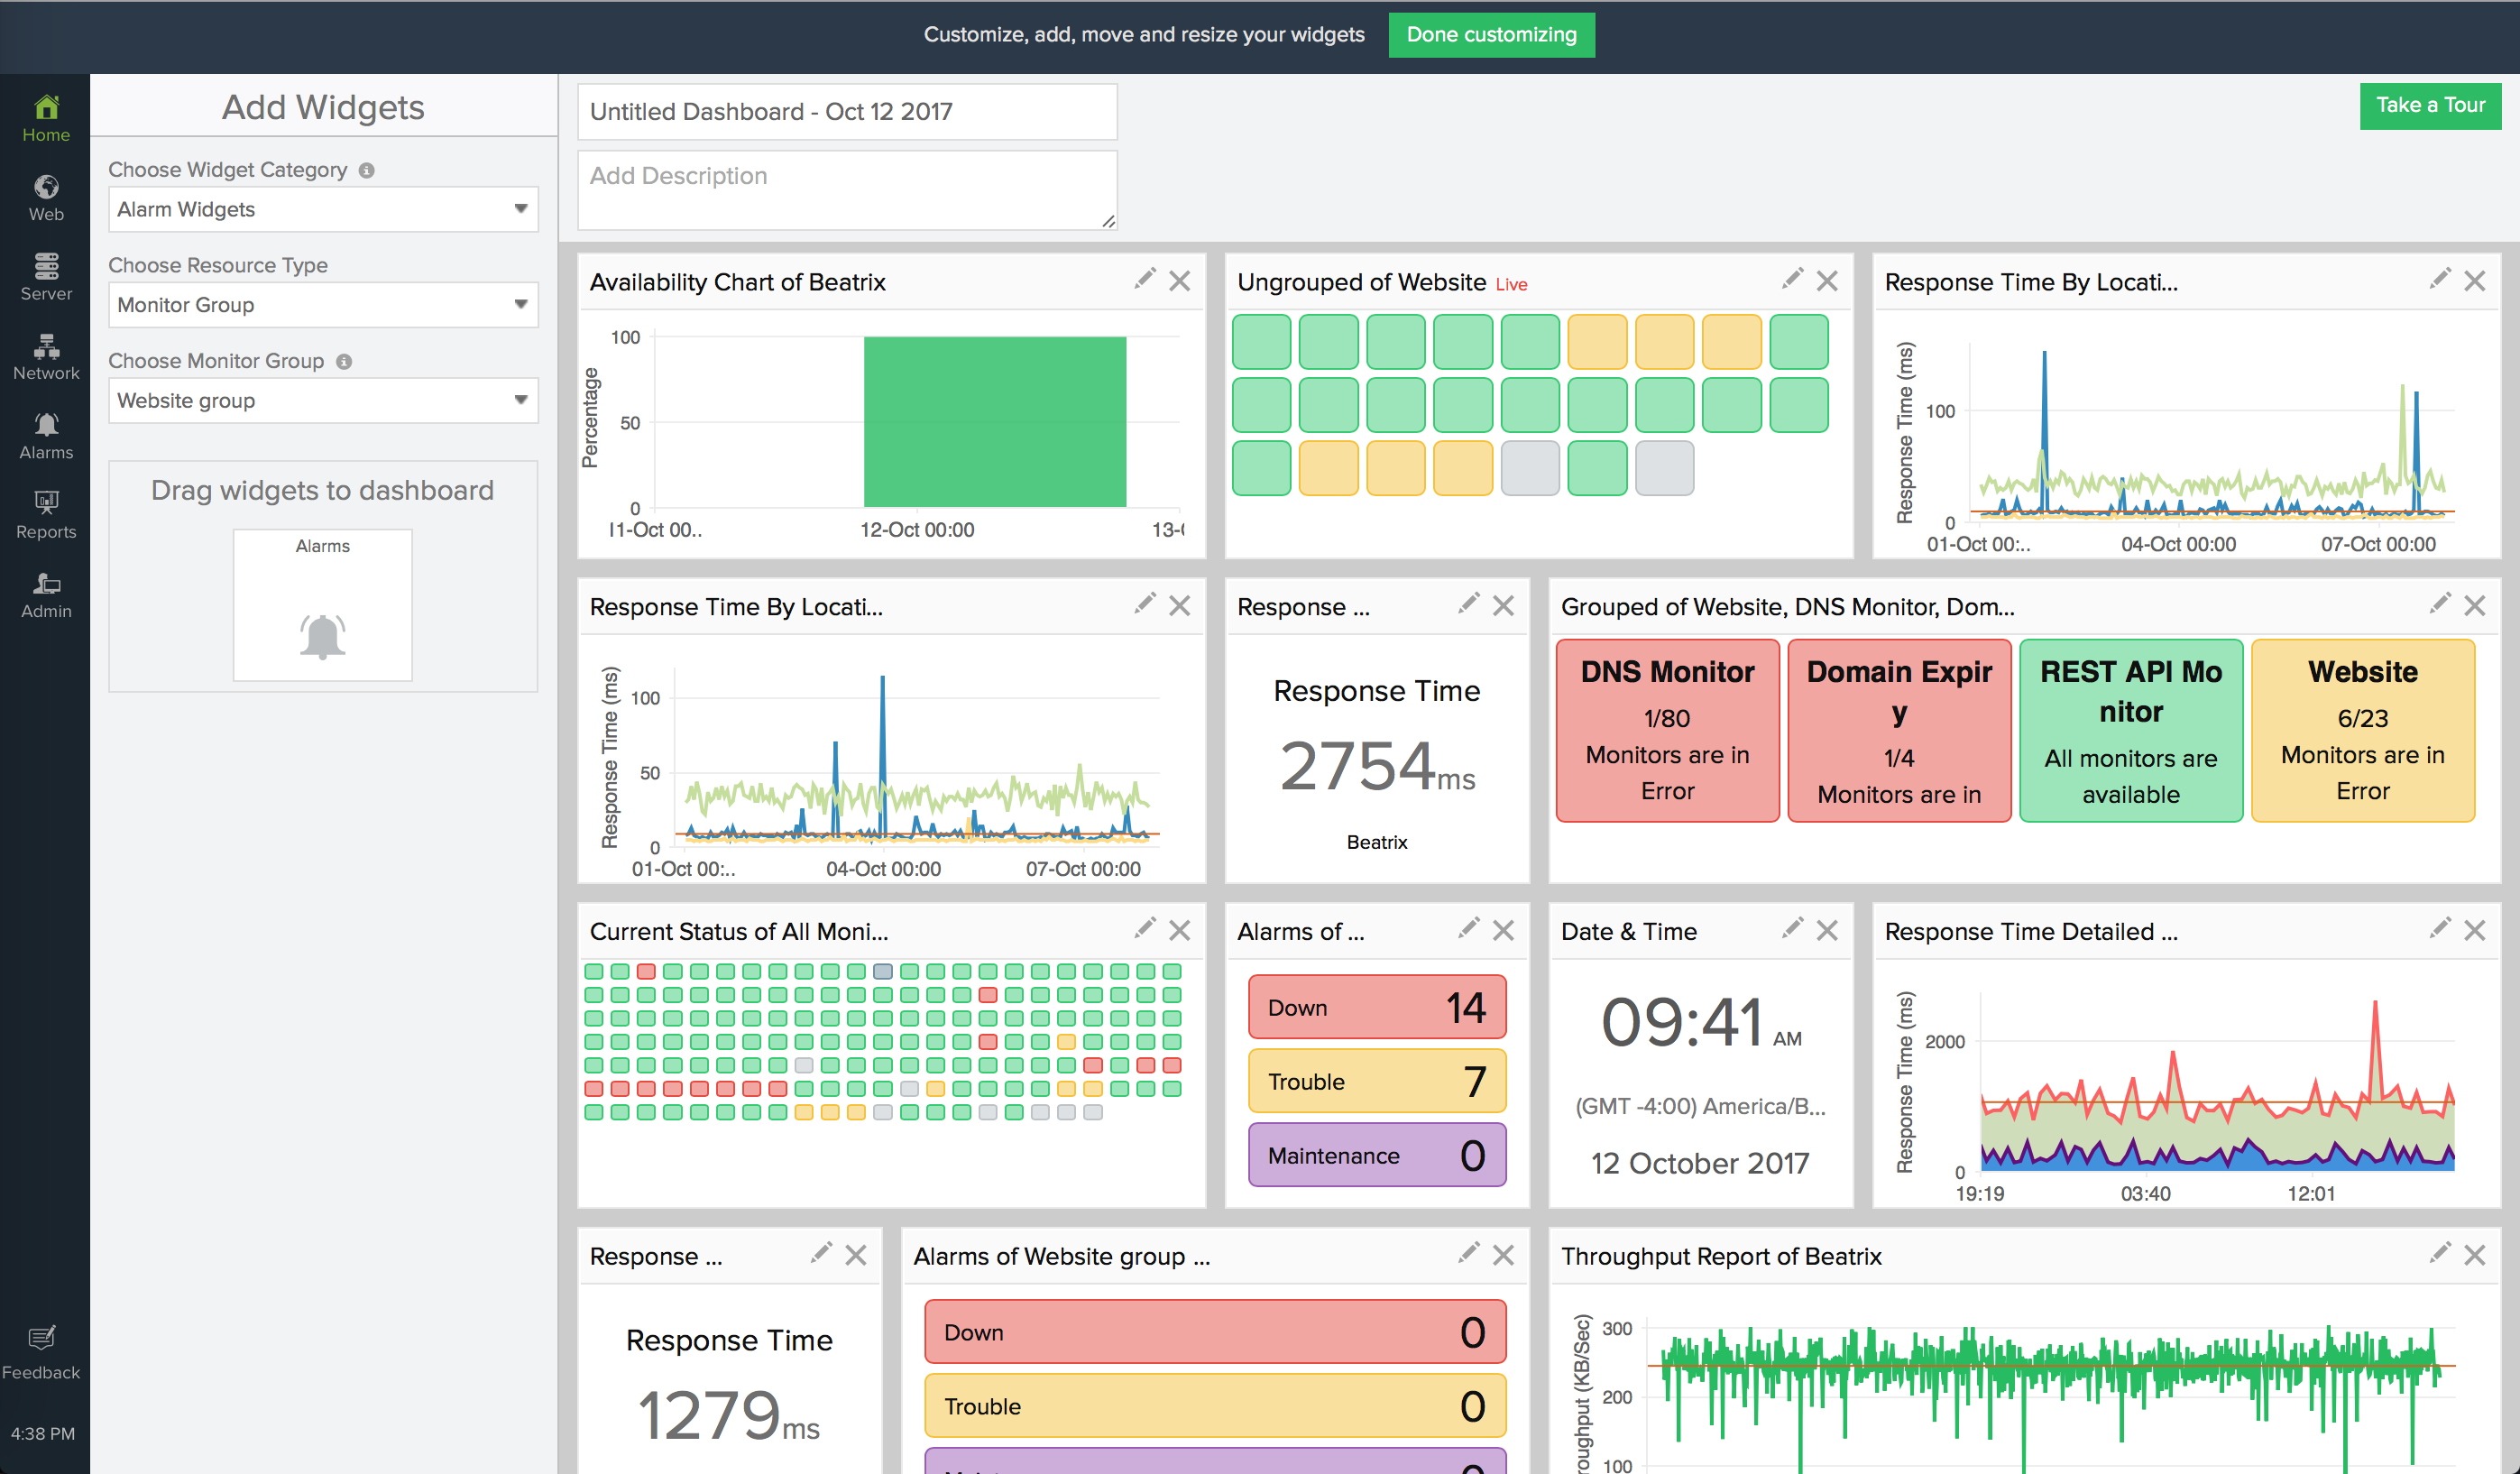
We offer multiple widget categories, out-of-the-box. They're Performance widget, Availability widget, Current Status widget, Alarm widget and General widget.
- The Performance widget lets you render performance attribute data supported by your monitor. You can either pick a numerical view or a graphical view to display your data.
- Availability widget allows you to showcase the actual uptime of your monitor in an area graph for the time selected by you.
- The Current Status widget gives real-time monitor status data of your selected monitors. You can additionally filter resources based on their actual operational status. It portrays a mini NOC view of your monitors' status. If you've selected the resource by Monitor Group or Monitor Type, it allows you to show the monitors as a Grouped widget or an Ungrouped widget.
- Alarm Widget lets you showcase the Down, Trouble and Maintenance Alarms count for your selected resources in a single widget view. This widget, similar to the Current Status widget updates the data in real-time.
- On selecting the general widget category, you have an option to pick a Date & Time widget. The date and time widget will render the actual date and time at your preferred time zone. At present, this is the only widget in this category. However, we will add more such widgets over time.

Allow Custom Visualization of your Dashboard View
Our custom dashboards have been designed with the idea of simplicity in mind. The dynamic widgets allow you to manipulate the data being pumped through the Site24x7 servers and offer custom visualization of your requisite attribute data in a single interactive interface. You can edit, delete, resize and reposition a widget, once it's pinned onto the dashboard grid. You can render all your critical data across your IT infrastructure to fit on one screen, which may be Mobile, Tablet, Laptop or a mounted NOC Monitor view. The dashboard auto-updates every minute without the need for any third party tools to auto-refresh. However, you can always manually refresh the dashboard, if needed. In addition to all these features, the Day-mode and Night-mode themes can help you with a comfortable viewing experience round-the-clock.
Although the data gets rendered for a widget-level time selection, you can always override this setting with a global time selector button in the Dashboard View. You get to view the data in the widgets with a granularity of RAW, Hourly, Day or Weekly data when you select the time, viz., one day, one week, one month or even a custom date range.
Make Dashboard Public
Once you're done customizing your dashboard, you can instantly make the dashboard public by generating a permalink for the dashboard. It can then be embedded and shared across your customers or peers as a read-only dashboard. However, if you don't wish to share the dashboard view across, you can still extract the dashboard view as a PDF document and share with only the desired folks.
Roles and Permissions
All customers having a paid subscription plan gets to access Custom Dashboards. However, only a user with a Super Admin or Admin roles can Add/Edit/Delete the dashboard. Other sub-user roles like Operator, Spokesperson, and the Read-only user will be able to view the Dashboard and widget data only if sufficient privileges are extended. To know more about this, check out our roles and permissions document.
Help Resources
Learn how to set-up Custom Dashboards for your monitoring needs.
We look forward to enhancing and refining our Custom Dashboards feature as we move on. So, start building your first custom dashboard now and feel free to share your valuable feedback and suggestions here.
Hello,
We've some exciting news for our MSP users! Today, we're extending support for Custom Dashboards to all MSP Plan users.
With this launch, MSP Admins will be able to aggregate and share metric data from various customer accounts publicly or privately with multiple stakeholders. Although the Custom Dashboards offer the same flexibility and personalization, MSP Admins can now create dynamic widgets from different customer accounts and then portray the data on a single dashboard view.
We'd request you to read our MSP user documentation to know more about the Custom Dashboards set-up and limitations in the MSP Control Panel.
Regards,
Abhiram
Hello,
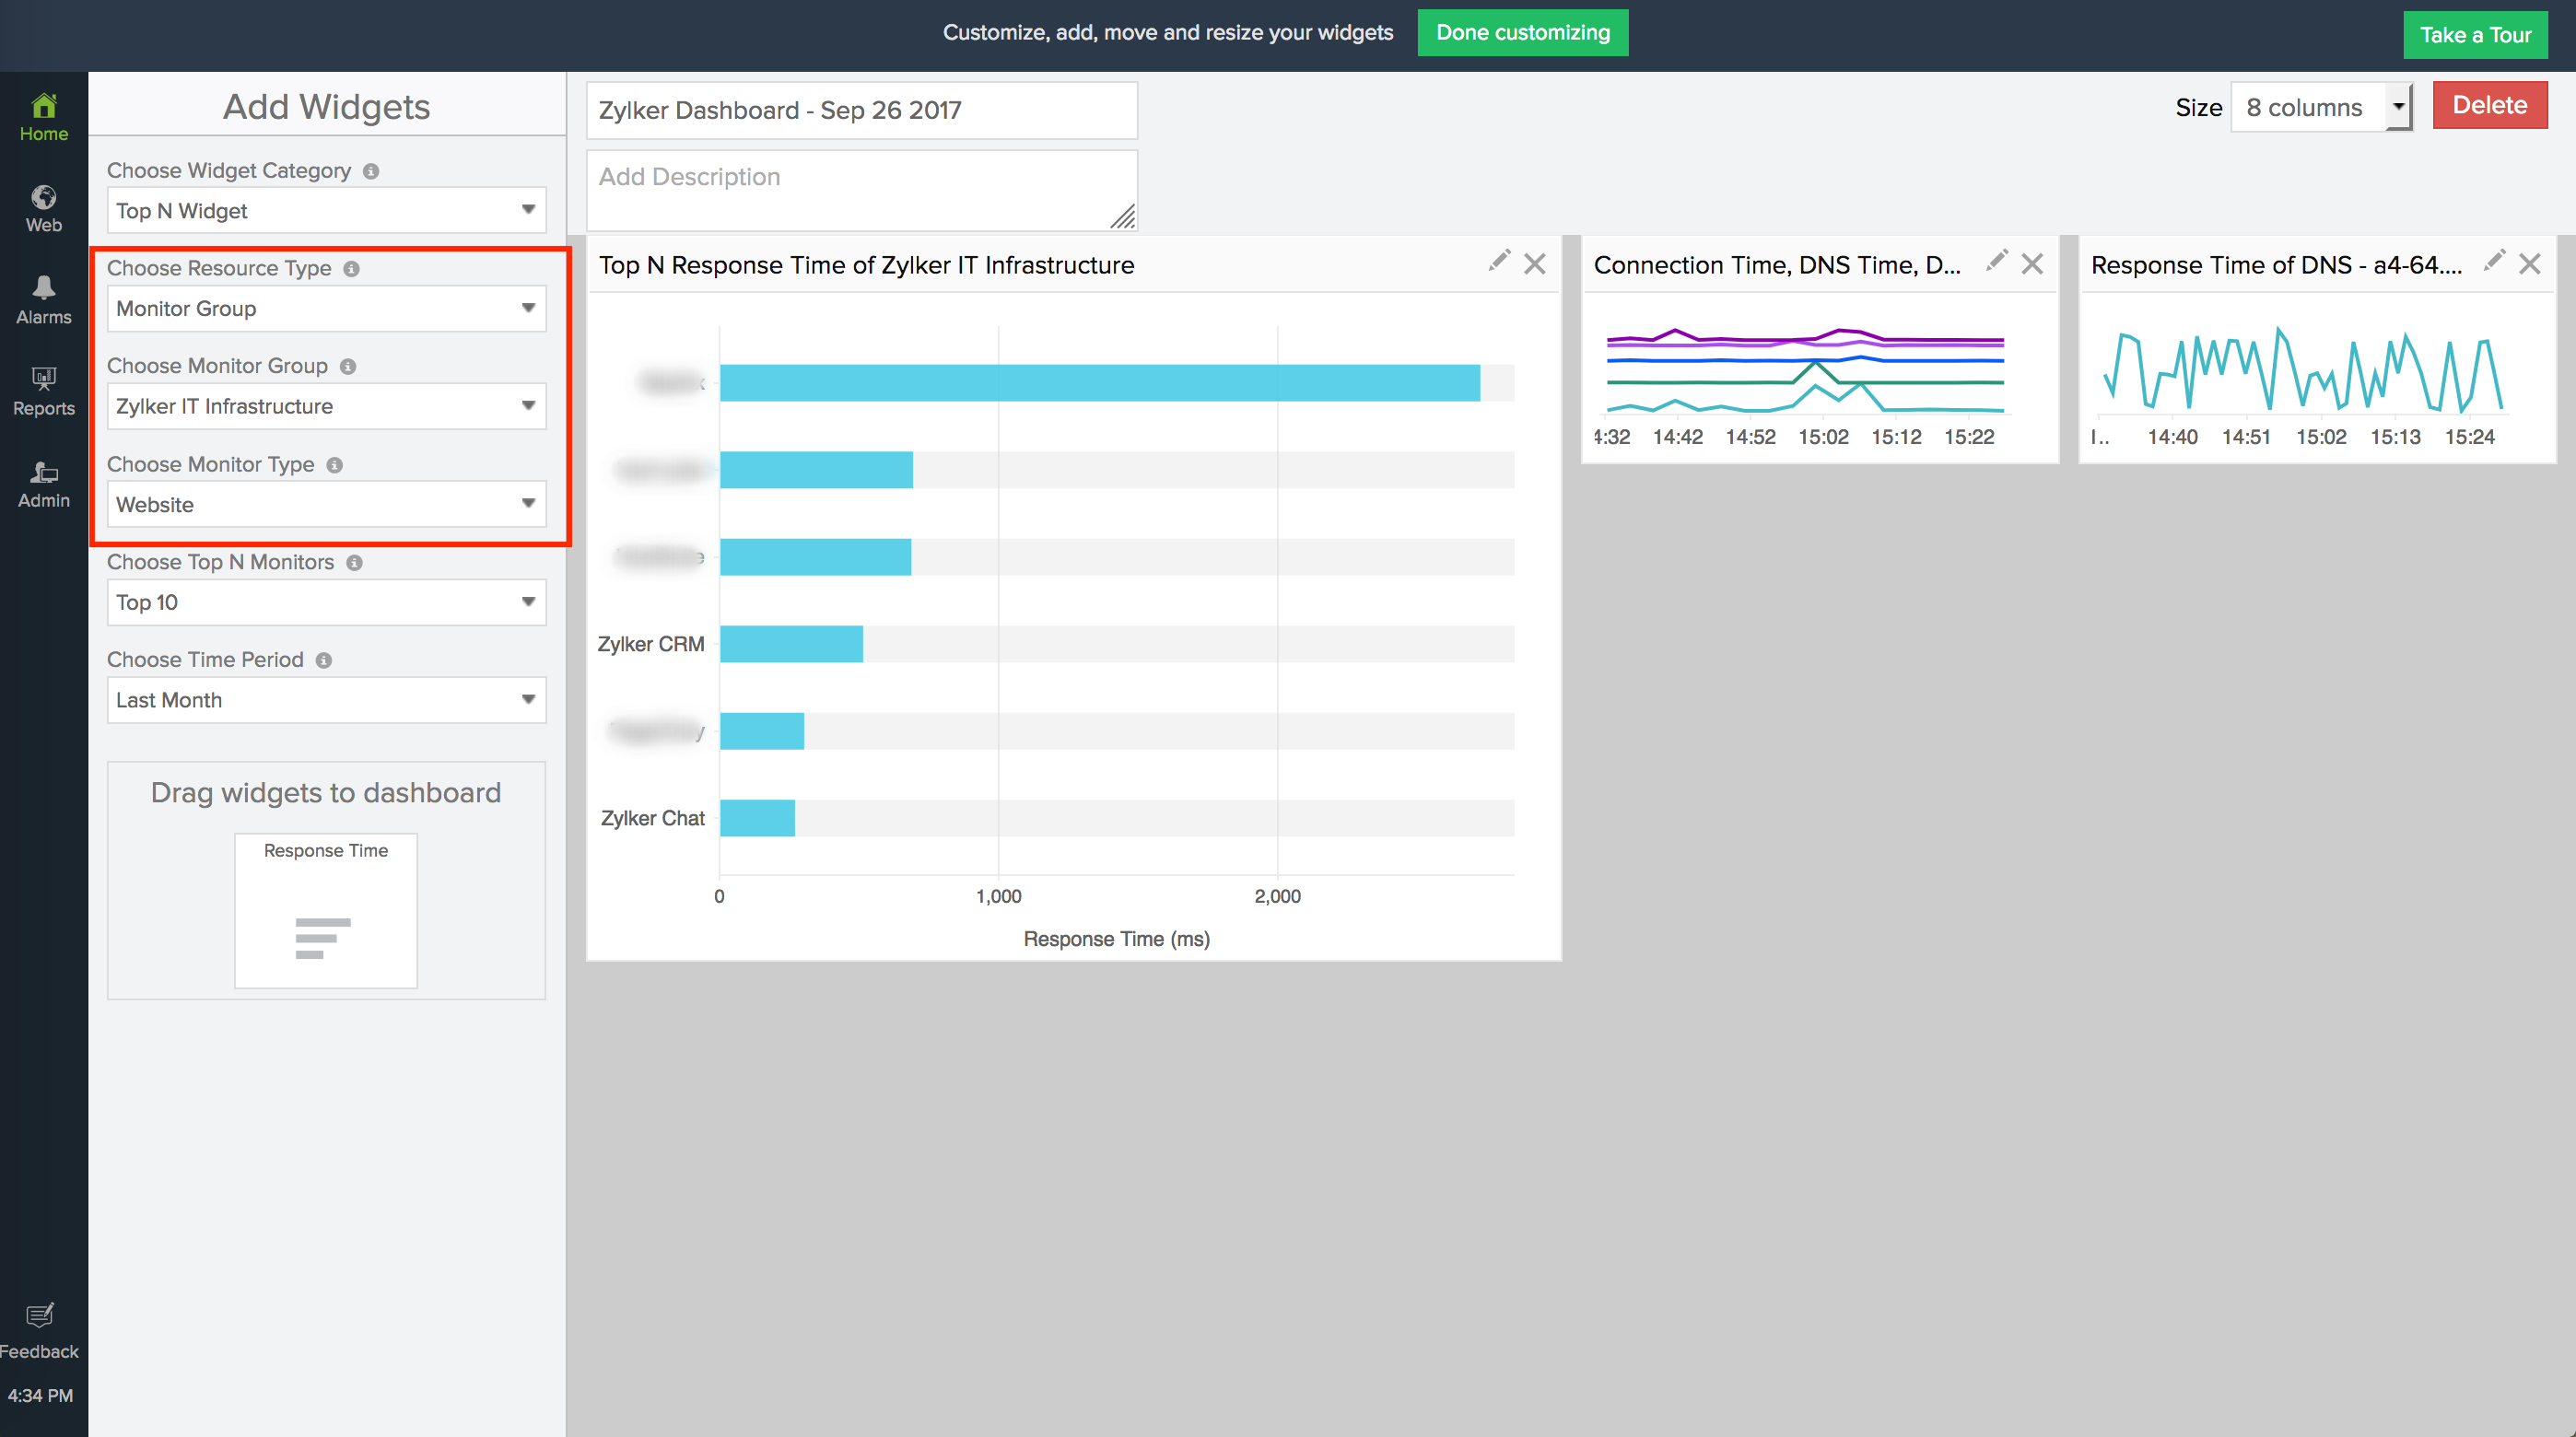
We've added an all new—Top N Widget to the Custom Dashboard. The Top N Widget shows the Top 5, 10, 20, or 25 monitors (of a selected type) in the descending order of their performance data. The widget facilitates quicker troubleshooting by enabling you to compare and dissect the best and worst performing monitors. Once published in the dashboard, the data in the widget is auto-refreshed every 10 minutes. Please read our help document to learn more about the widget.

Regards,
Abhiram
Hello,
We’re excited to announce the addition of a new Multi Attribute widget and a whole lot of under-the-hood tune-ups for our availability and performance widgets. Let’s dive into each of these enhancements, one-by-one:
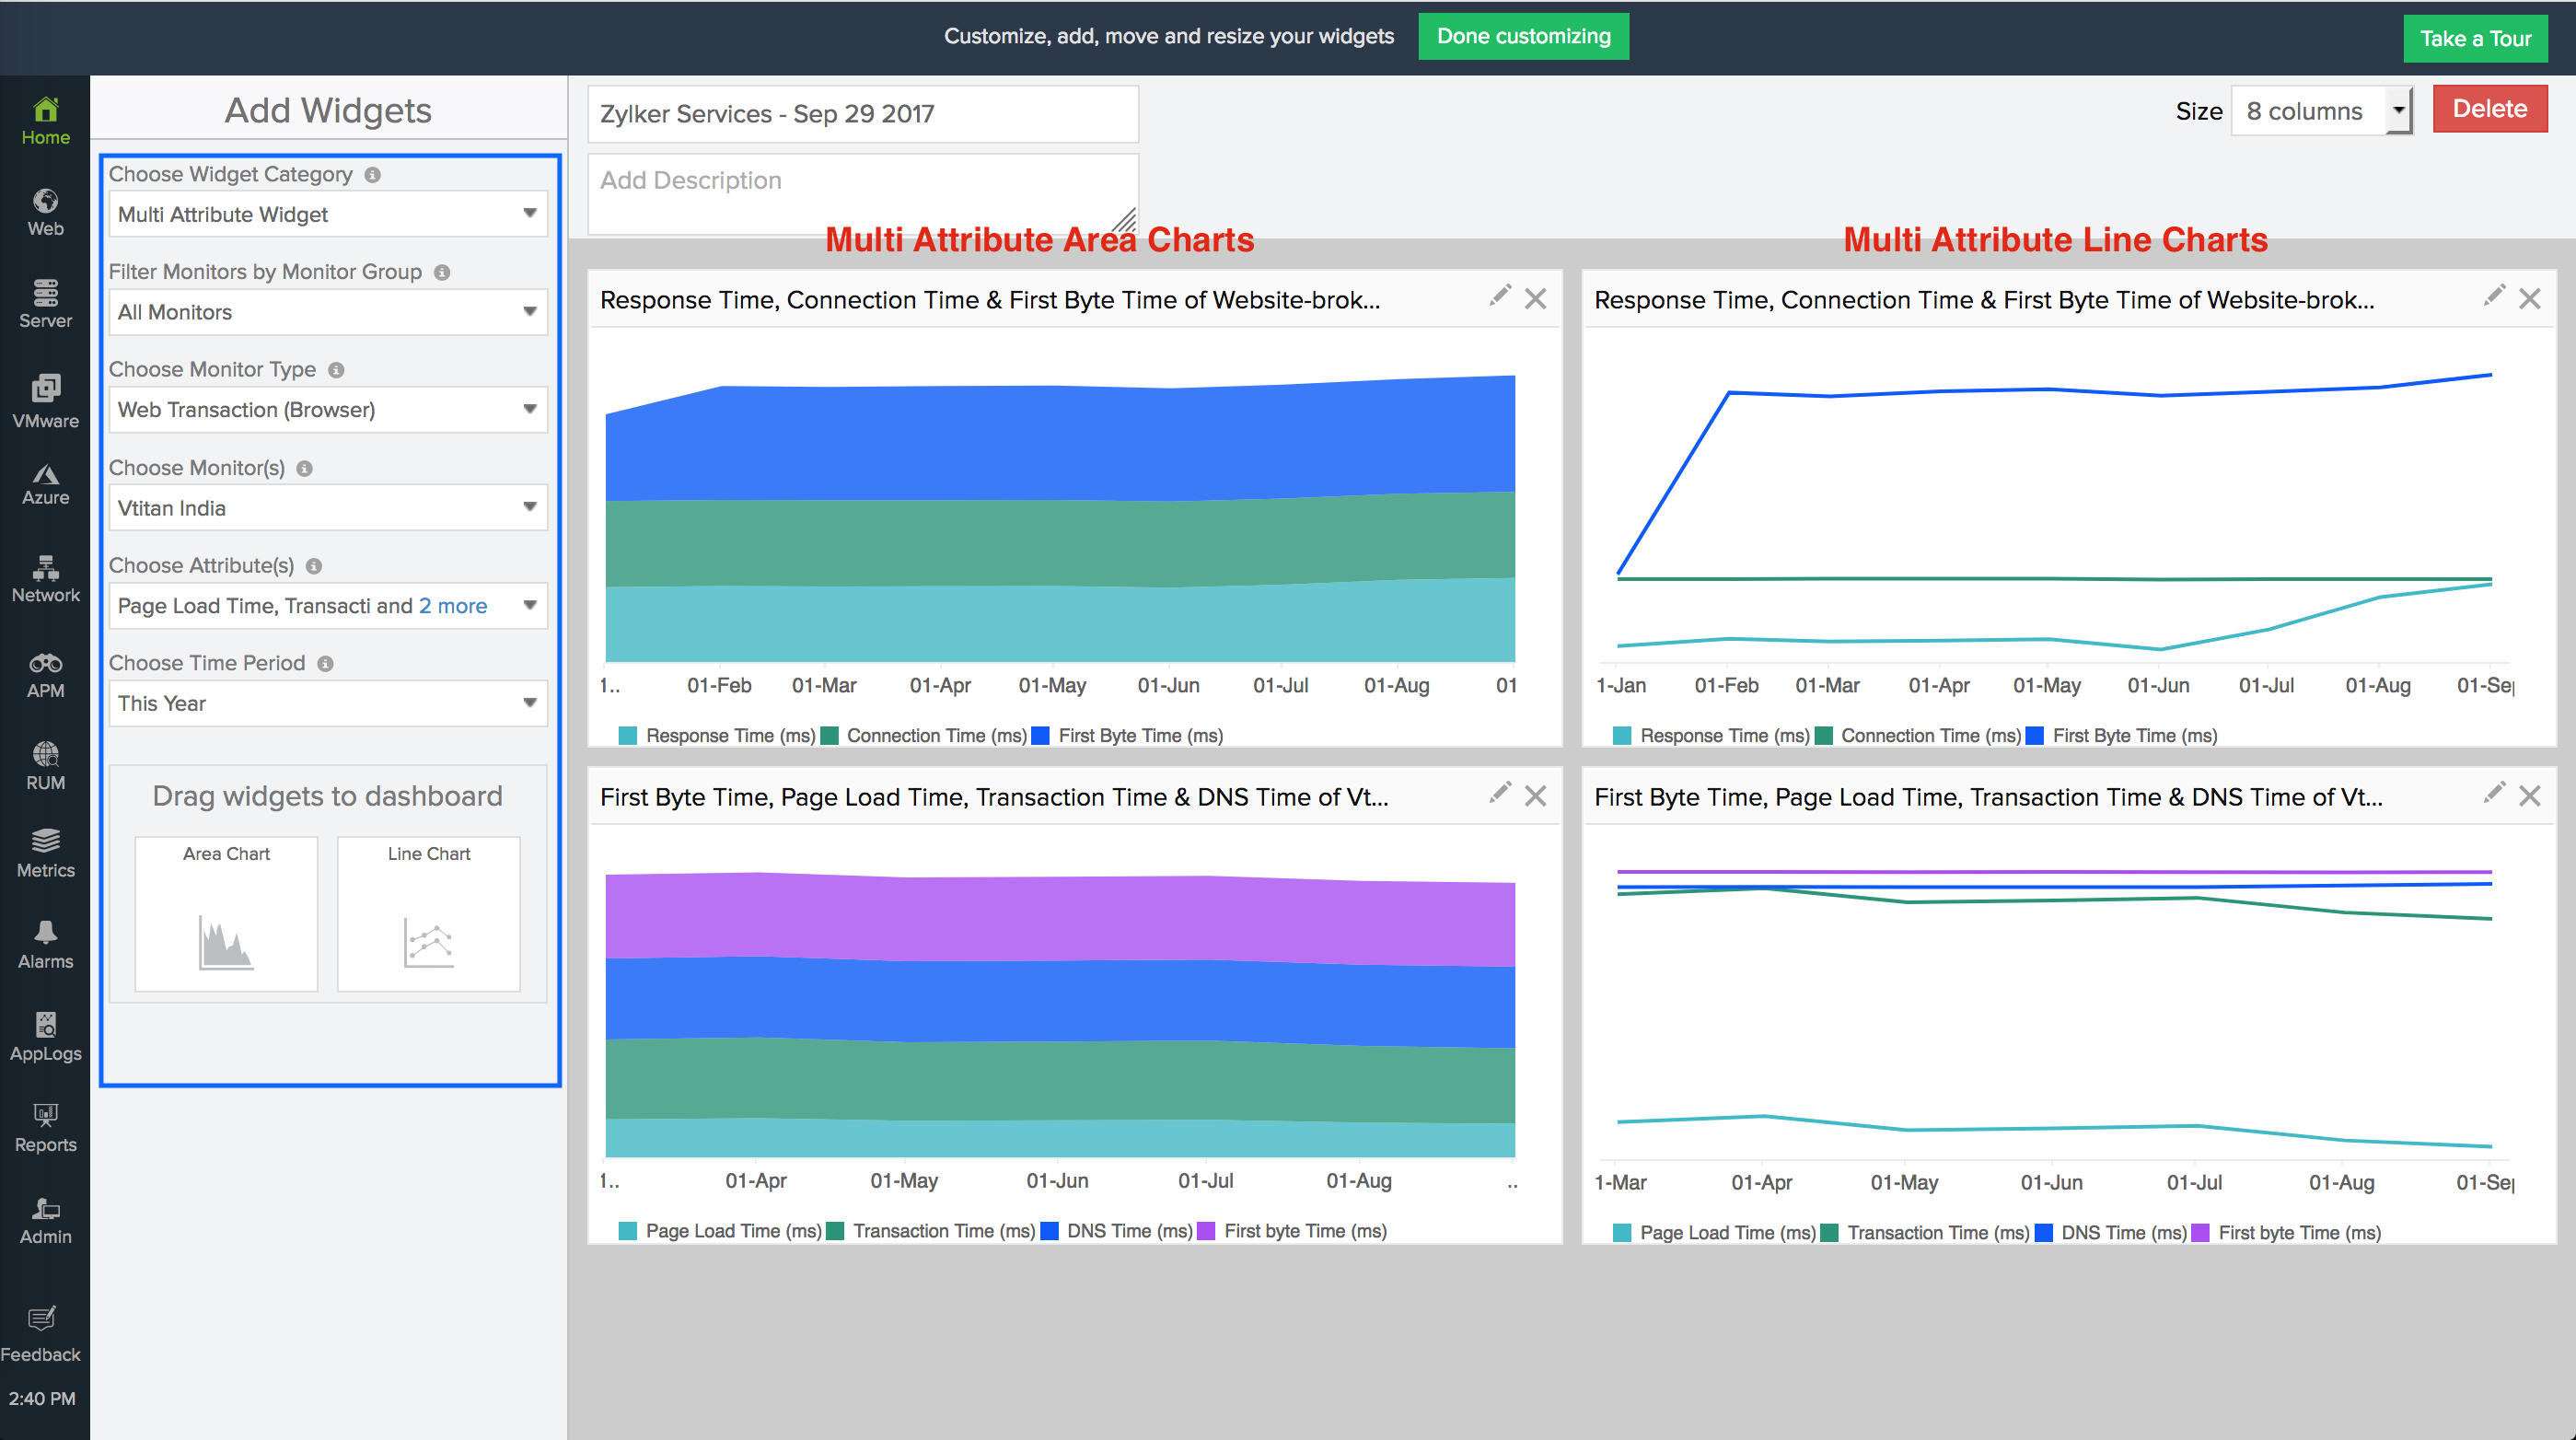
Multi attribute widget
The Multi attribute widget lets you view and compare upto five performance metric attributes of a monitor for a designated time. You can quickly isolate all the troublesome attributes that's hindering the overall performance of your monitor at a specified time period. You can create an area or line chart widget as per need.
Ability to add more widgets
With our recent enhancement, you now have the ability to add upto 100 unique widgets in a single dashboard.
Support for Monitor Groups in Availability and Performance widgets
While creating an availability or performance widget in Custom Dashboard, you can now pick Monitor Groups as a resource type. However, this selection is enabled only when you create a numerical widget. Previously, you're able to create widgets for Monitors alone.
Color labeling in availability and performance numerical widgets
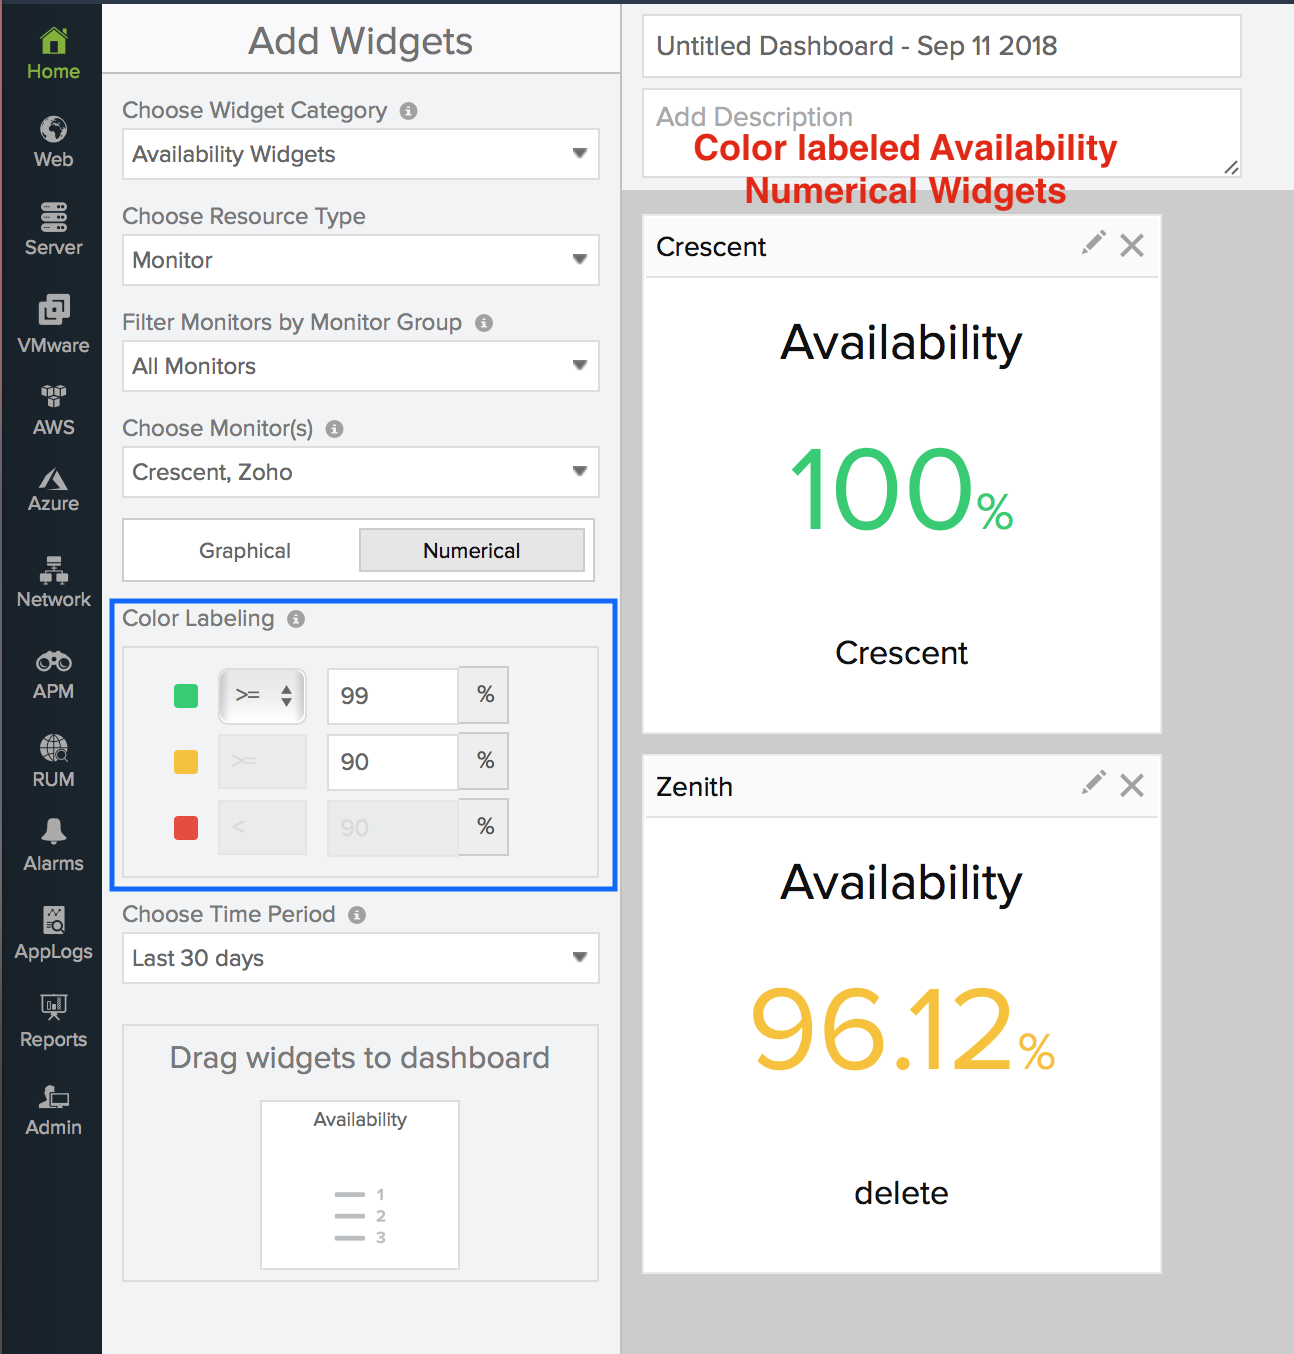
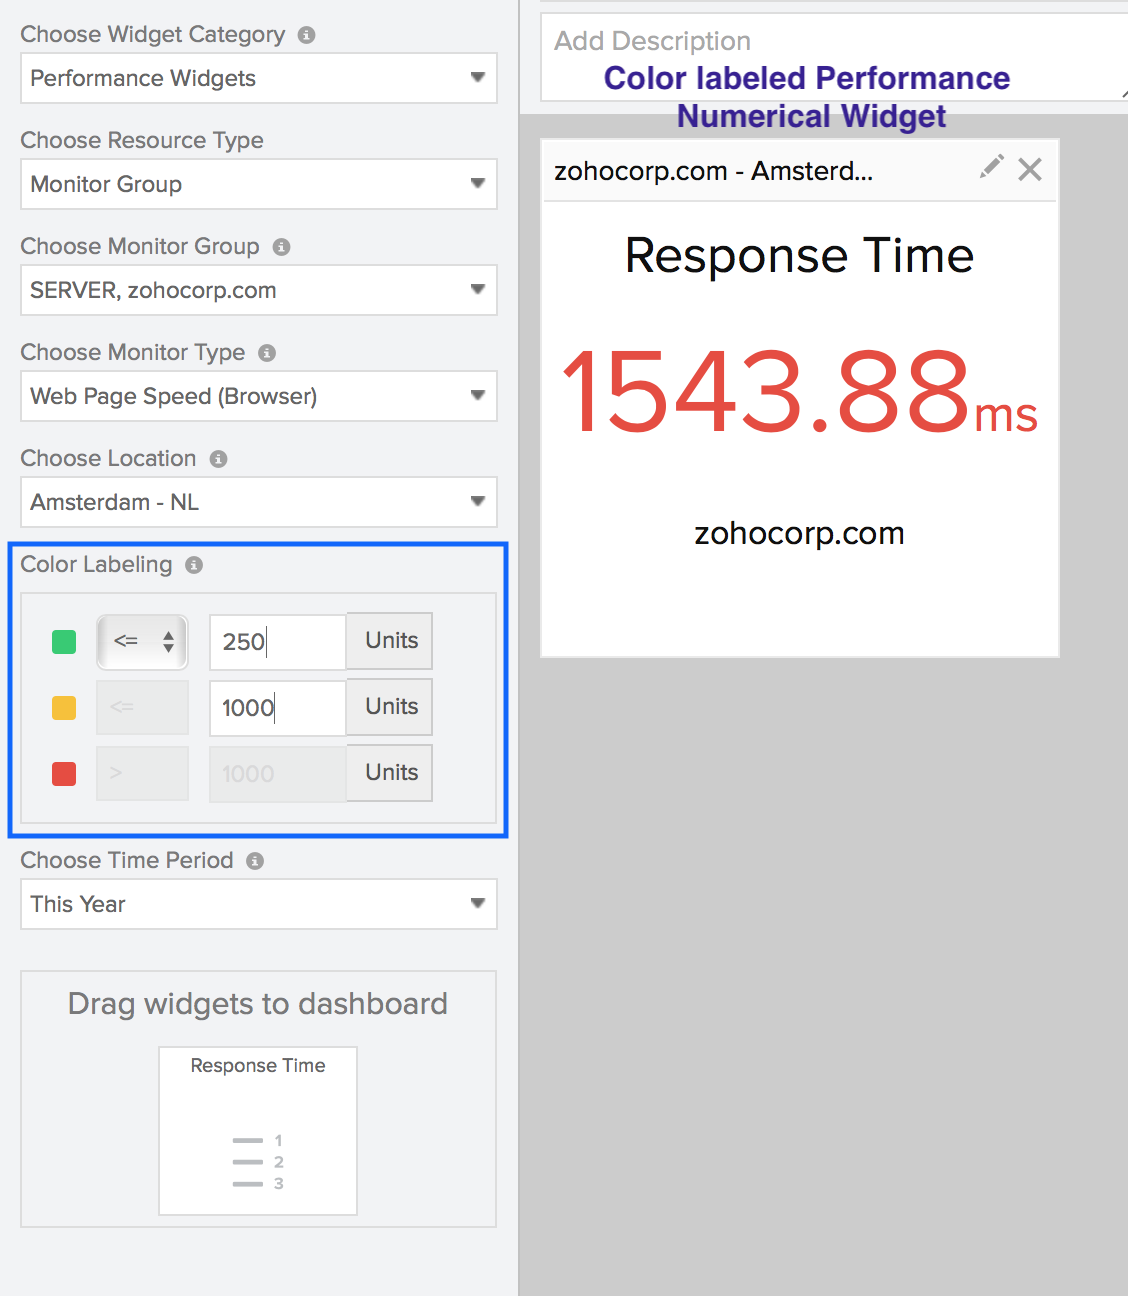
As mentioned above, we’ve now extended support for availability and performance numerical widgets. You can easily set up these numerical widgets for specific monitors or a monitor group in your account. You can also add colour labels to these numerical widgets. By setting up unique conditions and specifying custom metric values, you can render the widget data in green, orange, or red. Once the actual data breaches any of the defined conditions, the corresponding color gets applied to the value in the widget.
Let’s see two separate examples to help you learn more about color labeling of numerical widgets.
Color labeling and availability numerical widget

Color labeling and performance numerical widget

Regards,
Abhiram
Hello,
We've added some minor upgrades to the Performance widget in Custom Dashboards. From now on, you'll be able to add and view Performance graphical widget for selected monitor groups. This is an addition to the performance numerical widget, which is already available for monitor groups.
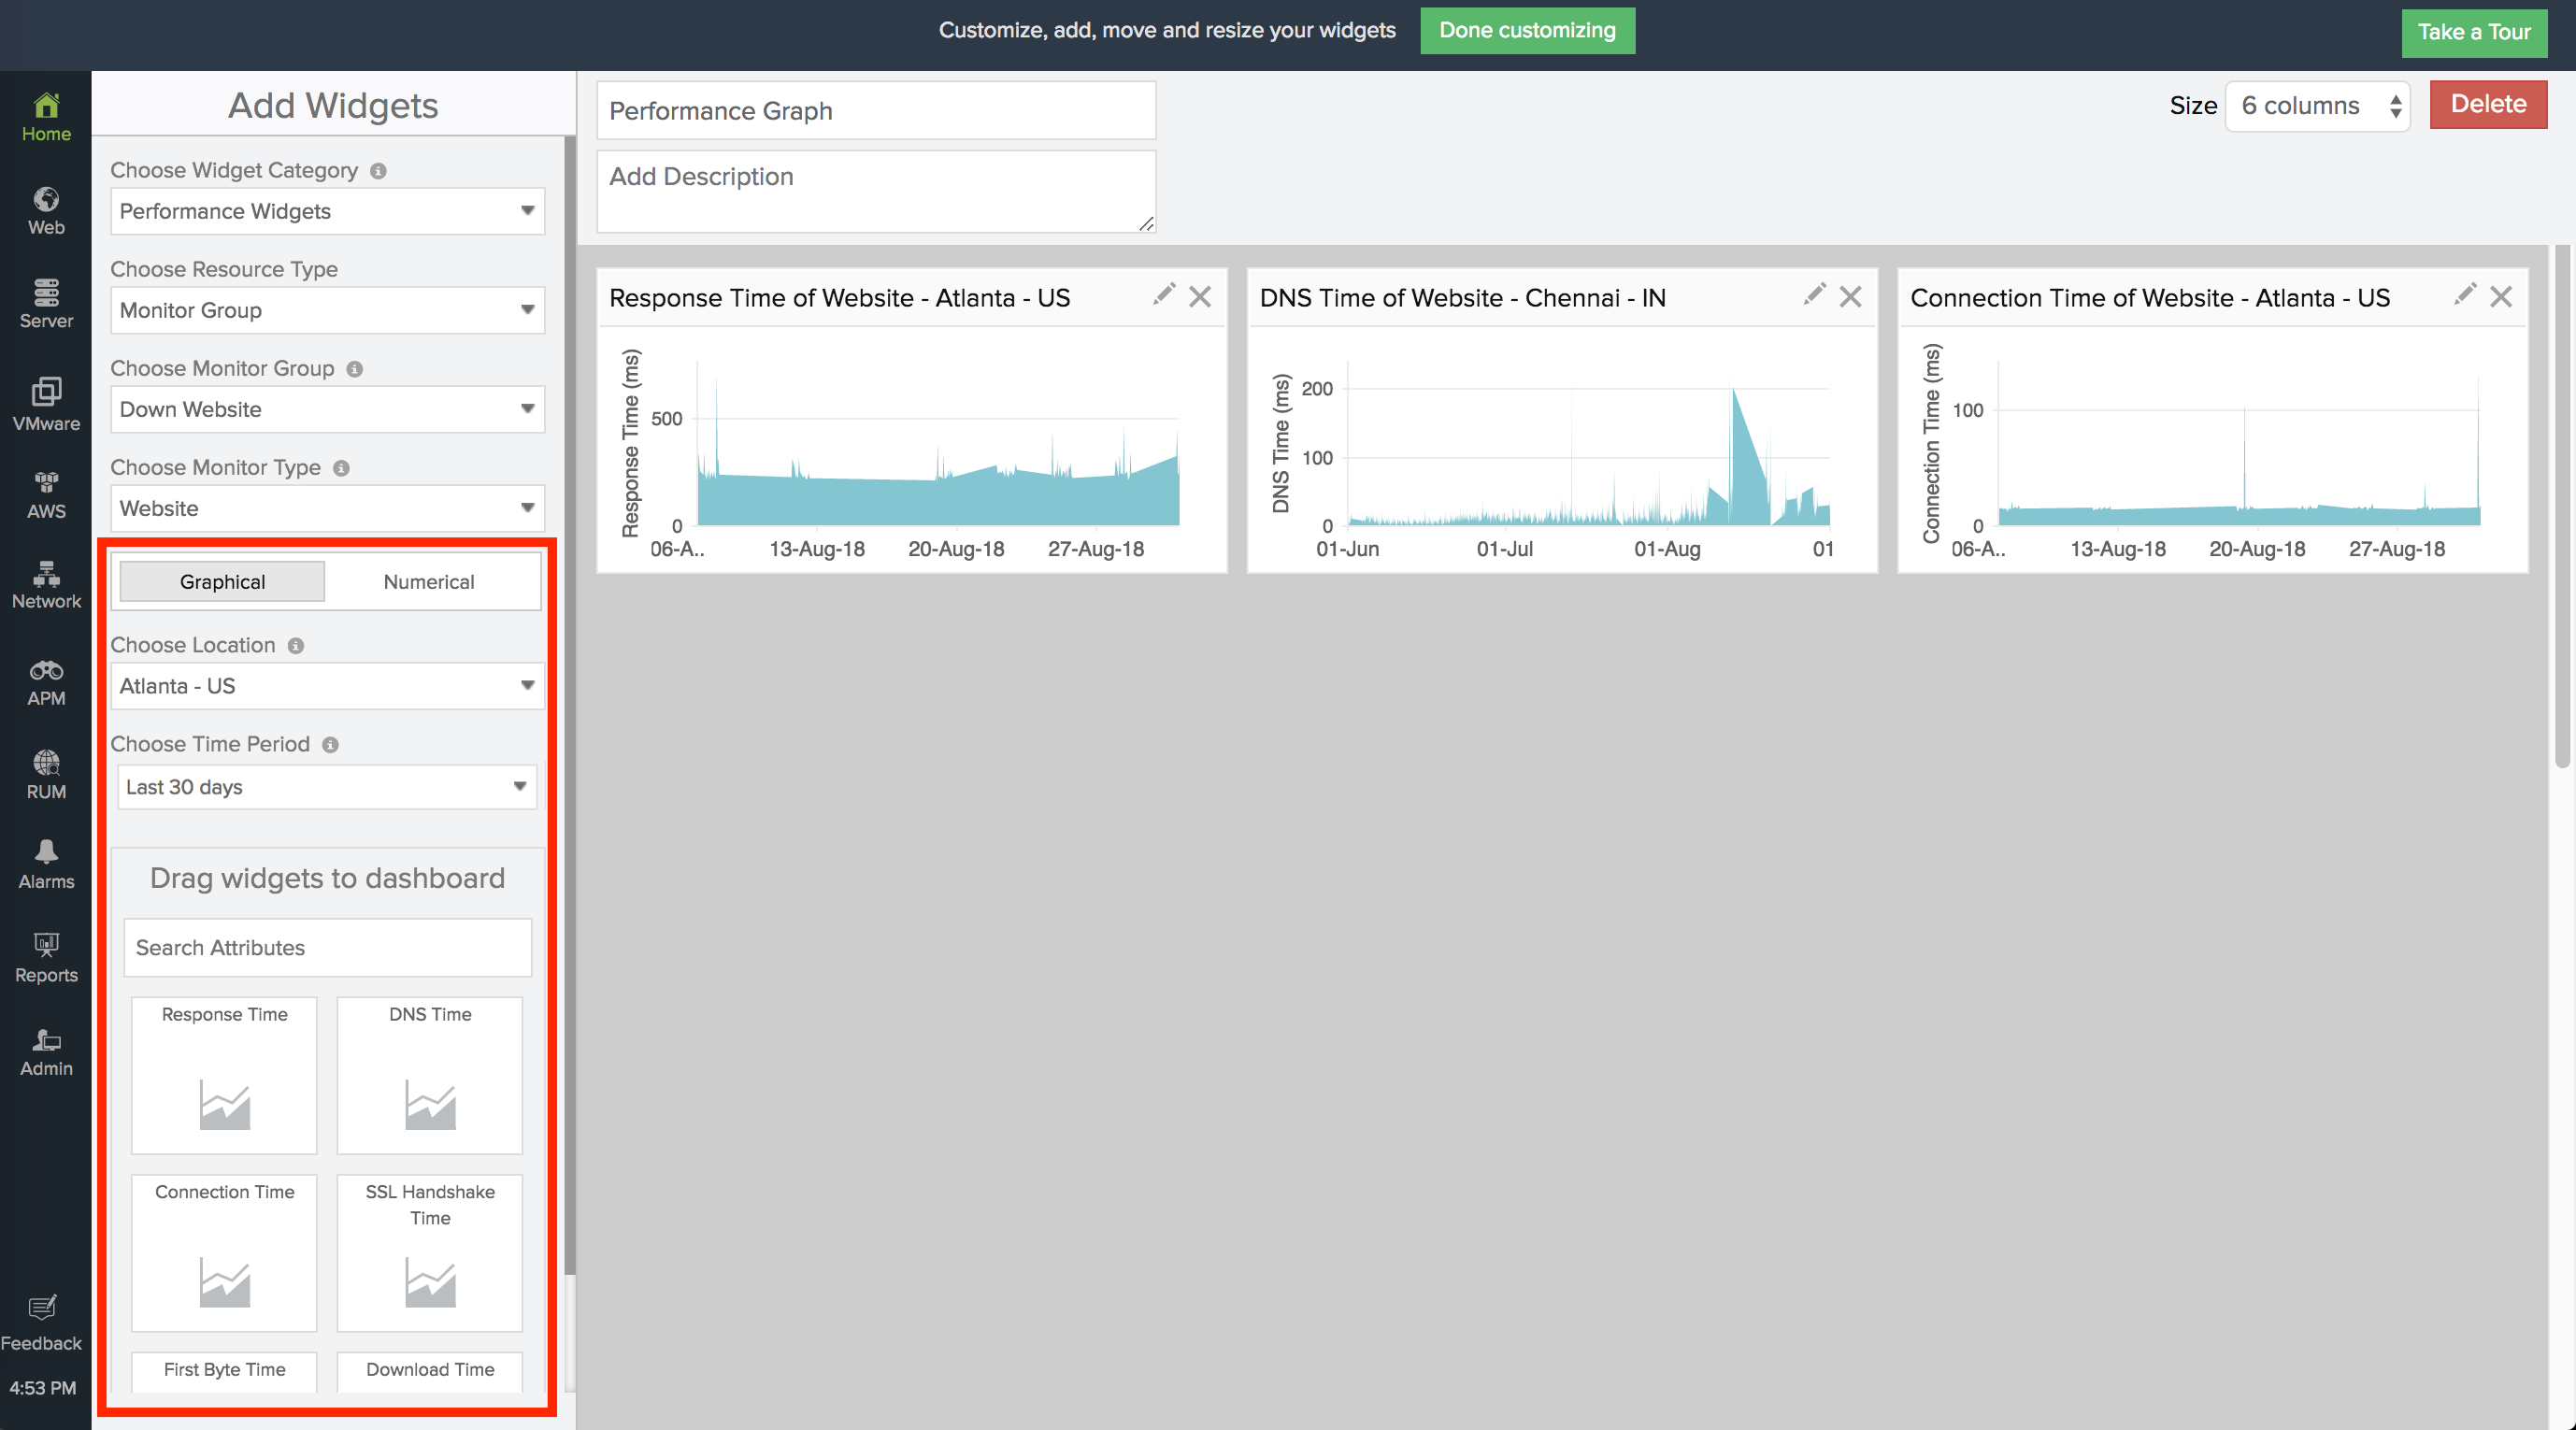
The widget renders the average archived data of all the monitors of a selected monitor type in that group for the defined time. You can also pick a monitoring location and search for an attribute widget view from a list of available attributes for that monitor type. Once the dashboard gets published, the data in the widget gets auto-refreshed every hour. Please refer our user documentation to learn more about these updates.
Regards,
Abhiram
Hello there,
We've made some minor configuration enhancements to the Top N Widget set up process in Custom Dashboards. You can now view and compare the Top 5, 10, 20, or 25 performance values of monitors (of a selected monitor type) in a specific monitor group or your global account for a selected time span. Based on the chosen monitor metric, it'll render the worst performing metric values on the top and the best performance values towards the bottom of the bar graph. You can refer our help doc to learn more about the widget configuration enhancements.
Regards,
Abhiram
Hello,
We’re excited to announce the addition of a brand-new Inventory Details widget for AWS monitors, as well as the inclusion of child entity filters in Performance and Current Status widgets of Custom Dashboard.
AWS Inventory Details Widget
You can gather account-wise or resource-wise split up of your AWS resource inventory inside your inventory details widget. Here're the four kinds of inventory widgets:
Account-based split up:
- Region Distribution Map: You can visualize your AWS services based on the AWS regions.
- Region Distribution Count: You can view the total number of monitored AWS resources and the region-based service count split-up data in a numerical widget.

Resource-based split-up:
- Monitor Count (Numerical): You can visualize the region-based service distribution split-up data in a table.
- Monitor Count (Bar Chart): You can view how the different AWS services have been operating during a selected time range.
Child Entity widgets in Performance and Current Status Widget
You can now visualize the child entity metrics of specified monitor types in numerical or graphical performance widget. Also, view the real-time status of child entities of your configured Server and Network Monitors.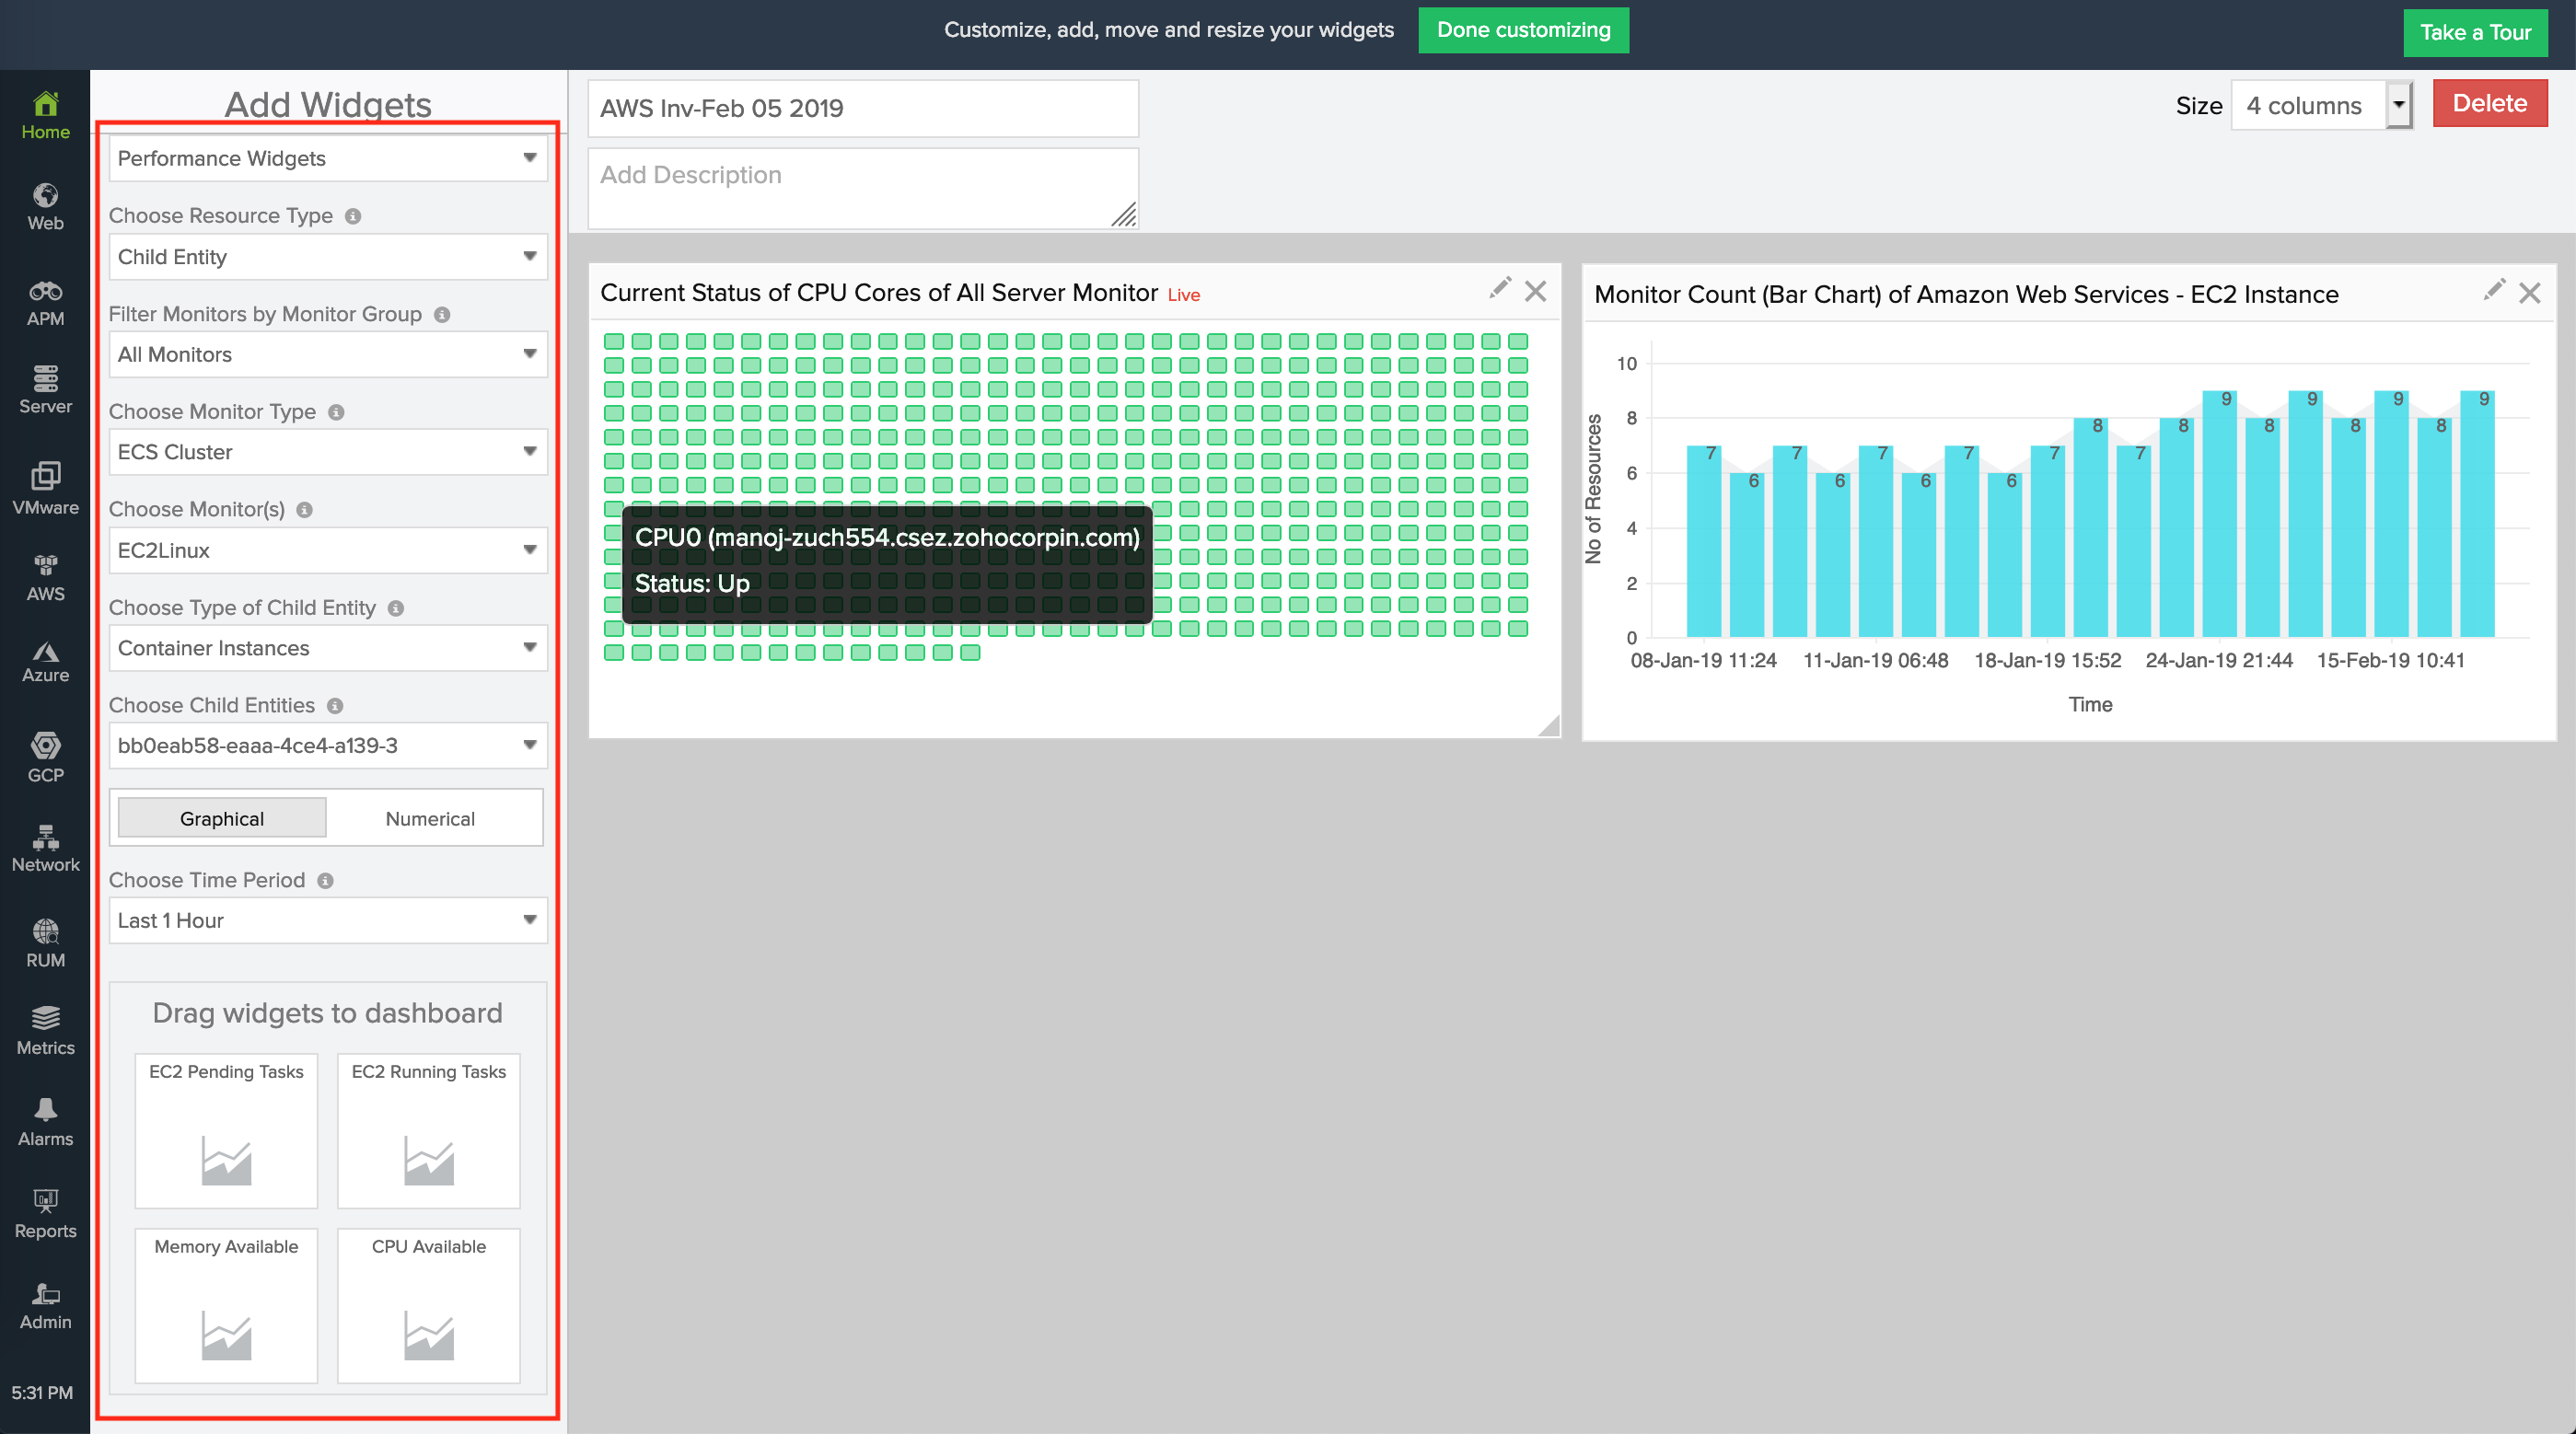
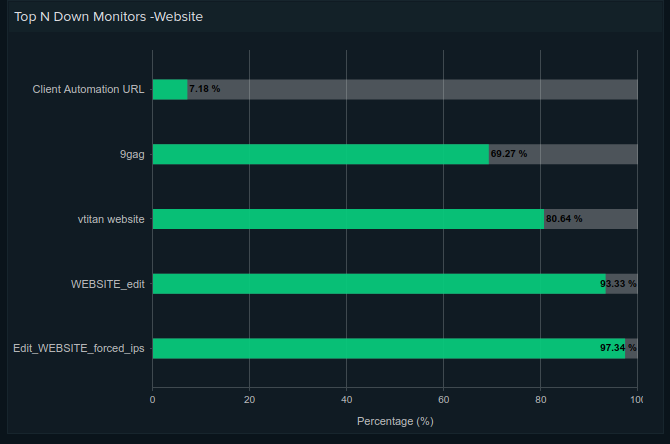
Top N Availability Widget in Custom Dashboard:
In addition to the Top N Performance widget, you can now drag-drop Top N Availability widget while creating your own dashboard(s).
The Top N Availability widget lists the Least 5, 10, 20, or 25 monitors and their availability percentage (from low to high). The widget lets you quickly identify the top monitors that are Down in an account, a particular monitor type, or monitor group.
Read our help documentation to learn more. Please comment in the below thread for any queries, if any.
Hello, in the TOP N Widget, is possible to create one for top used disc space?