Three ways to debug IIS web server failures using logs
Unresponsive and slow pages are both terrible for any website. Even with the best user interface (UI), unresponsive and slow pages negatively affect the customer experience and the brand's reputation.
Research from the Nielsen Norman Group has determined that the average user will leave a site after about 10 seconds of waiting for a page to load. If your page takes longer than a few seconds to load, it's time you check your IIS server logs. Let's dive in to the what and why of IIS server logs so you can approach and debug your page loading issues easily.
Everything gets captured
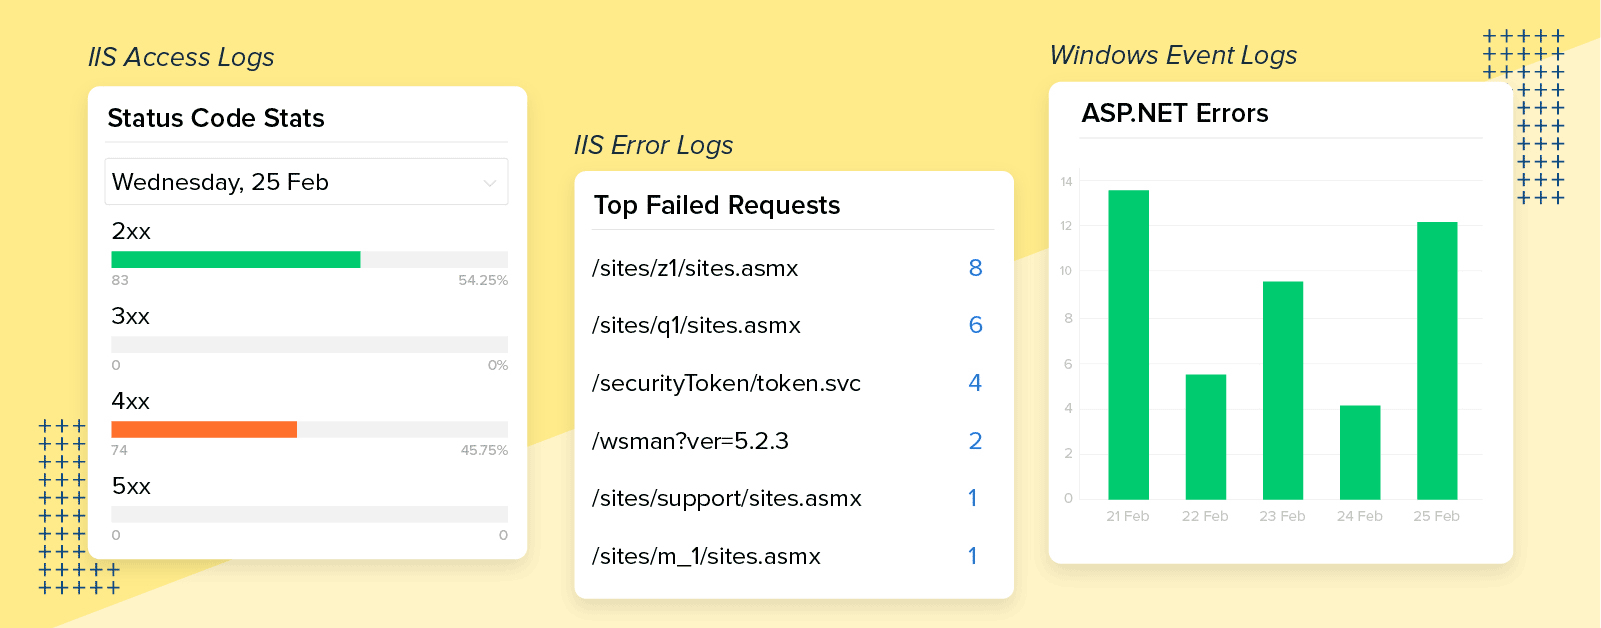
As we all know, Internet Information Services (IIS) is the native webserver for hosting websites on Windows platforms and is comprised of several components to effectively handle requests. From a DevOps view, the most useful output comes from the logs that IIS generates. IIS access logs in particular capture all kinds of access to a web application including page visits, client IPs, browsers (both type and version), response times, error requests, and traffic.
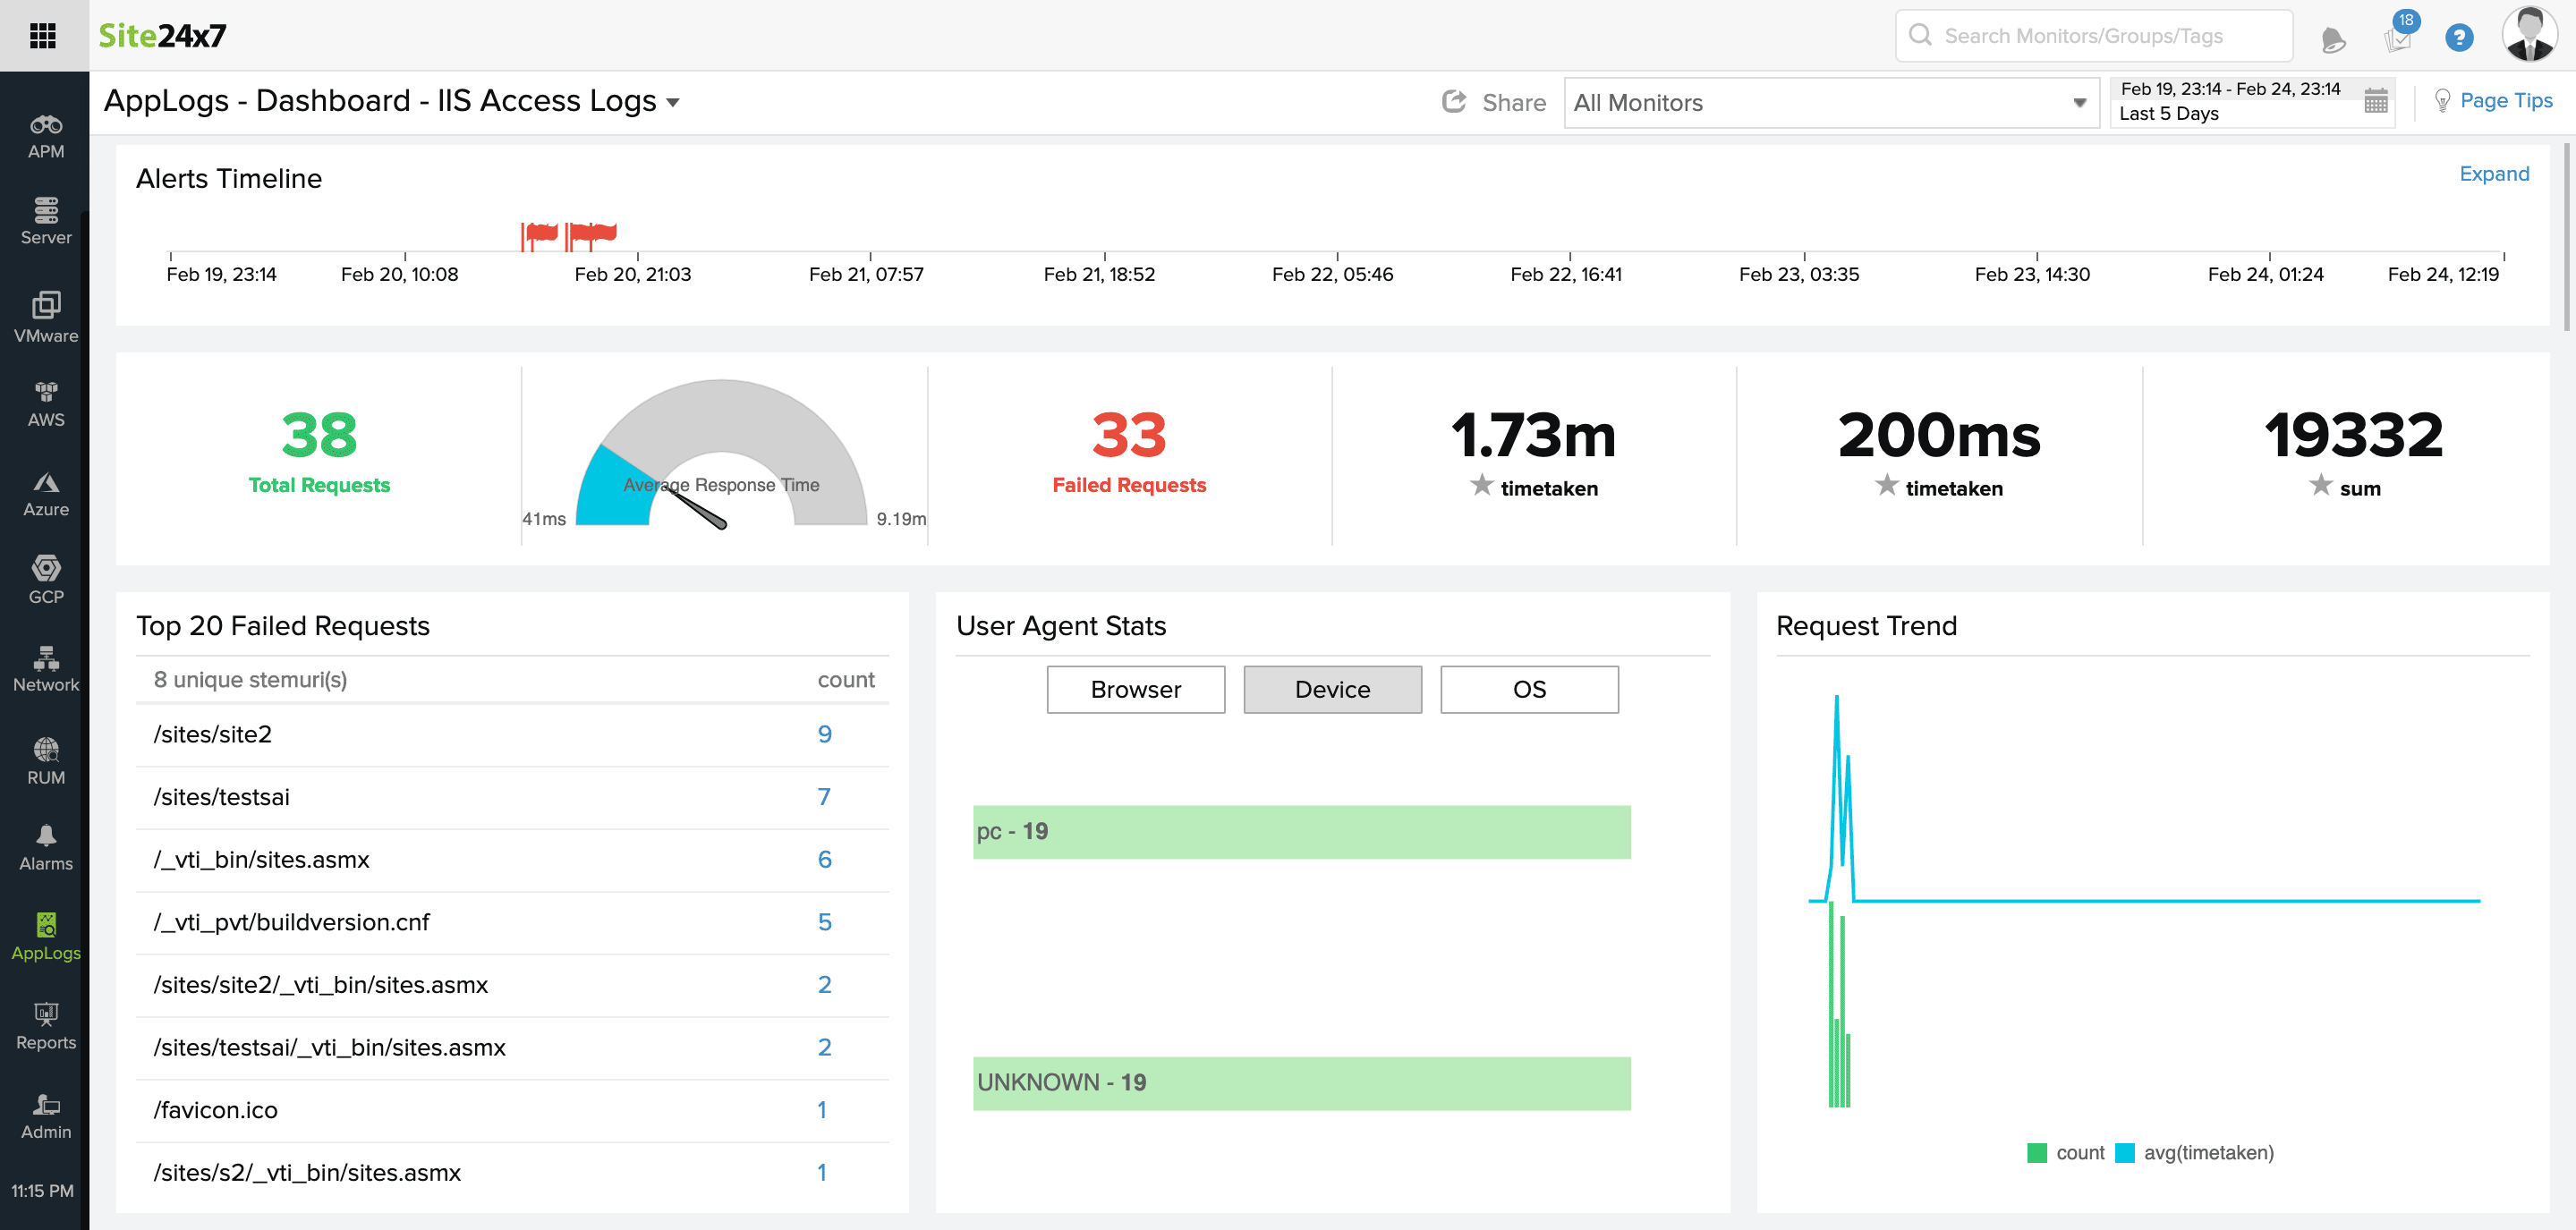
1. IIS access logs
i. Is your page still loading?
High response time is the most common indication that there is a bottleneck throttling website performance. IIS handles a huge number of requests by queuing them in the respective application pools, and when some requests take too long, it will increase the wait time for other requests. If the request queue becomes full, then there is a high chance that the server itself will become unavailable.
This is why it's vital to optimize the response time of the whole website in order to maintain high availability. In this case, IIS access logs are your go-to, as they keep track of the final response time, which is helpful when debugging URLs that are slow and need to be optimized.
ii. What went wrong with your site?
A small error in a webpage is capable of significantly degrading the end-user experience. When a URL fails, IIS on an average takes around 30 to 120 seconds to send a connection time-out message, during which time impatient users will leave and more patient users will keep retrying for the response.
A typical 4xx/5xx error can degrade customer trust quickly. IIS access logs provide a quick overview of URLs, allowing you to trace the sequence of the URLs accessed and the relevant browser information necessary to reproduce issues locally and fix them. For instance, when your page is not loaded and throws an error code of 400, you can find out from the IIS access logs that it is a bad request error and the page hasn't been accessed.
Check this video to learn how to use AppLogs query language search to get insights from IIS access logs.
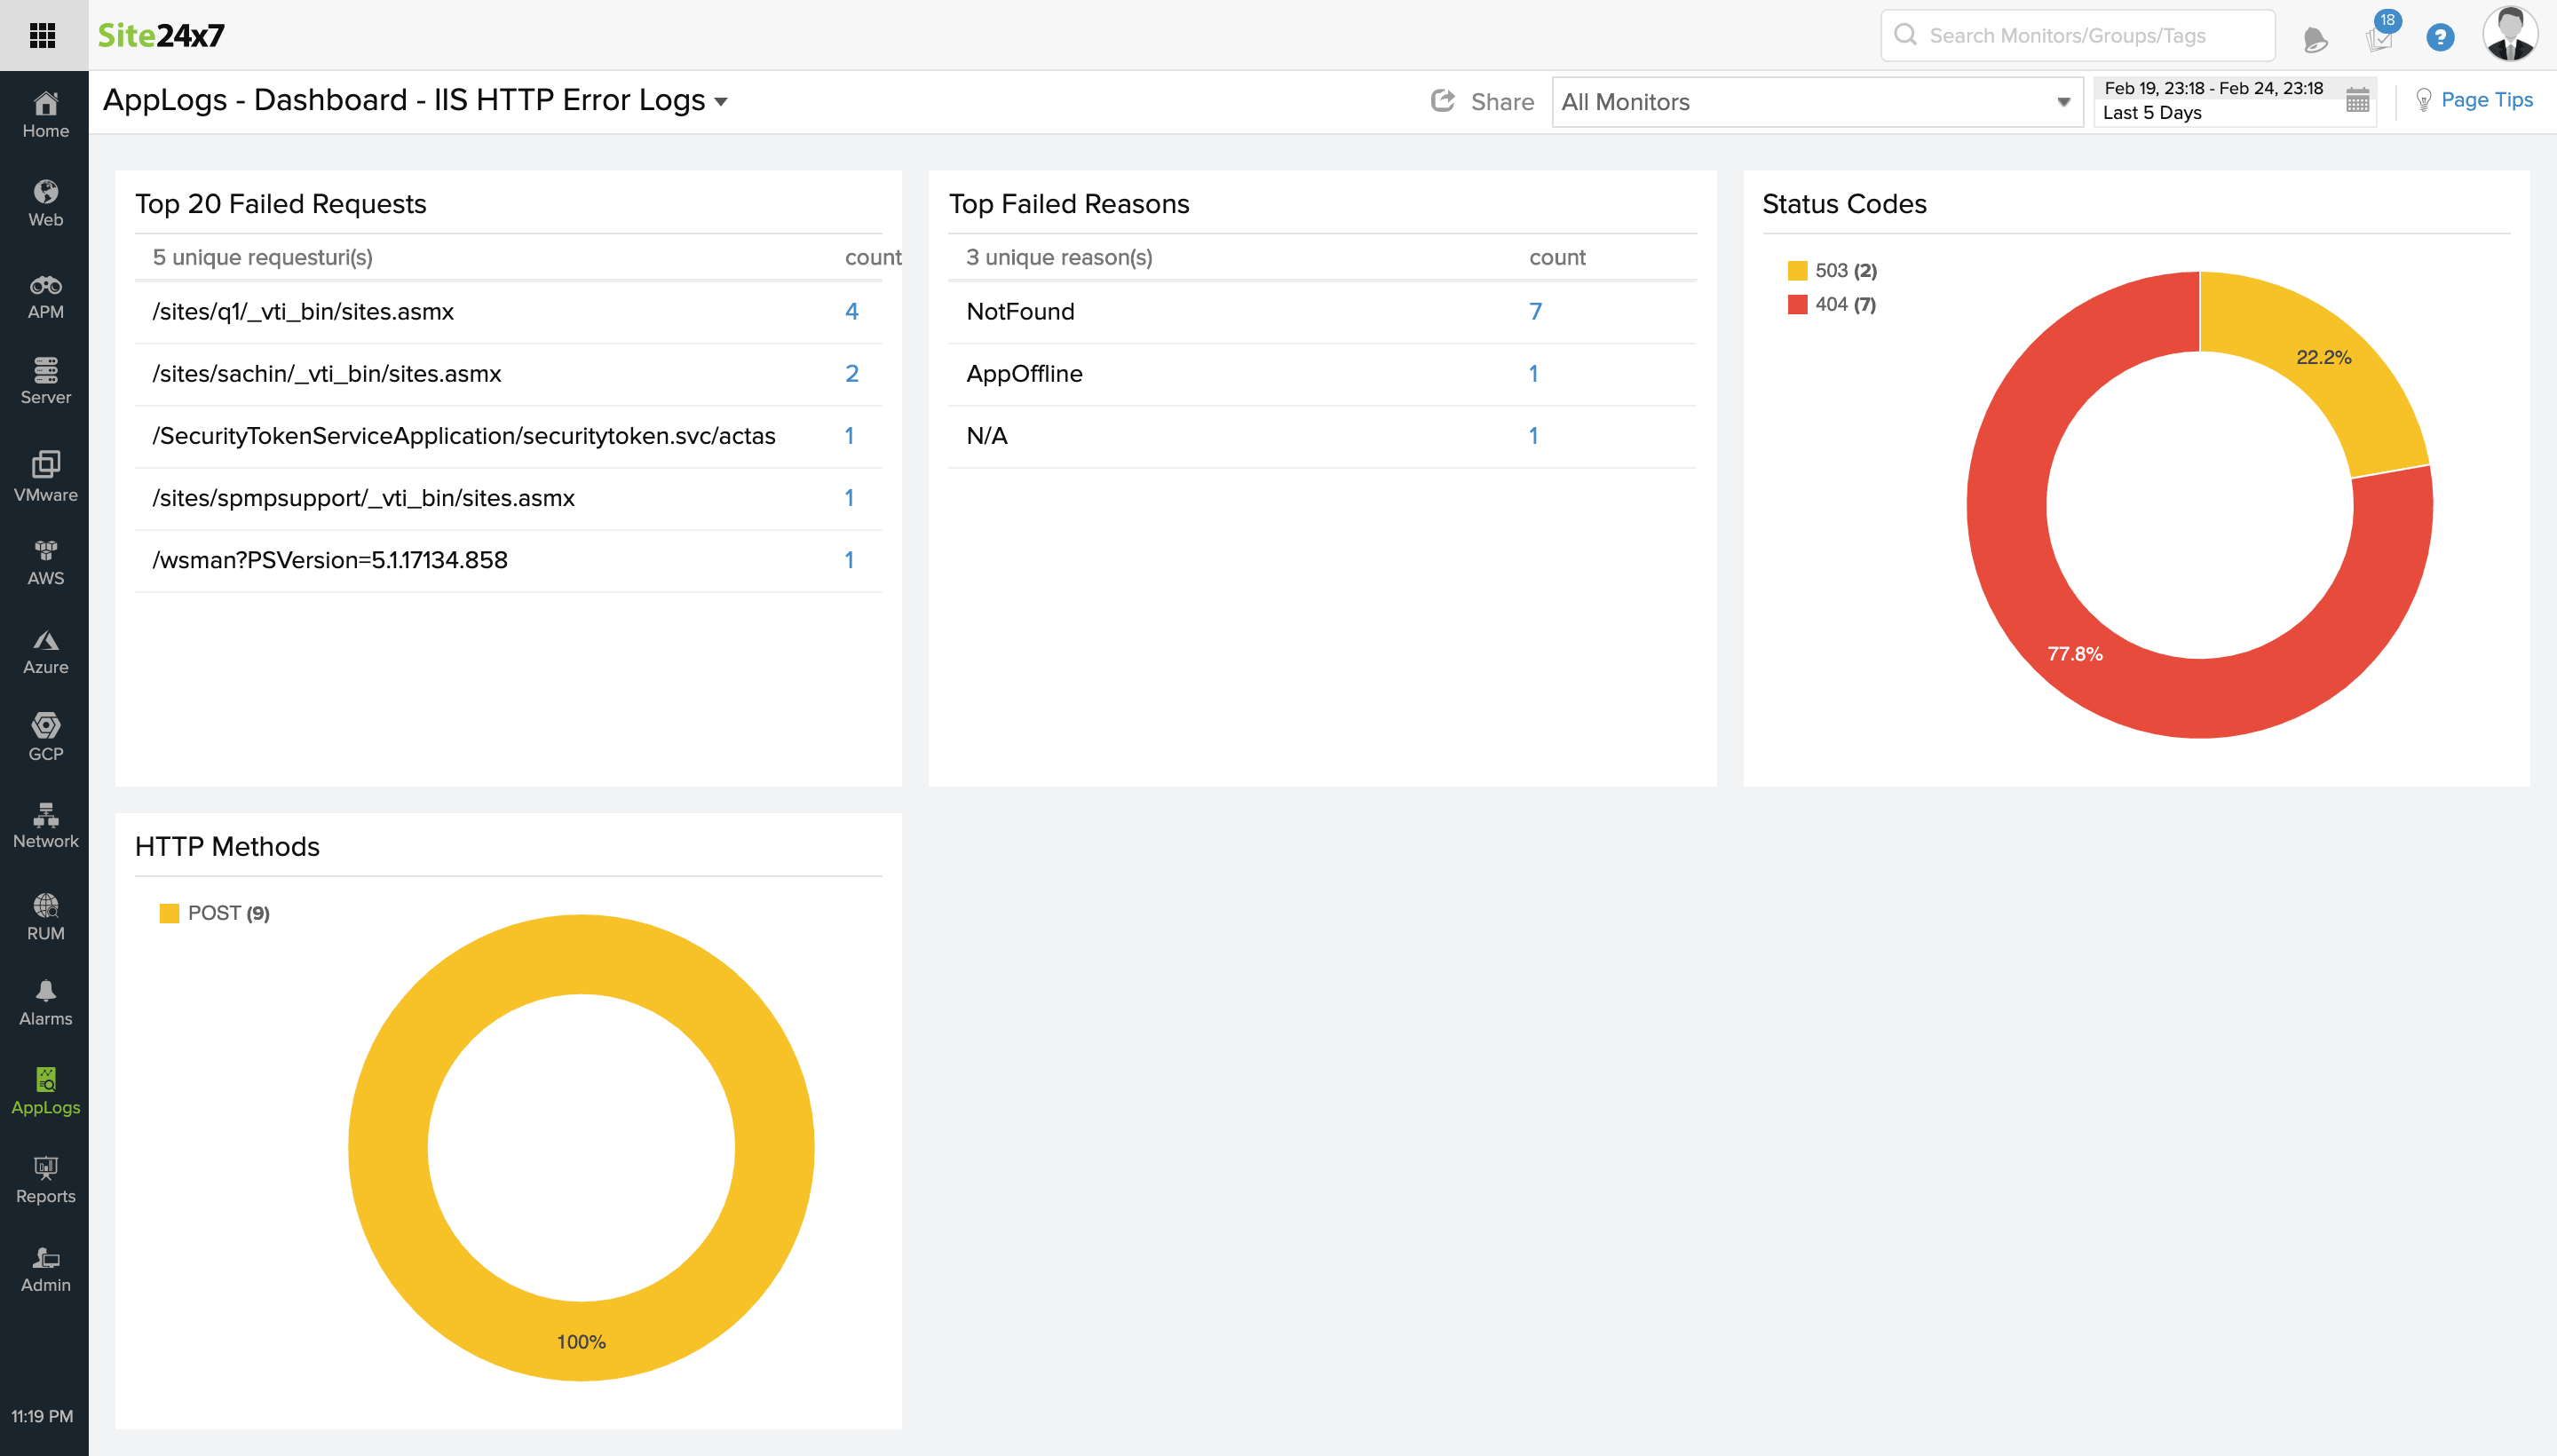
Still no help?
Have all your attempts to debug issues from the IIS access logs ended in vain? Though IIS access logs work the best in identifying problematic URLs, deep diagnosis requires contextual information like request parameters, form data, cookies, modules loaded, and problematic modules.
HTTPERR, the IIS error log, stores all the information related to IIS errors such as the requests that weren't made, idle IIS servers, disabled services, forbidden severs, and more. Considering the example of error 400 mentioned in the previous section, though it's a client error response, the issue can be anywhere on the client-side or server-side.
IIS error logs can identify the exact point of an issue such as invalid data parsed, incorrect data parsed like a wrong URL, corrupted data, or duplicate cookies. You can also analyze error logs from different servers that run the application in production.
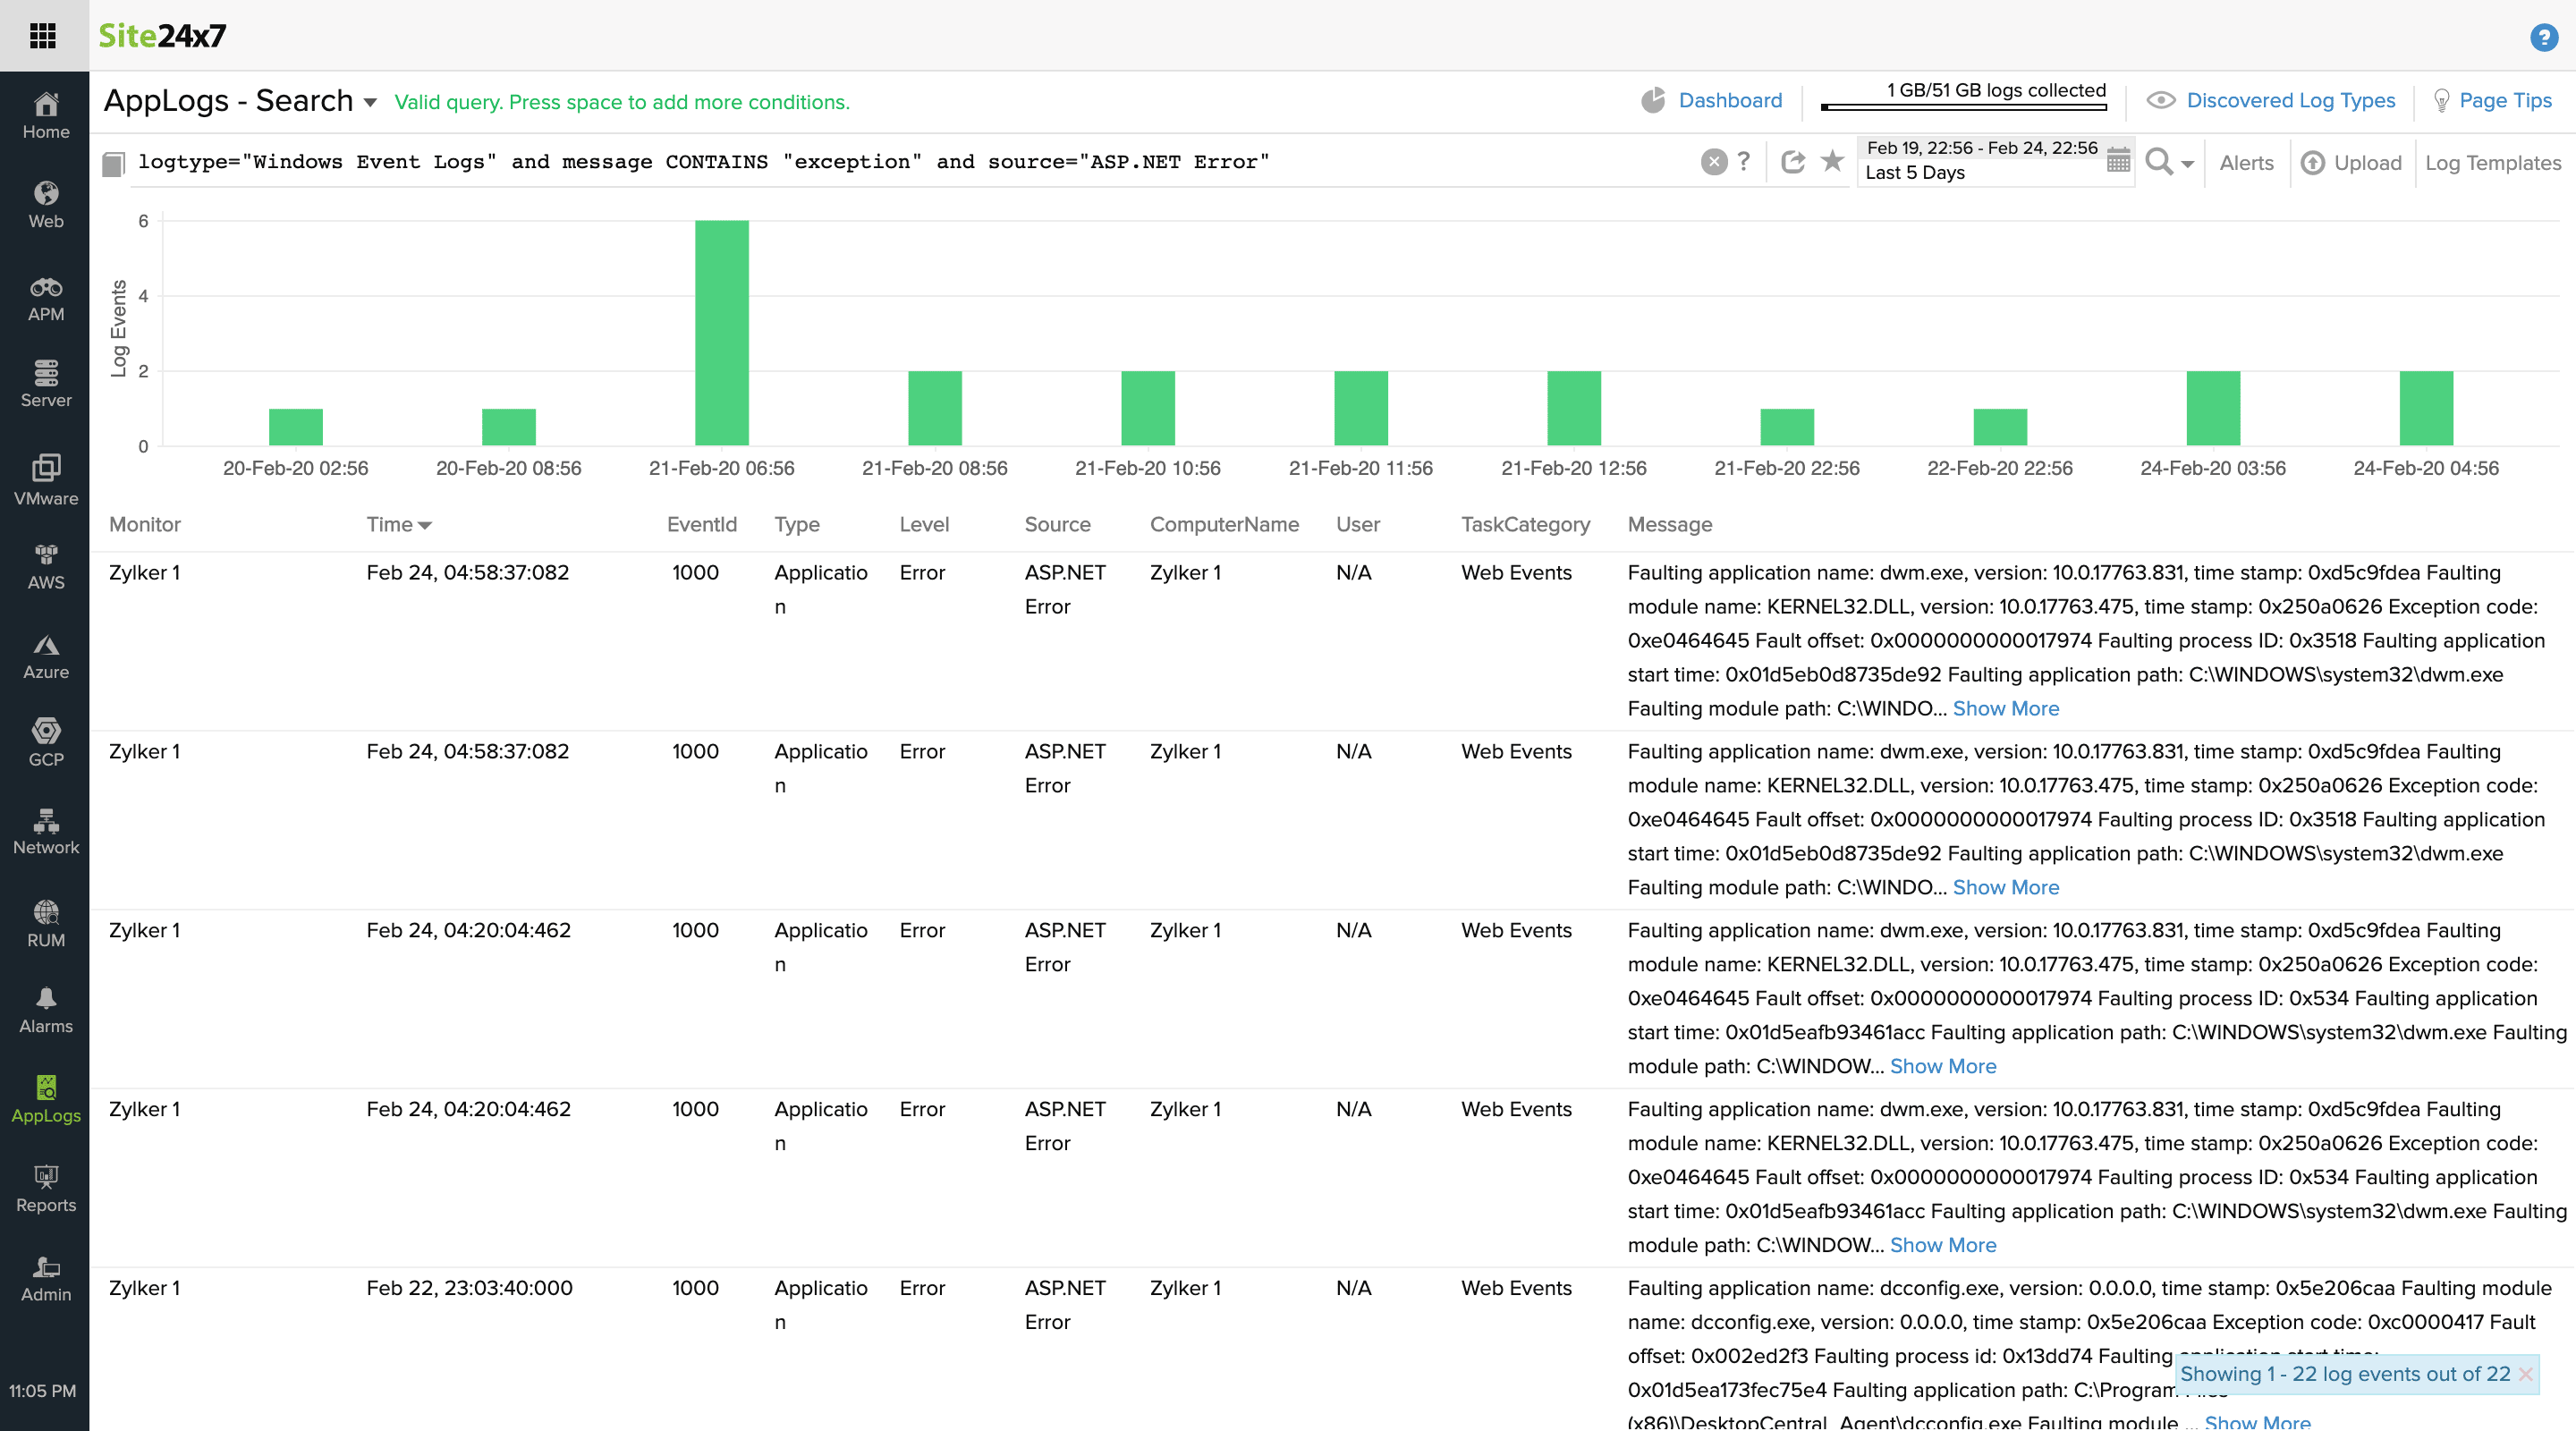
3. IIS-related Windows event logs
Crack the exact issue
Windows Event logs capture a lot of details about the error, and present a quick trace of the root cause, whether it's a full memory, CPU, or stack-overflow error, or even a third-party module that crashed your application. IIS access logs enable you to identify the problematic URLs, and error logs provide the context of the error. With the timeline and context provided by these two types of logs, and after filtering out the event logs, you'll be able to narrow down the root cause of the issue quickly. This means for the 400 error, you can identify the root cause using Windows Event logs.
You can also work the other way around. Start filtering out event logs, and build context by searching through the access and error logs in order to reproduce an issue and fix it. The former is effective in identifying the overall areas of improvement, while the latter is a remedial measure to provide quick fixes.
Simplify debugging
Manual debugging from different logs is time-consuming and tedious, but a comprehensive log management tool can make it easy.
Complimenting log management is an Application Performance Monitoring (APM) solution which can consolidate the available access log information like response time, throughput, etc., and correlate it well with the information available in the event logs like the stack trace, error codes, etc. APM solutions offer continuous monitoring and thus, issues and their root causes can be identified instantly. Having a log management tool that can integrate well with APM solution, i.e., one which allows querying traces of slow transactions and exceptions, will be a great boost to DevOps productivity.

A good log management tool should offer the following features:
- Collection and consolidation: Collect logs from different applications, servers, and log frameworks, and consolidate them for easy analysis.
- Indexing: Index the logs for a quicker search.
- Simple search: Leverage easy-to-search methods like query language search.
- Save the search: Save searches for future reference.
- Alerts: Save search queries and configure alerts based on these searches.
- Storage: Store the collected logs for future reference and analysis.
- Holistic view: A consolidated, intuitive dashboard to view everything in one place.
- Organized metrics: View top failed requests and errors for a quick overview.
Site24x7 AppLogs is a log management and analytics module that can help you manage your logs from different environments with all the above-mentioned features. Try our 30-day free trial, now!
You may also be interested in:
- Everything you need to monitor a website
- Application Performance Monitoring: Trends to Watch Out in 2020
The above ways to debug IIS web server failures using logs are given nicely and are very resourceful.