10 filter patterns that are helpful for managing your logs

Log files, which are the records of everything that has happened in your server, application, or framework, are generally unfiltered and huge. Going on for pages, these plain text files are packed with tons of information and are the initial go-to place for any troubleshooting. However, the challenge lies in reading, understanding, and interpreting log files, and ultimately pulling out the right piece of information required for analysis.
Log management and log parsing tools make this job easier, as they filter out the required details and provide you with what we are looking for, but it's up to the user to give the right query and fetch the right results. There are multiple kinds of operators that can be used in a query; however, using only one simple operator might not help for complex scenarios. Here's where filter patterns, which combine operators, are useful. Below is a list of common and useful filter patterns that can be used in queries, along with use cases.
-
Identifying the cleared audit logs in Windows event logs
Pattern: and, contains
Consider a scenario when you need to filter out the log lines where your audit logs are cleared in Windows event logs. You can use this query:logtype="Windows Event Logs" and level contains "Information" and the message contains "The audit log was cleared"Here, and is used to filter both the conditions like information and message, whereas contains can fetch you the exact message. -
Ignore health checks for ELB
Pattern: and, !=
To ignore health checks in an Internet Information Services (IIS) environment, you can use:logtype="IIS Access Logs" and useragent!="ELB-HealthChecker/1.0" and useragent!="ELB-HealthChecker/2.0"Here, != is not equal to, which means filtering out those lines where the condition does not satisfy both elastic load balancing (ELB)-HealthChecker/1.0 and ELB-HealthChecker/2.0. -
Identify application crash in Windows event logs
Pattern: or, or
To identify what all applications crashed in your Windows server, you can use the below query. The pattern in this query lets you to filter out multiple event IDs that denote an application crash.logtype="Windows Event Logs" and (eventid="1000" or eventid="1002" or eventid="1001")Event ID 1000, 1001, or 1002—all of these denote a hung or crashed application, hence or can be used.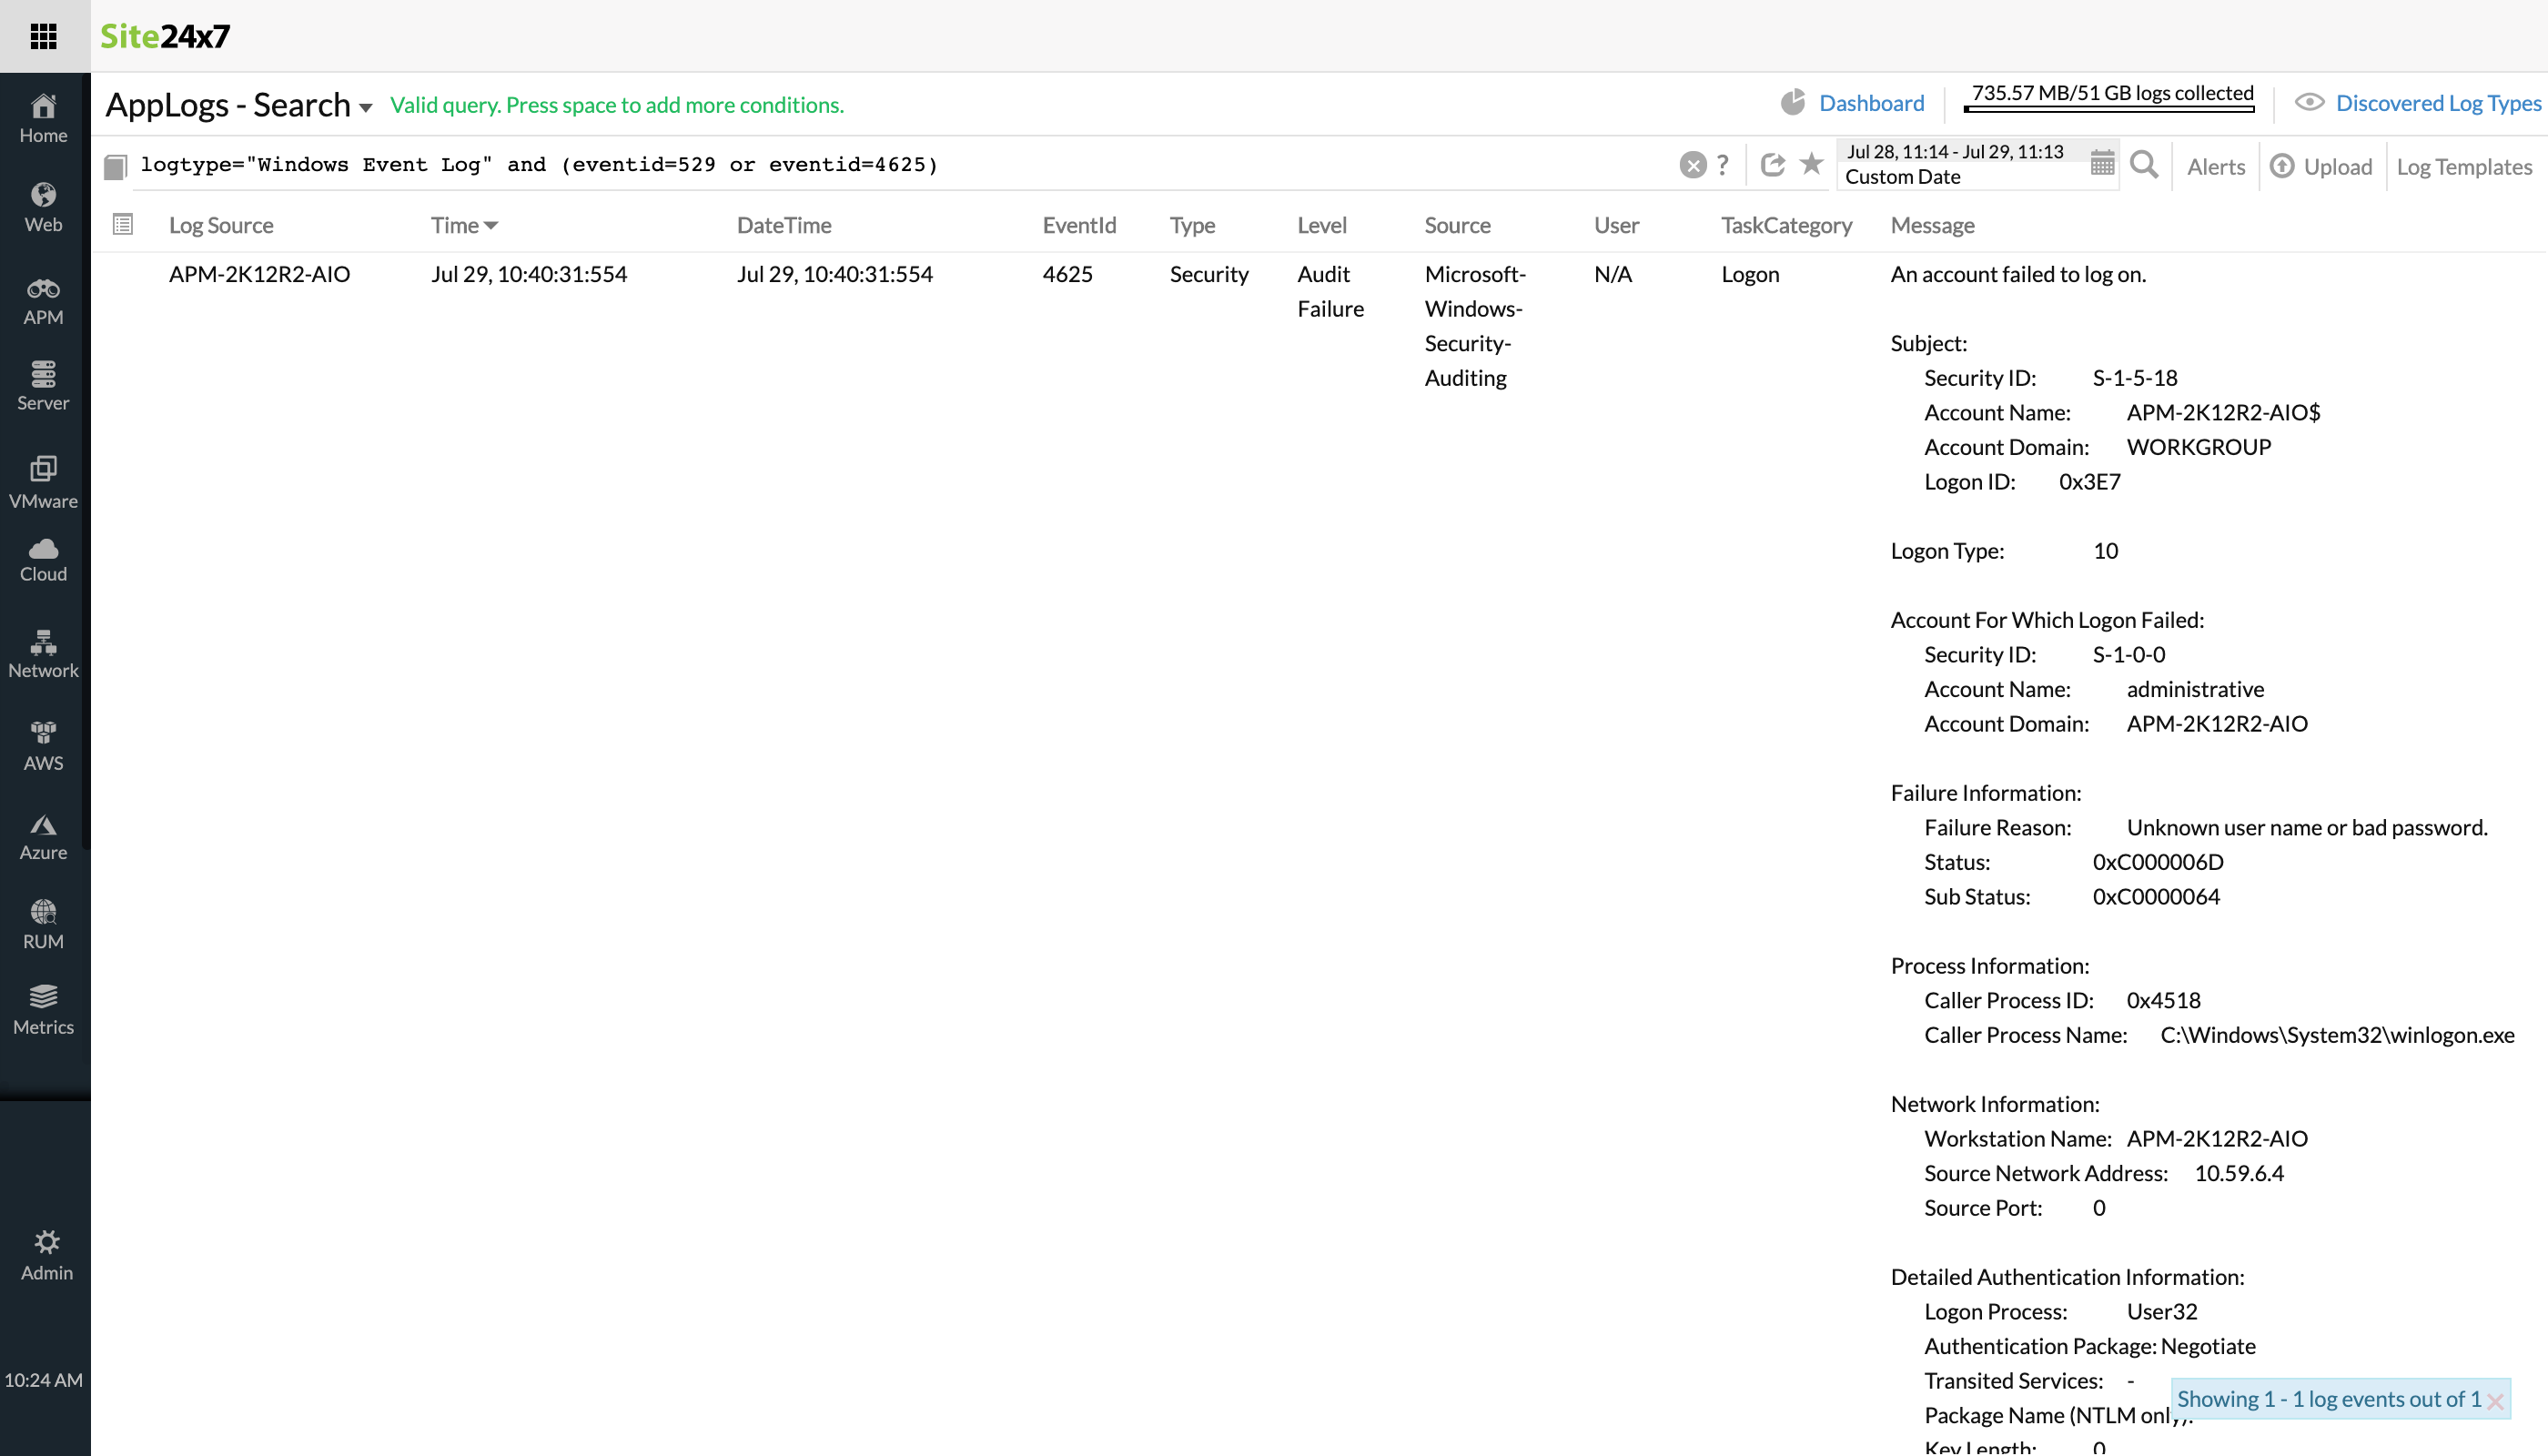
-
Ignoring a few events from AWS CloudTrail logs
Pattern: and, or, !=, contain
Queries are often complex when there are multiple conditions. You may want the log line to contain some messages while ignoring others. There may also be times when you want to capture either one of two events, and have a third part be mandatory. Here's an example of an Amazon Web Services (AWS) events with such a complex scenario:logtype="CloudTrail Logs" and eventname!="CreateLogStream" and eventname!="CreateNetworkInterface" and (eventname contains "Create" or eventname contains "Write")In this CloudTrail Logs scenario, != is used when a particular event doesn't need to be included. At the same time, either Create or Write is a mandatory case. -
Checking the average time taken for a particular URL in IIS access logs
Pattern: and, !=, contains, avg
Similar to the above case, this pattern is useful when your filter has to include an average duration along with the above scenario.logtype="IIS Access Logs" and useragent!="ELB-HealthChecker/1.0" and useragent!="ELB-HealthChecker/2.0" and stemuri contains "/get_usage_info/" avg(timetaken)To find the average time taken in an IIS access log for a particular URL, and the stemuri contains the specified message, the above query can be helpful. -
Obtaining aggregate values for IIS access log queries
Pattern: timeslice, min, max, avg
Using timeslice generates a table of the selected total time period for the query, divided by slices of time specified in the query versus the count of log entries. When it's used with min, max, and avg, it generates a table for all these values for the specified time.logtype="IIS Access Logs" and monitor_name=" Server" AVG(timetaken) MIN(timetaken) MAX(timetaken) timeslice 15mIn this IIS access log, the average, minimum, and maximum time taken values at every 15 minute interval will be represented as a table. Check this video to learn how to use AppLogs query language search to get insights from IIS access logs. -
Filtering the non-bot IP access from Apache Access logs
Pattern: !=, count_distinct, timeslice
When you want unique, distinct values sliced by time, count distinct and timeslice are useful. When used in a query, count distinct fetches only the number of the distinct values.logtype="Apache Access Logs" and useragent !="bot" COUNT_DISTINCT(remotehost) timeslice 1hConsidering a simple use case of Apache access logs where you need to filter the non-bot IP access per hour, the above query can be used.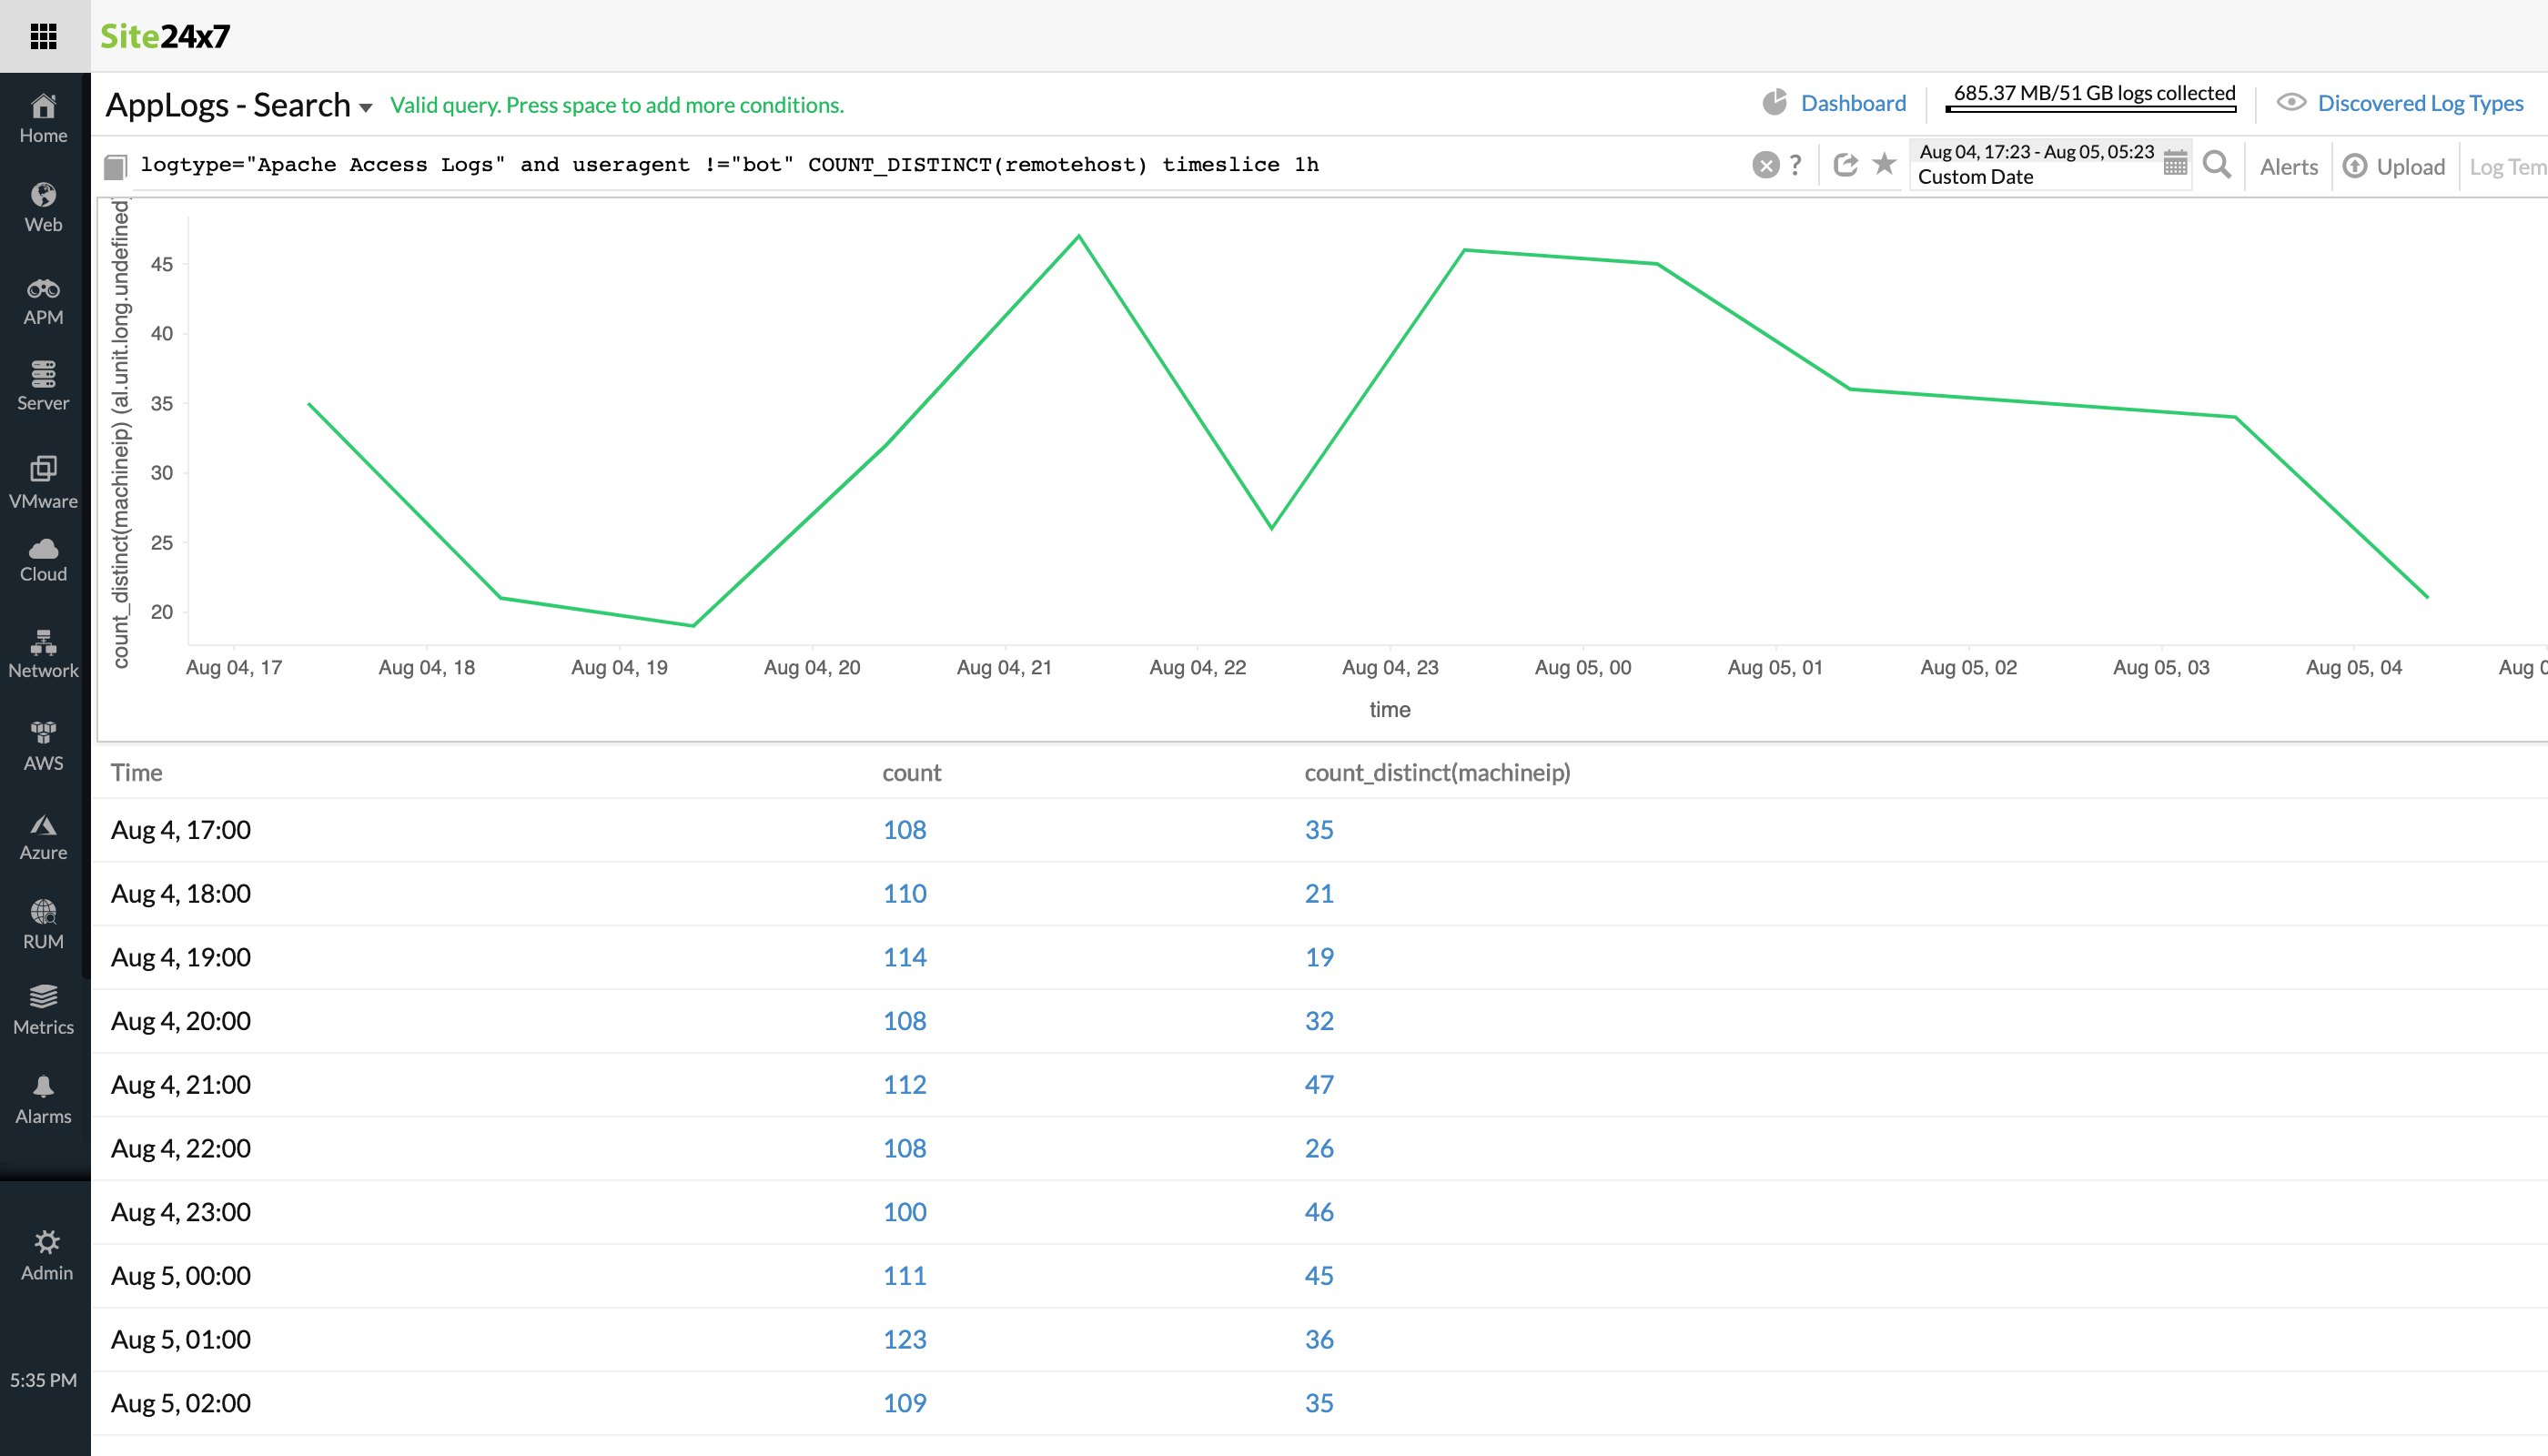
-
Filtering out a site from the CloudTrail logs
Pattern: and, !=, groupby
Groupby shows the number of entries with the same value for the provided field. To combine a few conditions and group them, consider the below use case of AWS logs.logtype="CloudTrail Logs" and eventsource != "ssm.amazonaws.com" and eventsource != "logs.amazonaws.com" and eventsource!="config.amazonaws.com" groupby useridentity_principalid,eventsourceFrom AWS CloudTrail logs, you can remove a site that doesn't need to be included using !=, combine similar conditions using and, and group them by useridentity_principalid,eventsource. -
Obtaining user sign-on stats from AWS logs
Pattern: !=, contain, groupby, timeslice
To group a set of fields and slice the results based on time, this pattern can be used.logtype="CloudWatch Logs" = and eventsource CONTAINS "signin.amazonaws.com" groupby useridentity_principalid timeslice 1dTo obtain the user sign-on stats in AWS CloudWatch logs, you might need the details from certain sources alone and they must contain signin.amazonaws.com. To group them based on the useridentity_principalid and view the results on a daily basis, the above query can be used. -
Identifying unique failed request IPs of range 500 in Nginx logs
Pattern: >=, <=, groupby
Error codes greater than or equal to certain values may not be a positive sign in production environments. Grouping them will provide insights on what has gone wrong, for which the below query can be used:logtype="Nginx Logs" and status>=500 and status<=599 and vhost="zylker_1200" groupby xforwardedforGrouping results based on forwardedfor in a particular virtual host whose statuses are between 500 and 599 will help to identify unique failed request IPs of range 500.
In addition to the above examples, you can also coin your own patterns using different operators based on your use cases. These can make your query language search and log analysis easier and more thorough.
AppLogs is Site24x7's log management solution that collects, consolidates, indexes, and analyzes logs from different applications, servers, frameworks, and the cloud. AppLogs also lets you save queries, create alerts based on them, and view your results on intuitive dashboards. Try Site24x7 for log management now!