Here at Site24x7, we constantly evaluate and refine our control panel, dashboards, and reports with the intention to bring about an exceptional user experience. We recently launched a free demo account, upgraded our control panel's performance, and introduced a slew of new features and enhancements. Let's delve into these releases in detail.
- Launch of Site24x7 demo account
- Enhanced status and license widget bar
- Custom Dashboard: Multi-Monitor Performance Widget and Iframe widget added
- Site24x7 Control Panel: Perform bulk actions in the background
- New time periods in Site24x7 reports
- Handling report parameters in the URL
- Enhancement of OpsGenie integration
Launch of Site24x7 demo account
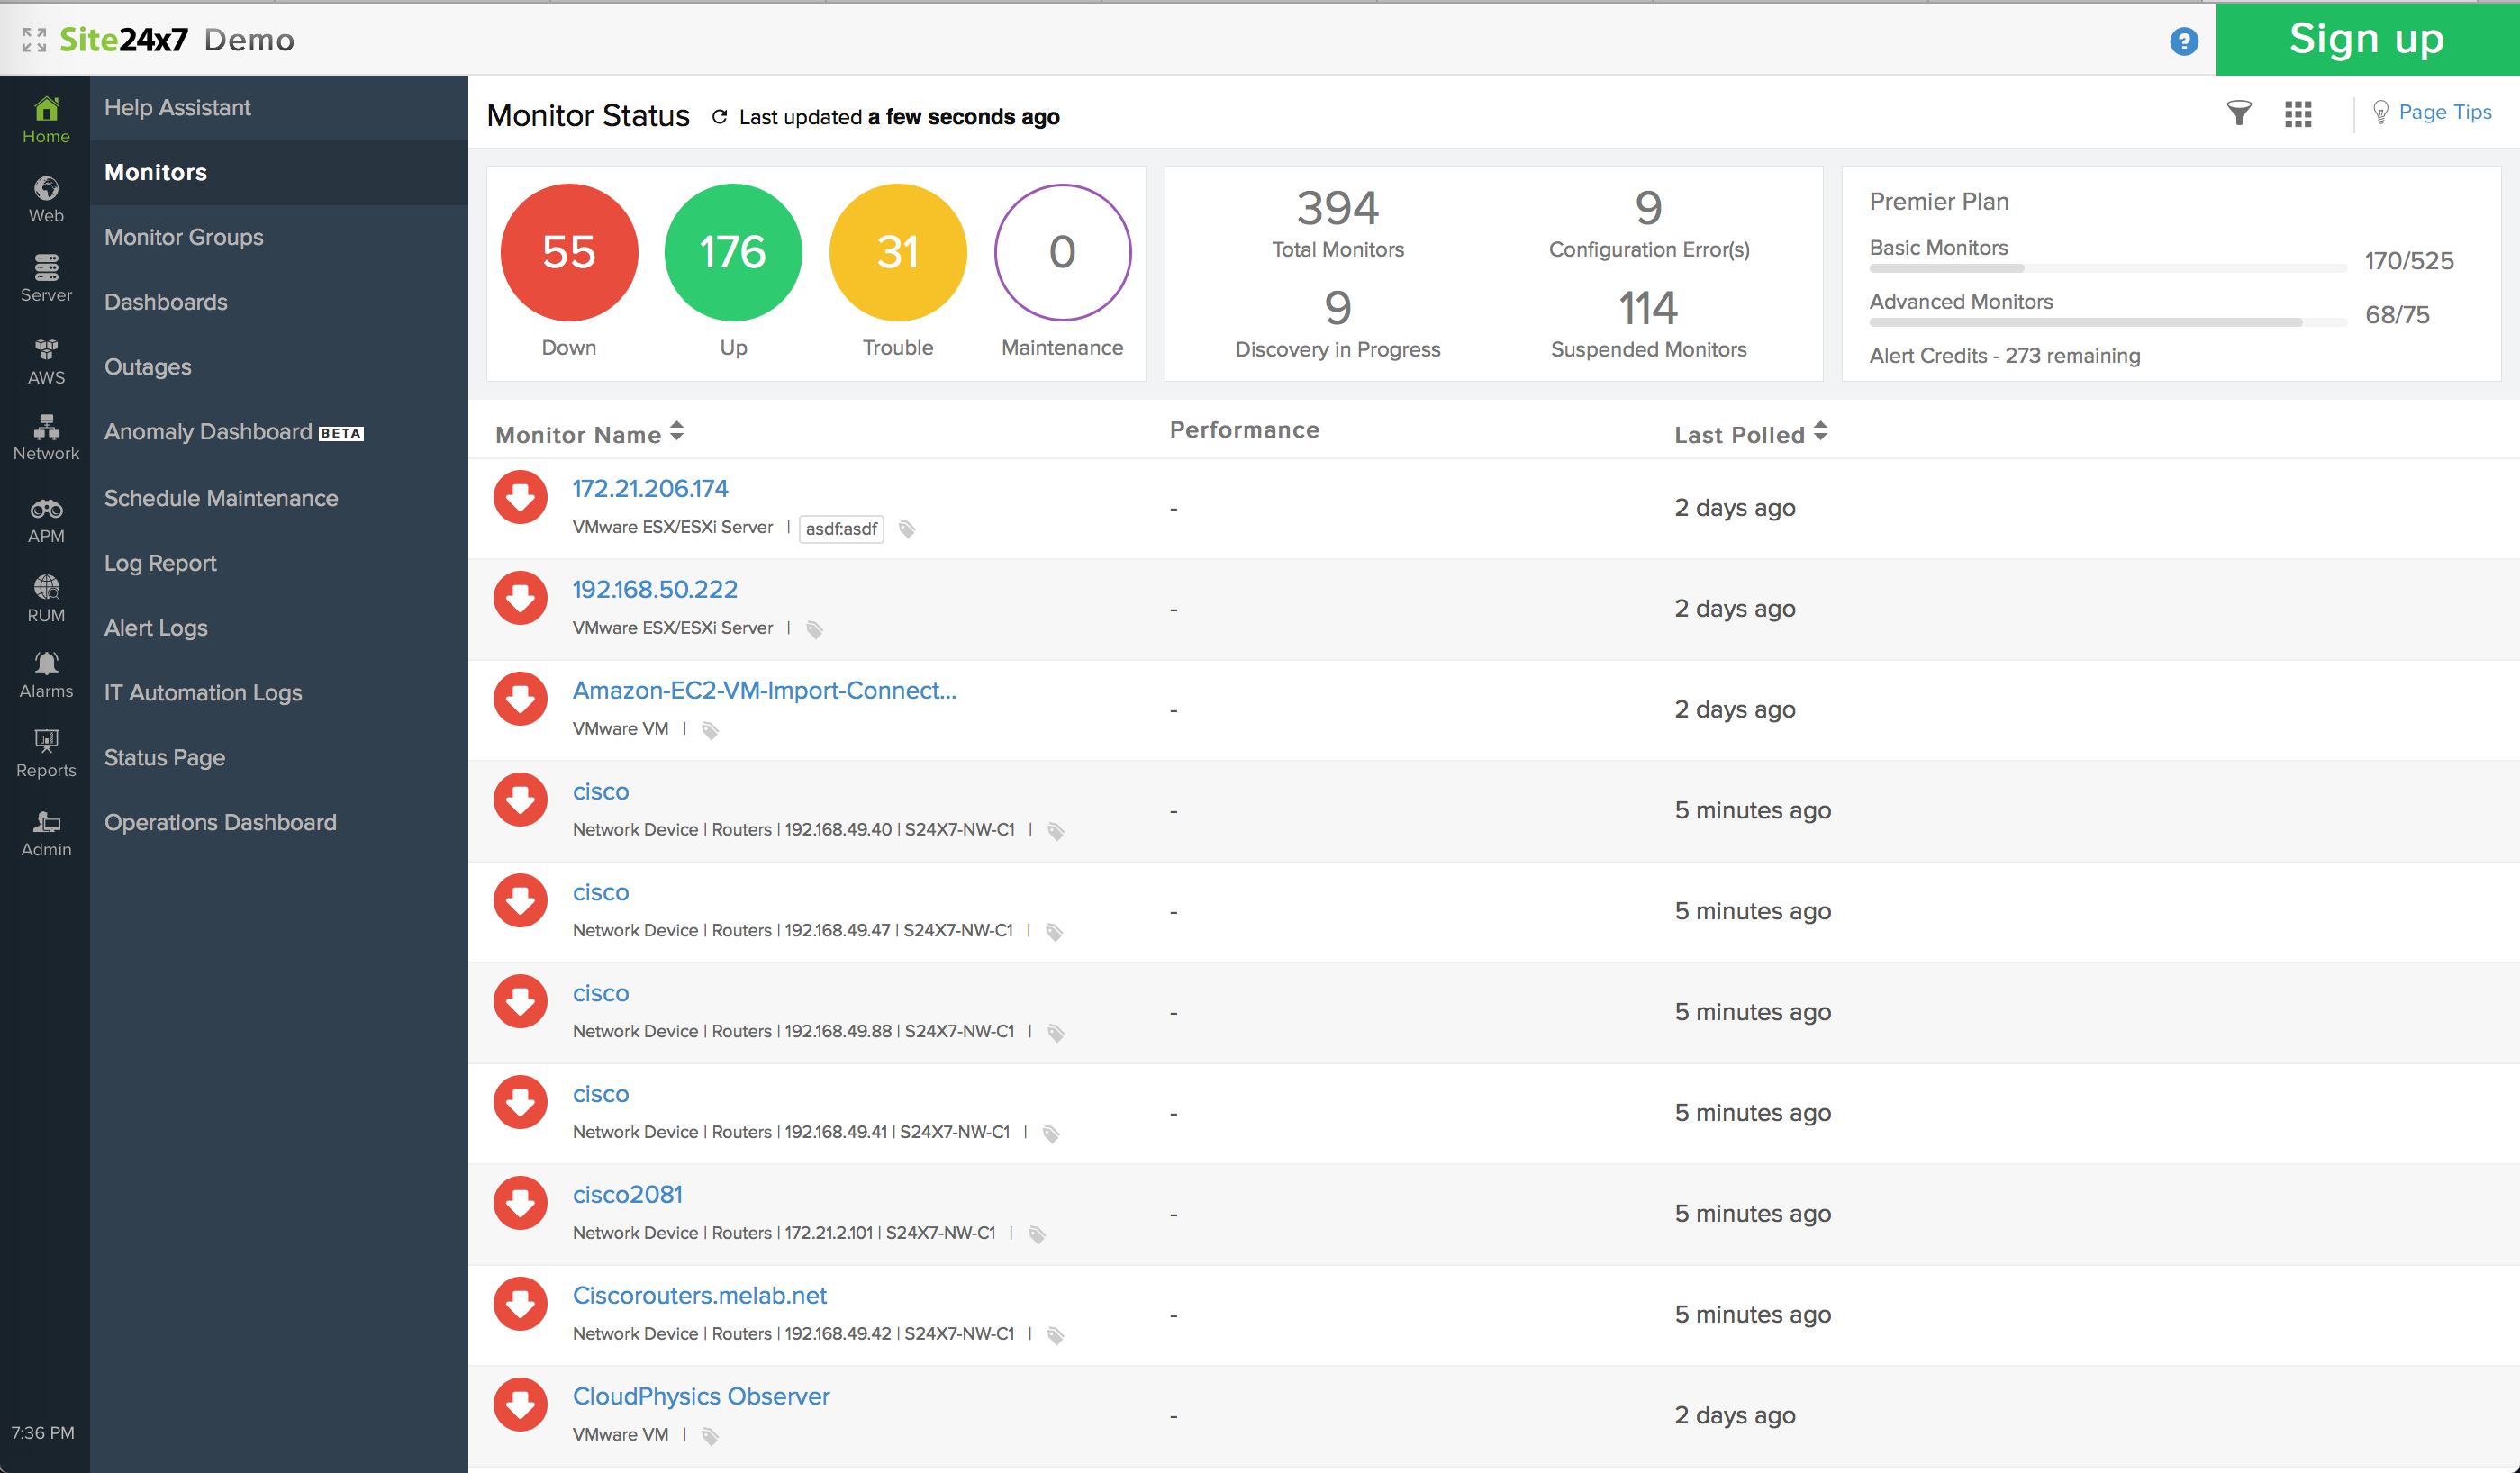
As part of our initiative to offer a new learning and demo platform, we've rolled out a full-fledged Site24x7 demo account. Think of the demo account as a sandbox or training environment where you can get as much hands-on experience as you need. Site24x7's demo account is populated with real data from preconfigured monitors. Users will have read-only access to all modules, except for the Admin module. You can learn more about the demo account and gain access here.
Enhanced status and license widget in dashboards
When you've got a large IT footprint, the chance of an issue creeping up on you is much higher, which makes resource tracking even more important. This is where our upgraded status widget comes to the rescue. Our revamped status widget lets you instantly view the availability status and overall monitor state of your monitoring resources. It gives you a high-level view of your overall resource count and your resources' operational status.
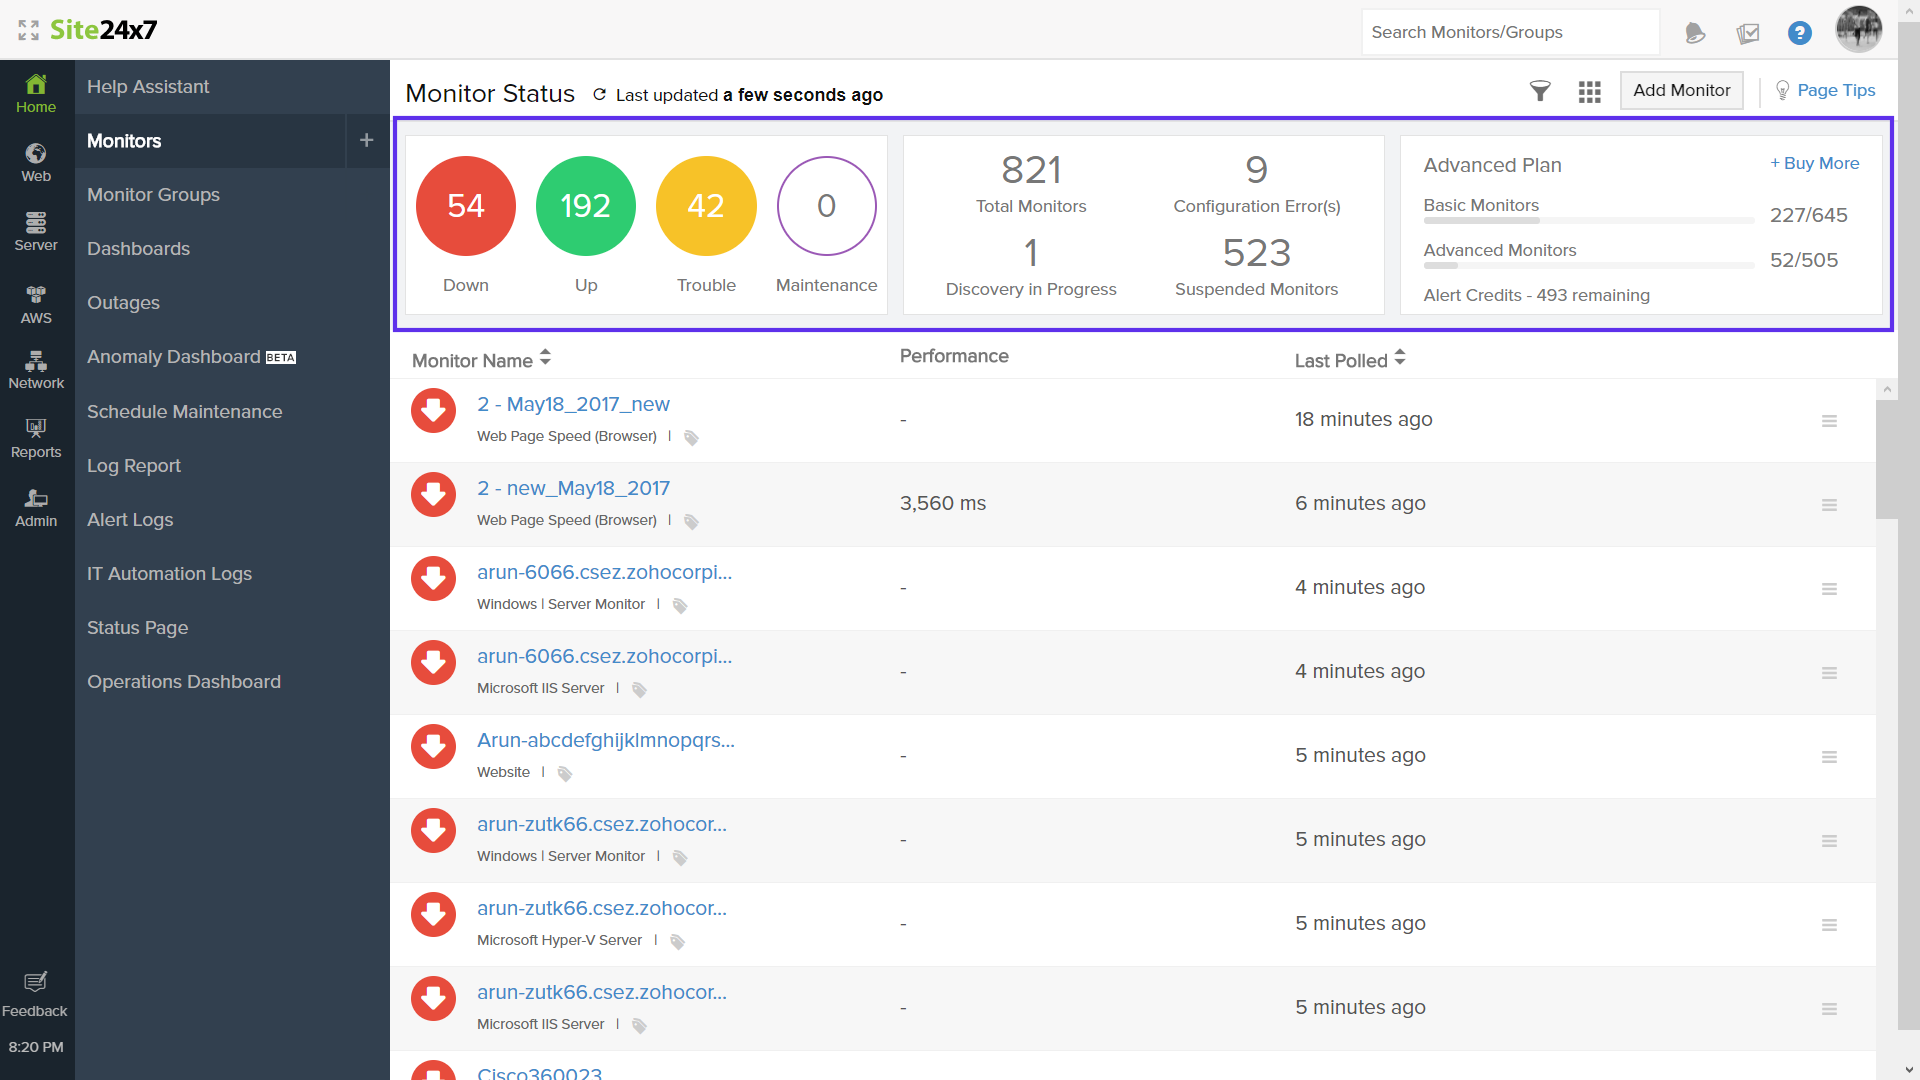
The click-enabled colored circles give you the actual count of monitors under each status (e.g. monitors having a configuration error, monitors under a suspended state, and monitors for which discovery is in progress). Additionally, you can now view your account's critical licensing details and purchase additional monitors and alert credits, if needed. The status widget has been upgraded inside the Home, Web, Server, and Network modules.
Multi-line chart widget to see data across monitors
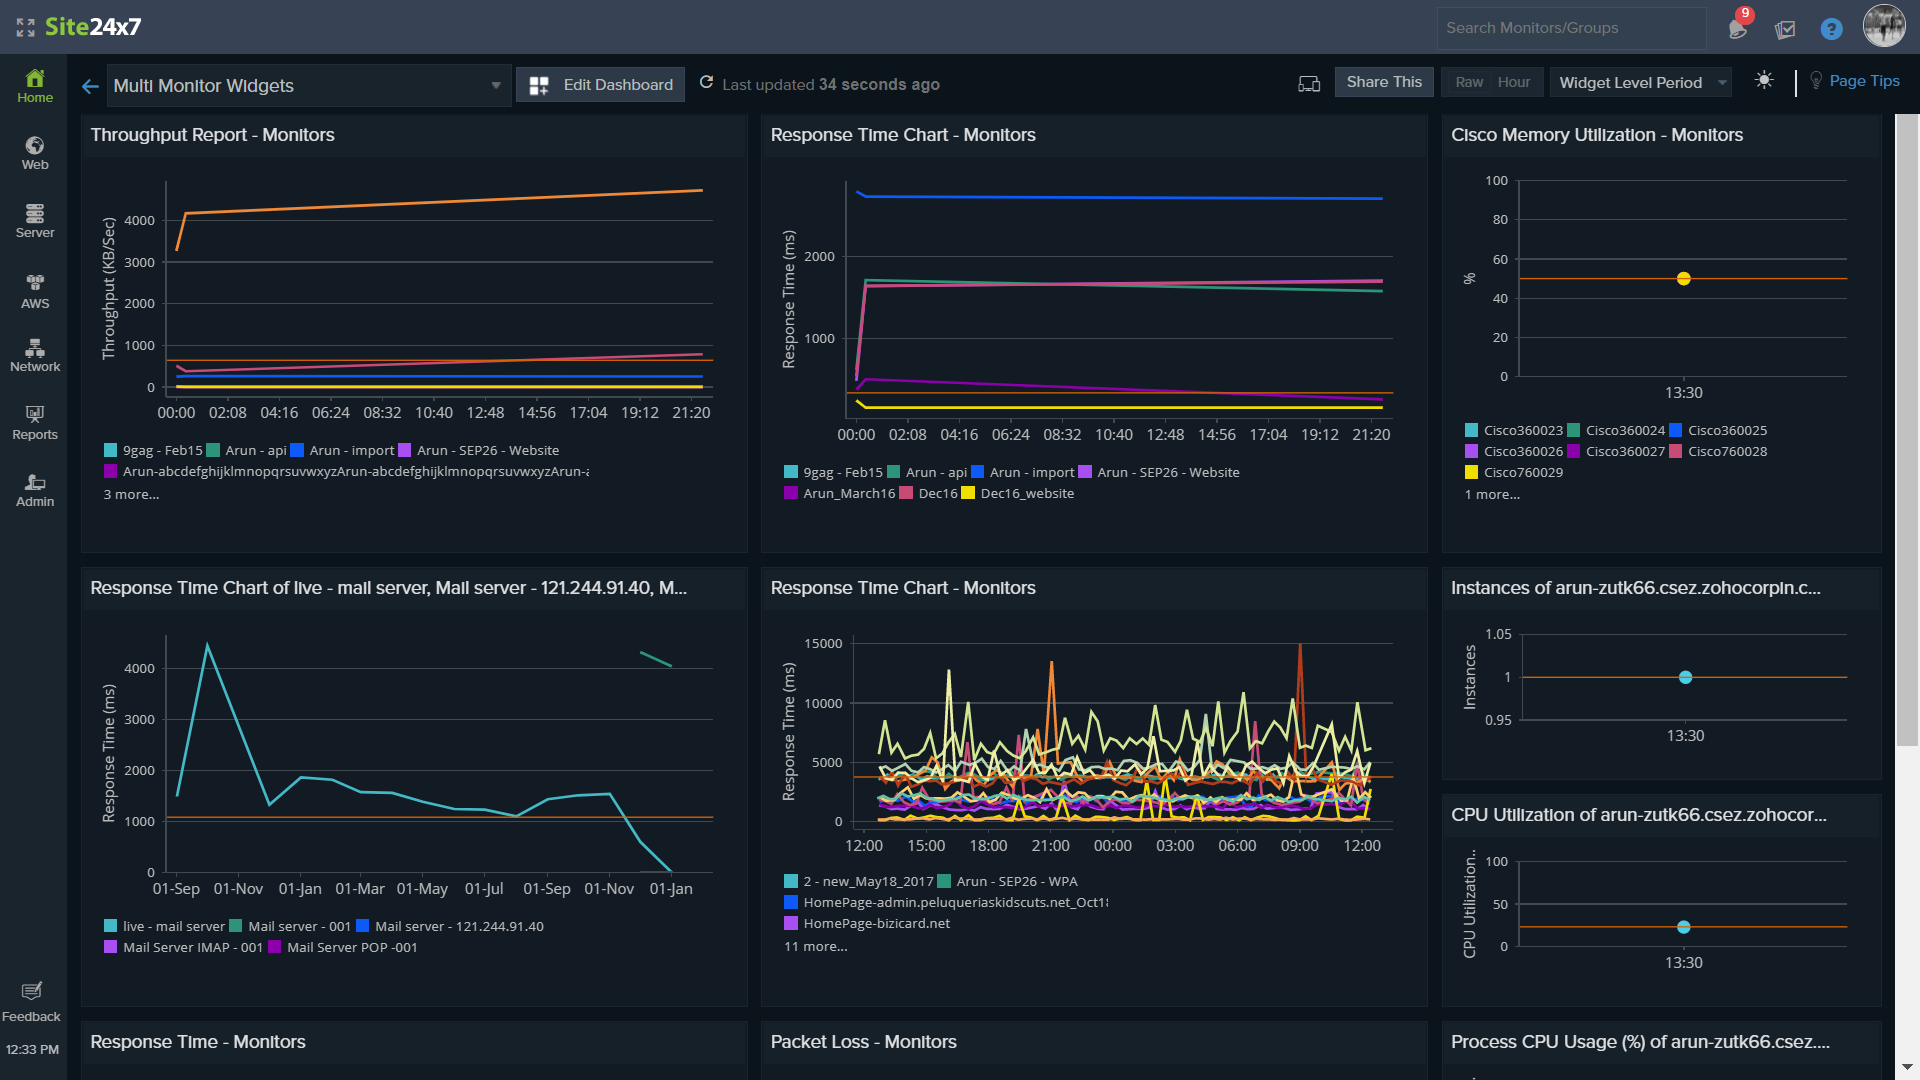
With our latest release, we've brought in some major enhancements to the Custom Dashboard. The Multi-Monitor Performance widget showcases unique metric data across different monitors of the same monitor type. Once configured, it portrays the metric data for up to 50 monitors as multiple line graphs.
Iframe widget: Integrate External Wiki Pages or Portal Links inside Site24x7
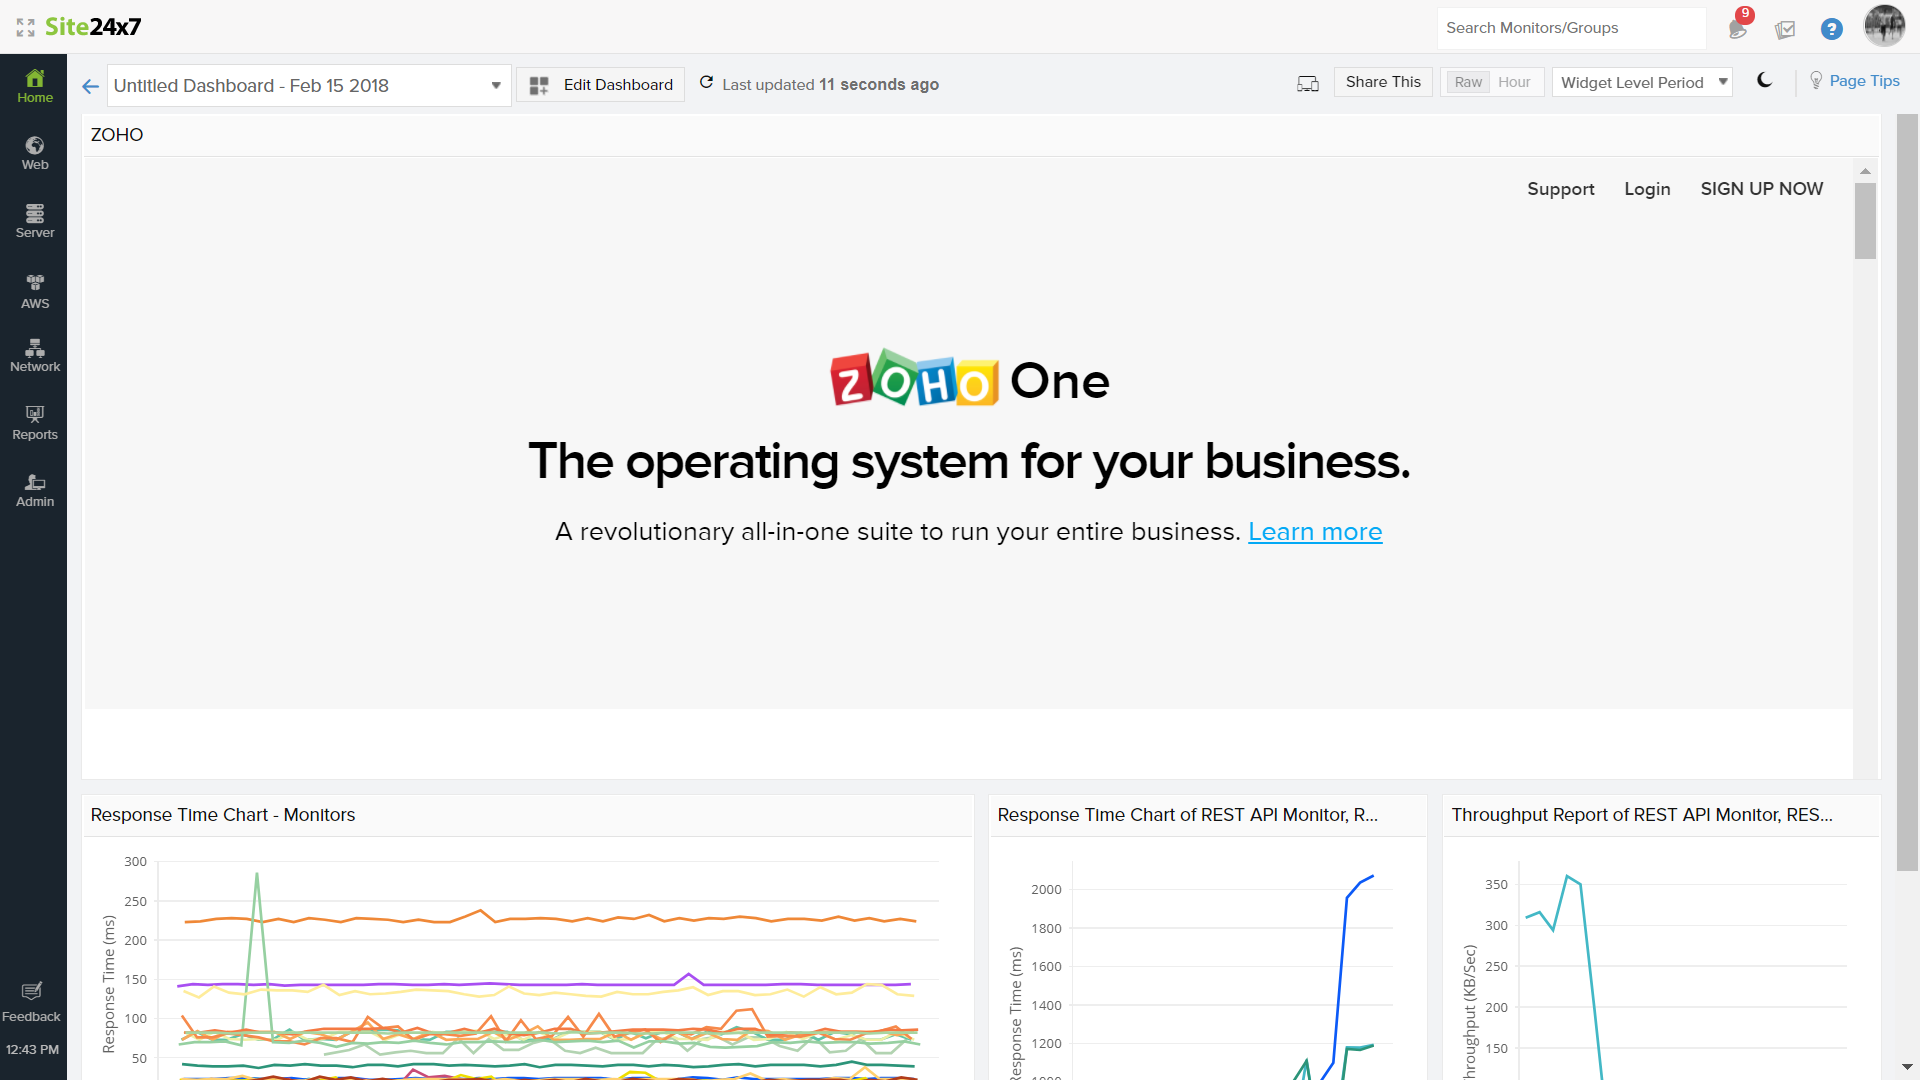
The Iframe widget lets you embed external permalinks of your wiki pages and other third-party portal links on your custom dashboard. Say you've got some critical reports in your third-party reporting and analytics tool. With the Iframe widget, you just have to paste the URL or permalink of that report in the URL field and save it. Ta-da! The third-party report will now be readily available on your Custom Dashboard. You'd not be able to integrate your Site24x7 dashboard inside the Iframe widget, though.
Change the look and feel of your dashboard dynamically
One thing you'll notice while using the Custom Dashboard is that it's been rearranged. The "Share this" and "Choose your device" buttons and a few other widgets have been repositioned inside the Dashboard view. This is done so that if you are accessing the same dashboard on a desktop or mobile browser, you can adjust the look and feel dynamically. The "Choose your device" button will now enable you to alter the layout of your dashboard, just for that moment alone. It can't be used to permanently change the dashboard layout.
The other major change is the introduction of a new widget-level time selector, along with a few new time periods (Last 1 hour, 6 hours, and 12 hours).
In the Edit Dashboard view, you can now redesign the grid pattern by selecting the size (up to 10 columns). For example, if you set the grid size to 8 columns, you'll be able to accommodate up to eight widgets in a single dashboard row. The Delete button in the Edit Dashboard view can be used to permanently delete a dashboard.

Site24x7 Control Panel: Perform bulk actions in the background
The bulk action feature saves you time by letting you edit, upgrade, delete, suspend, and activate multiple monitors in bulk. From now on, the following bulk actions can be executed as a background task inside the web client: Activation, Suspension, and Deletion.
On clicking the icon, you'll now be prompted with a detailed message about the actual status of the bulk action. You'll also receive an email once the bulk action task is initiated.
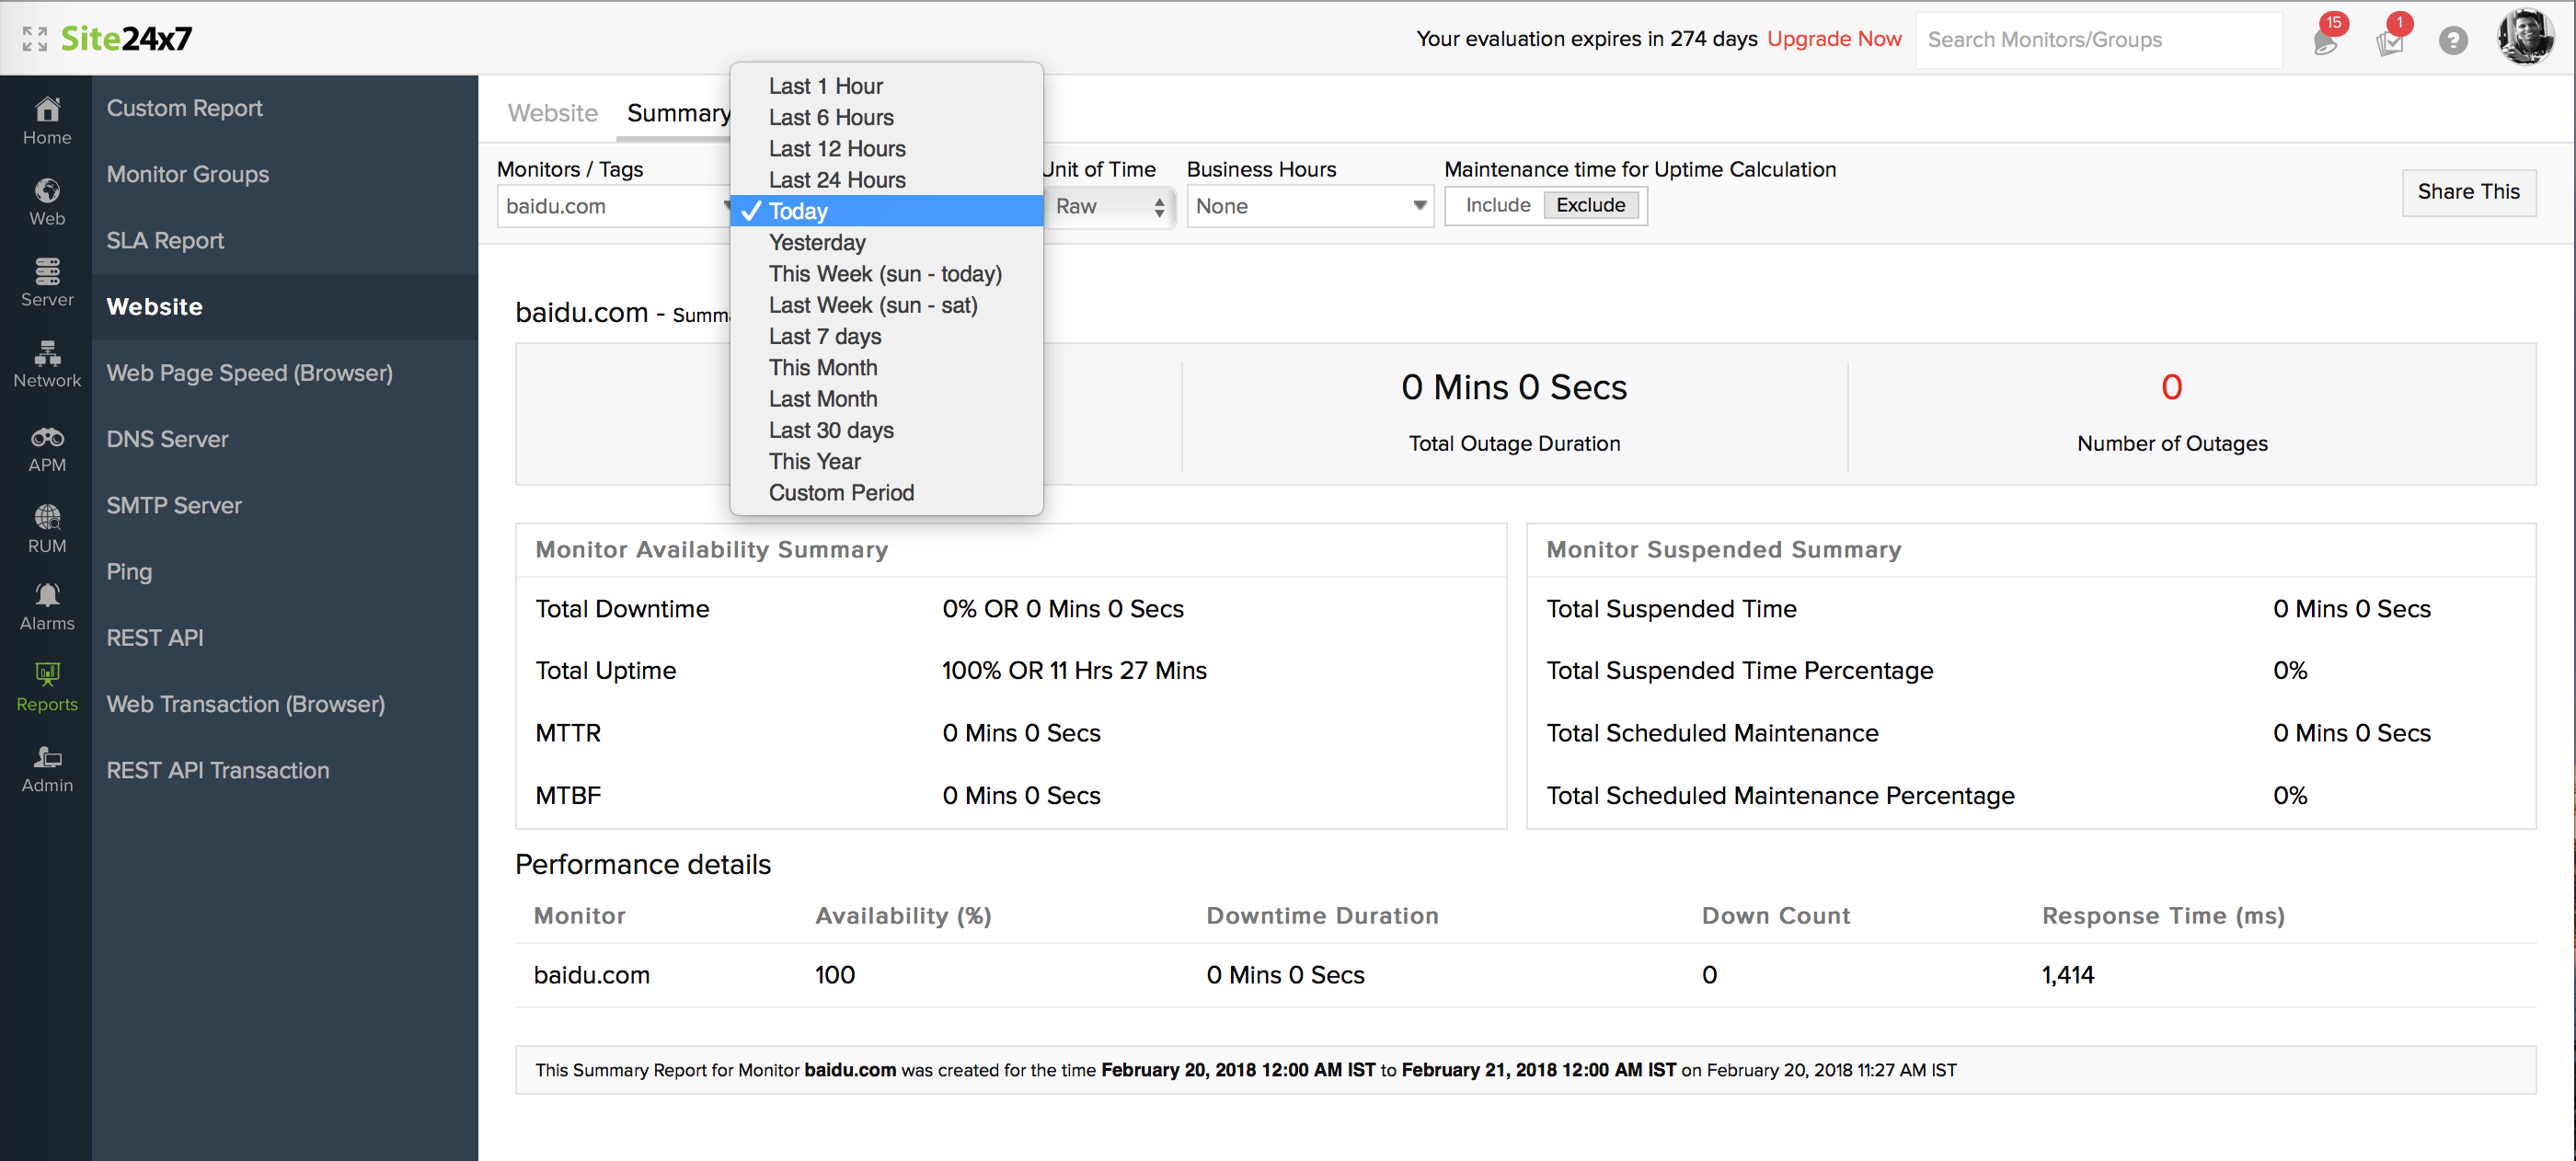
New time periods in Site24x7 reports
With our new release, you'll now have an option to view the monitor details and generate monitoring reports for the following time periods:
- Last 1 Hour
- Last 6 Hours
- Last 12 Hours
Handling report parameters in the URL
All report parameters are now handled in the URL itself. This facilitates easy sharing of report links with others. Since Site24x7 reports now cache selected headers during an API call, it also allows you to carry forward time periods and business hour options automatically across reports and generate reports faster than ever before.
Say you're generating a summary report for your website monitor with the time period selected as "Today" and the unit of time as "RAW". An API call will be initiated with the selected report headers. However, if you choose "Business Hours" for the same report, a new API call will be triggered along with the above settings and the new business hours ID. Now, if you unselect your business hours selection, no new API call will be initiated and the cached data will be reused for report generation.
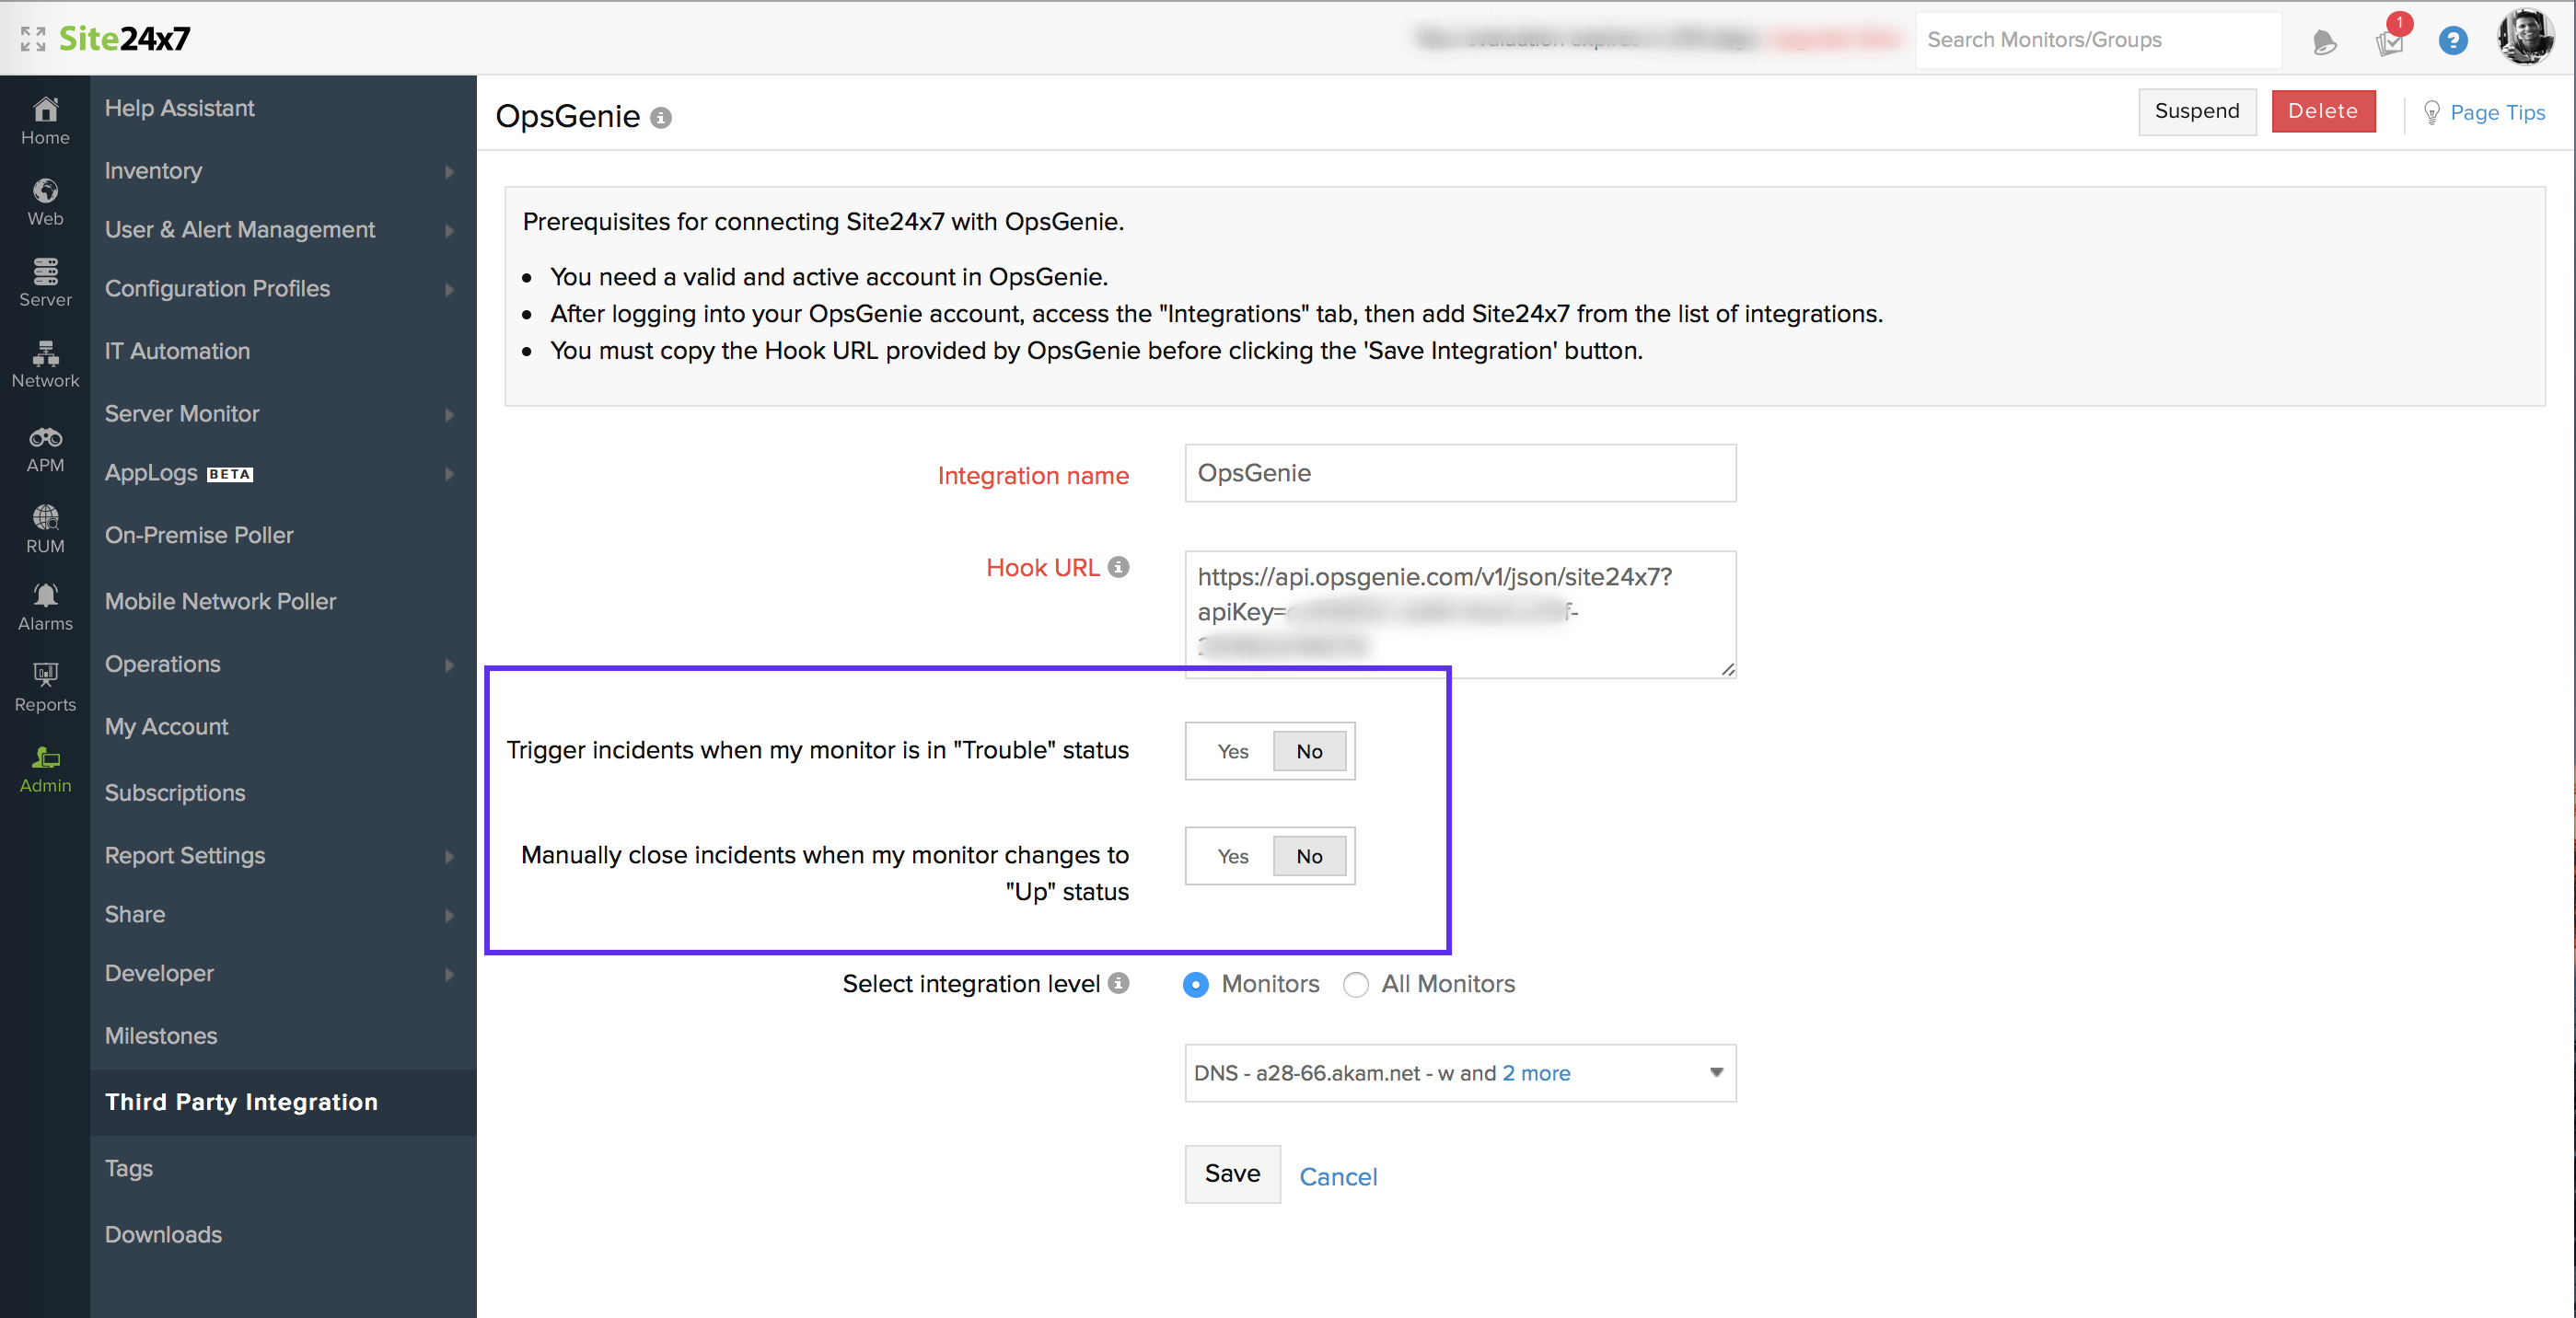
Enhancement of OpsGenie integration
We recently integrated with OpsGenie, enabling you to manage your Site24x7 alerts and incidents inside OpsGenie's portal. With this new enhancement to the integration, you can control incident triggers in OpsGenie based on your monitor's trouble status. You can also decide to close incidents manually or automatically in OpsGenie.
With this upgrade, we've done a lot of subtle changes that you've asked for. Keep your suggestions and feedback coming so we can keep improving our platform. If you have any questions, please contact us at support@site24x7.com .