As you may already know, Elastic Beanstalk lets you deploy and manage web applications without worrying about the administrative overhead of capacity provisioning, load balancing, and scaling. But since deployment automation means less visibility, operation teams can easily lose track of whats happening and can run into any of the following scenarios:
- The application becomes unavailable and stops responding to requests.
- Instances begin to run low on system resources.
- The load balancer has no healthy registered instances.
Regardless of whether you're running a web server or a worker environment, you need to know much more than "Is the health of my application environment OK". Today, I am excited to say that our monitoring support of Elastic Beanstalk helps you exactly achieve that.
A rundown of our capabilities are provided below:
Check the operational health of your application.
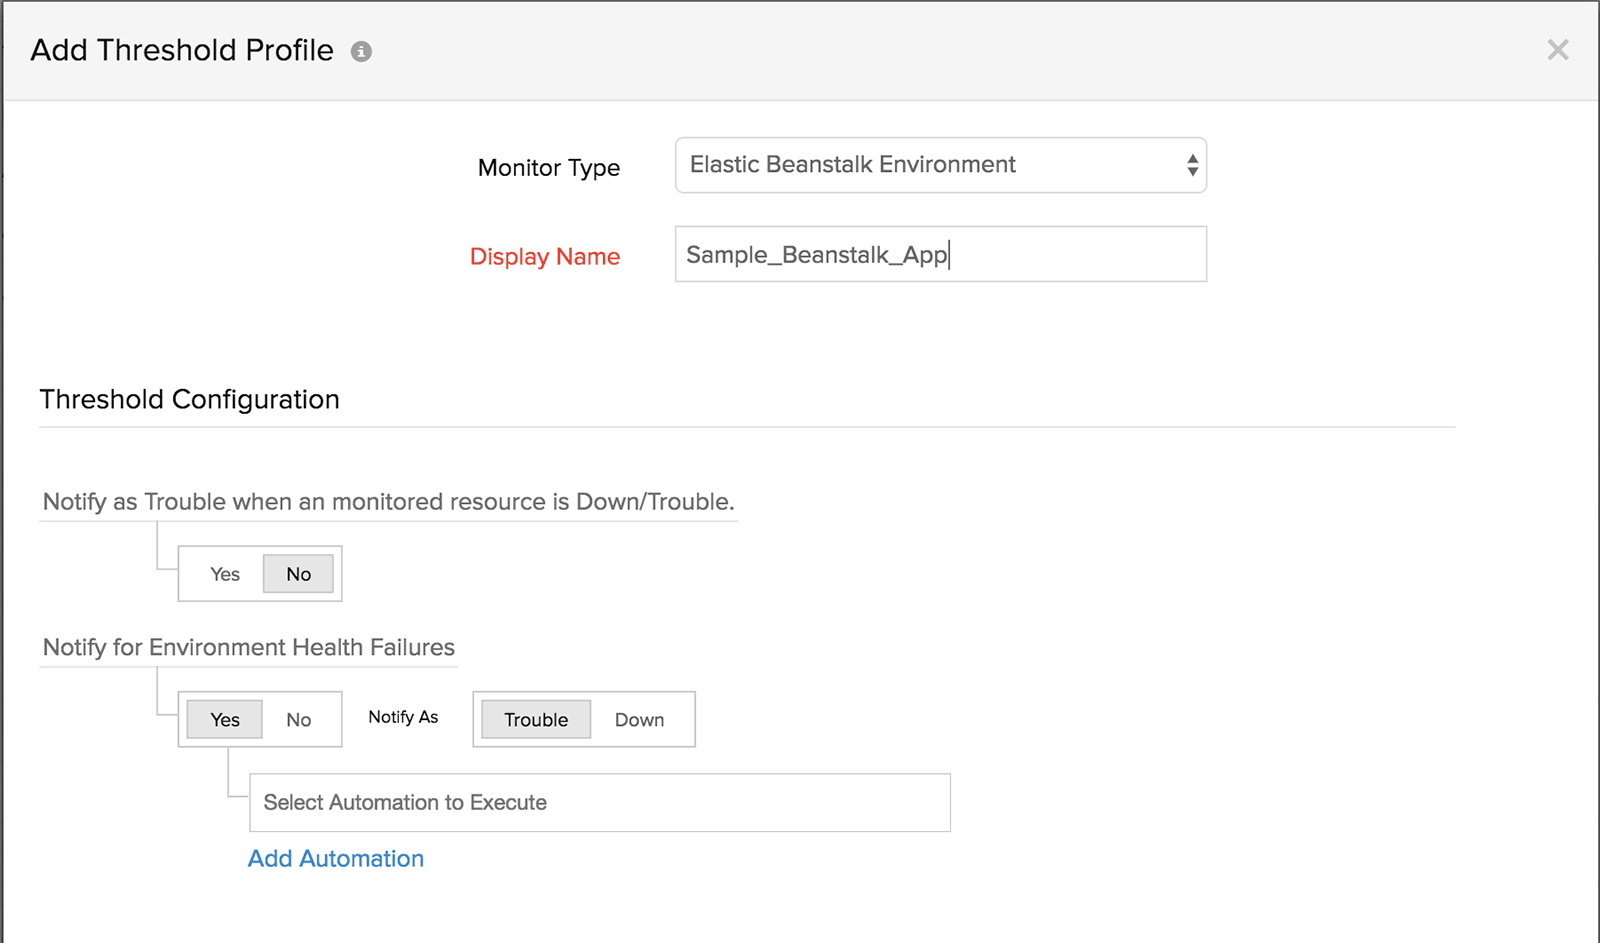
Respond promptly to critical situations. Get immediately notified when your Beanstalk environment's health status changes from Ok to Severe or Degraded.
Stay on top of performance with complete metric support.
Update your enhanced health reporting preferences and publish additional information to CloudWatch to record and track resource usage across a variety of instance health metrics using Site24x7's dashboards, alert policies, and integrated notifications.
Also deploy our dynamic server agent on your EC2 instances to collect OS data, application-level metrics, web server logs to get greater insight into infrastructure health and usage.
Collect basic CloudWatch metrics for individual instances of resources (EC2, Elastic Load Balancing, and SQS) powering your Beanstalk environment. You can also choose to get alerted at an environment level based on the status of the monitored resource.
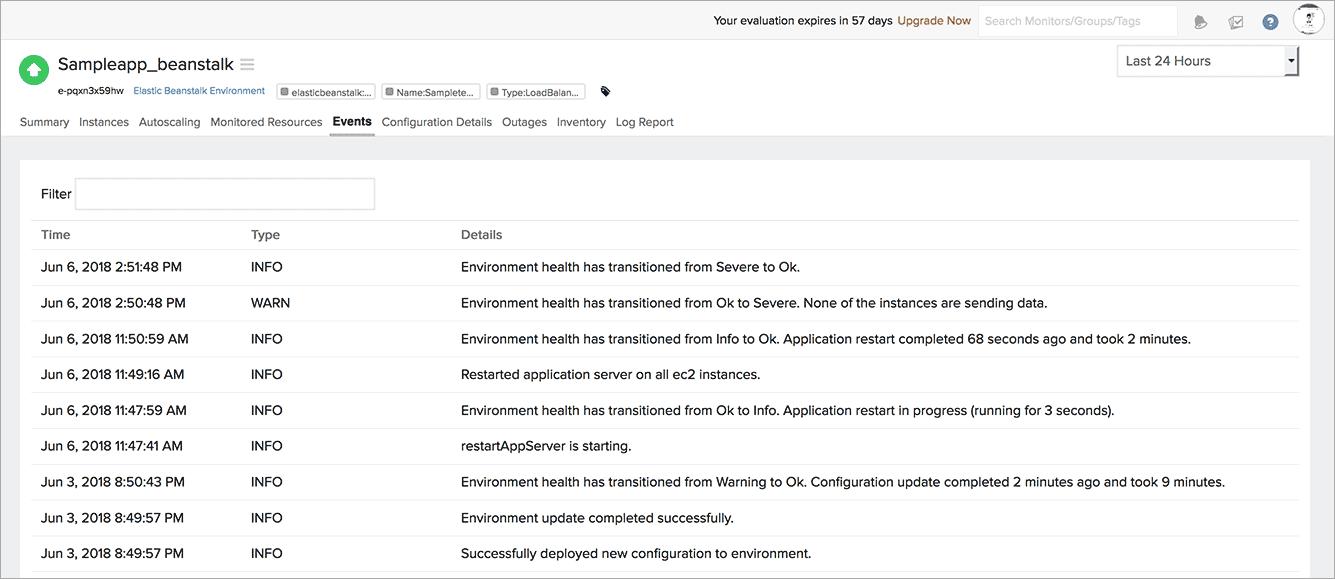
Compare health changes with recent events.
View the last 100 events and notifications associated with your environment in the Site24x7 console. Visualize the number of occurrences of a severity event (TRACE, DEBUG, INFO, WARN, ERROR, FATAL), and get alerted when the number of events crosses the threshold you've specified. Whenever your environment turns red, Site24x7 concatenates all events generated in the last 5 minutes into a text file and sends it out as an attachment in the alert mail to provide you more context.
You can also view a list of all scaling activities with a description for your AutoScaling groups and complete platform configuration information, within the Site24x7 console.
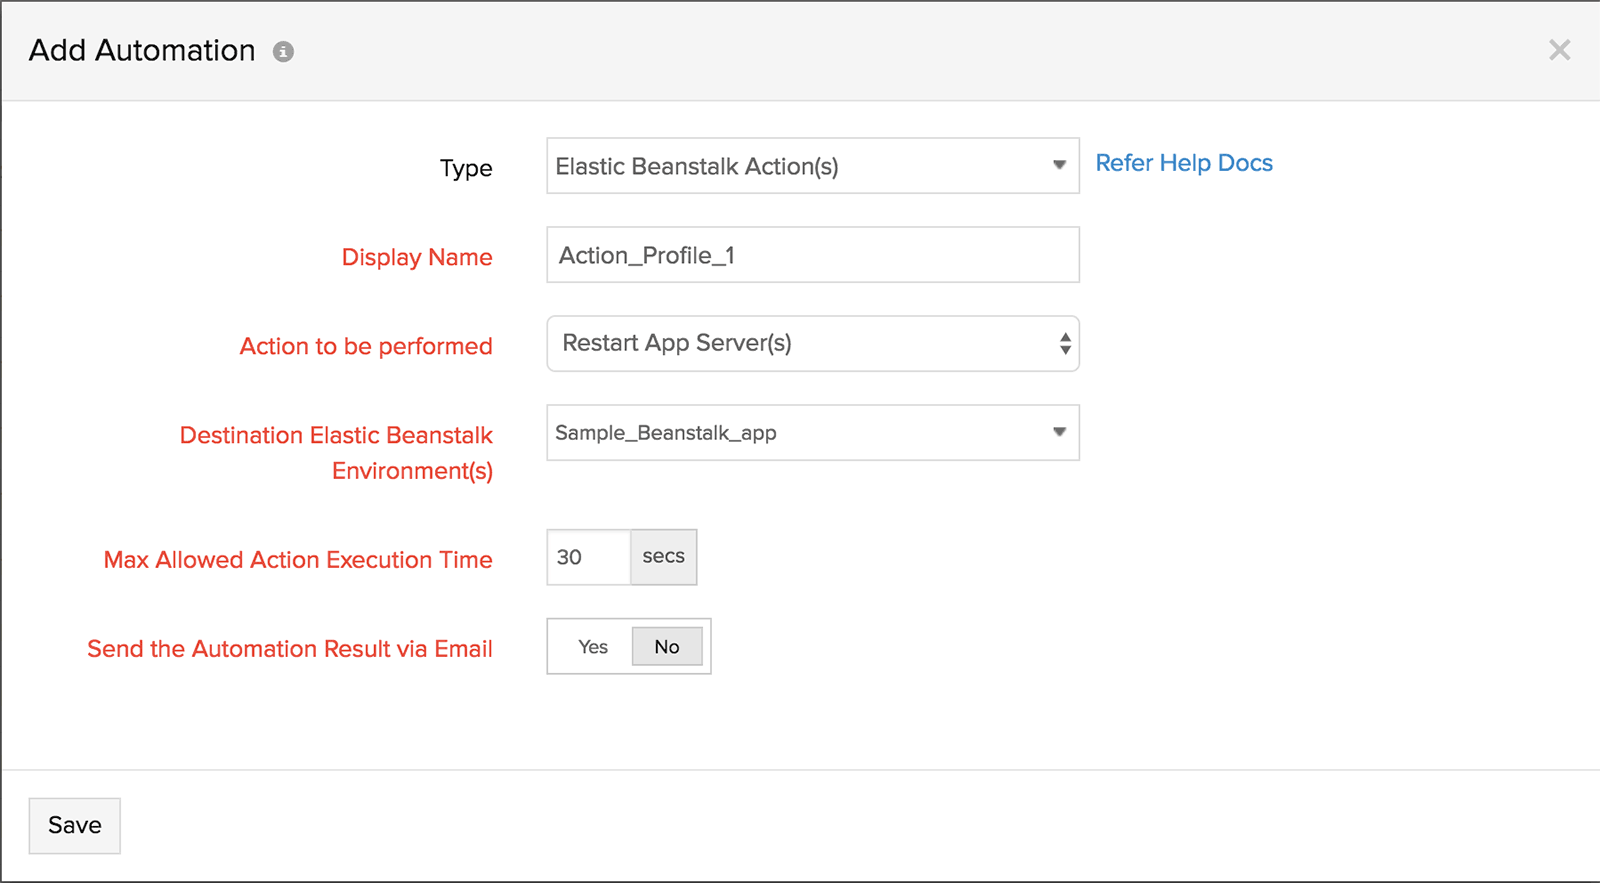
Automatically remediate issues
Either send out an alert notification in response to a threshold violation or automatically trigger an action to restart the web container service running on every EC2 instance. So whenever your application environment starts to behave strangely (request latency continuously pegged at higher levels or too many HTTP 4xx errors), you can restore normalcy by restarting the web server.
A few important things you need to know about our integration:
- Availability: Elastic Beanstalk integration is available to all Site24x7 customers, both in the free and paid subscription plan.
- Licensing: Each Beanstalk application environment is considered a basic monitor.
Getting started
The AWS customers who are already monitoring their infrastructure and PaaS services can enable monitoring for their Beanstalk environment as part of their existing integration. Read our documentation to know more about the real level permissions required.
If you haven't started, follow these simple steps to integrate your account and start seeing data for key AWS services in minutes.